

1 Introduction
The catalytic dehydrogenation of light alkanes by selective oxidation is an attractive route for the synthesis of C2–C4 olefins [1–10]. In contrast to the direct dehydrogenation (DH) [6], the presence of O2 as an oxidant (ODH) [4,5,7–10] contributes to an exo-thermicity that helps to achieve a control over the carbon deposition problem, albeit to the expense of the performance in selectivity grounds. Therefore, the achievement of high selectivities at significant conversions is of utmost importance and remains a formidable challenge in the design of efficient catalysts for the ODH of light alkanes.
Oxides of transition metals (e.g., V, Mo, W, etc.) in the form of a deposited oxometallic phase on a typical oxidic support (e.g., Al2O3, TiO2, etc.) constitute a well-established class of catalytic materials that have been examined for the ODH catalytic reaction [3–5,8,9,11,12–17]. The choice of a particular transition metal oxide (as the active phase) greatly affects the catalyst performance. For example, V2O5-based catalysts are by far superior to their respective MoO3-based counterparts for the ODH of light alkanes [17,18]. The efficient activation of the C–H alkane bond is directly related to inter alia: (a) the speciation of the oxometallic species in the deposited phase; (b) the local structure at the molecular level; (c) the active phase coverage; (d) the nature of the support; (e) the applied synthesis route.
Most commonly, the studied catalysts are synthesized by wet impregnation involving a contact of the support grains with a solution containing the oxometallic precursor species at a specified pH and concentration and removal of the solvent by evaporation. Typically, such a step is followed by drying and calcination. However, during the evaporation of the solvent, drastic changes occur in the concentration and pH of the impregnating solution, thereby greatly affecting the speciation of the oxometallic solute species (resulting also in massive precipitation and formation of overlayers).
The application of the equilibrium deposition filtration (EDF) synthesis method (also called equilibrium adsorption method) gives rise to catalyst materials with high dispersion of the deposited species [19]. By applying this technique, certain physicochemical properties can be tailored to a significant extent and thus a suitable catalytic behavior for a given reaction may be obtained through a molecular-level-understanding of the processes taking place at each preparation step. For example, the deposition step takes place at equilibrium with precise control of the deposition pH and the solid–liquid separation takes place by filtration leading to the removal of the non-adsorbed oxometallic precursors with the filtrate, thereby resulting in a high dispersion of oxometallic species on the support. To this end, we have synthesized three series of titania-supported transition metal oxide catalysts [(MoOx)n/TiO2, (WOx)n/TiO2 and (VOx)n/TiO2] and tested them for the ODH of ethane. The catalyst synthesis was done by applying the EDF method in a wide range of deposition pH 9.5–4 and solution concentrations of Mo(VI), W(VI) and V(V) lying on the plateau of the respective adsorption isotherms of Mo(VI), W(VI) and V(V) on TiO2 [20–22]. In situ Raman spectra were recorded at 430 °C under O2(g) and the response of the catalyst molecular structure was examined by applying reaction conditions (C2H6/O2/He) and reducing conditions (C2H6/He). Catalytic measurements were undertaken in the temperature range of 420–480 °C at various residence times. The data are used to discuss structure/activity–selectivity relationships for the ODH of ethane.
2 Experimental
2.1 Synthesis and textural characterization of catalyst samples
The catalyst samples were prepared by the Equilibrium Deposition Filtration (EDF) method. The support material used was industrial titania (Degussa P25, 80% anatase–20% rutile) with a surface composition of 90% anatase and 10% rutile [23,24]. The precursors used for preparing the impregnation solutions were (NH4)6Mo7O24·4H2O, (NH4)10W12O41·5H2O and NH4VO3. The ionic strength of the solutions was adjusted with 0.1 M NH4NO3. For each synthesis, 3.5 g of titania were added to 175 mL of the respective solution in a 25oC-operated thermostatted double-wall pyrex vessel equipped with a magnetic stirrer and a Perspex lid with appropriate fittings for electrodes and N2 admission (necessary to prevent CO2 from interfering with the solution pH). The samples were prepared at different pH (in the range 9.5–4, automatically controlled) and initial concentrations lying on the plateau of the adsorption isotherms of Mo(VI), W(VI) and V(V) [20–22]. The samples were collected by filtration, following a 24-h equilibration, dried at 110 °C for 4 h and then calcined in air in a muffle furnace at 450 °C for 5 h. The calcined samples are denoted as xMTi, where x denotes the surface density (M/nm2) and M denotes the particular transition metal (M = Mo, W, V). The catalyst loading (% wt M) was found by determining spectrophotometrically the initial and equilibrium concentrations of Mo(VI), W(VI) or V(V) in the impregnation solutions [25]. The surface density (M/nm2) was calculated for each sample by combining the % wt M loading with the corresponding BET specific surface area (SBET).
The specific surface area was measured by N2 adsorption (following a 2 h evacuation) and standard multipoint BET methods in a Micromeritics Gemini II 2370 analyser. A Philips PW 1830 diffractometer with CuKα radiation was used to obtain the X-ray diffraction patterns of the studied catalysts and the only crystalline phase detected was anatase.
Table 1 compiles important synthesis parameters and characteristics of the catalyst samples.
Synthesis parameters and properties of the MOx/TiO2 (M = Mo, W, and V) catalysts.
| Catalyst | pH/initial M concentration (M) | Loading, (wt% M) | SBET (m2/g) | Surface density (M/nm2) |
| 0.3MoTi | 9/10−2 | 0.26 | 53.7 | 0.3 |
| 2.6MoTi | 6/1.5 × 10−2 | 2.21 | 53.5 | 2.6 |
| 3.8MoTi | 4/2.5 × 10−2 | 3.18 | 51.8 | 3.8 |
| 1.7WTi | 9/5 × 10−3 | 2.77 | 52.2 | 1.7 |
| 1.9WTi | 7/4.2 × 10−3 | 3.03 | 52.7 | 1.9 |
| 3.8WTi | 5/2 × 10−2 | 5.89 | 51.5 | 3.8 |
| 1.9VTi | 9.5/6 × 10−3 | 0.84 | 51.7 | 1.9 |
| 2.8VTi | 7/5 × 10−3 | 1.22 | 51.7 | 2.8 |
| 4.0VTi | 5/2 × 10−2 | 1.69 | 50.6 | 4.0 |
2.2 In situ Raman spectroscopy under oxidizing (O2), ODH reaction and reducing (C2H6/He) conditions
A homemade Raman cell (previously described in e.g., [10,26]) was used to record the in situ Raman spectra of the catalysts. A detailed description of the apparatus and of the procedures used to record in situ Raman spectra from catalyst materials can be found in previous articles [10,26]. Raman spectra were excited using the 488.0 nm line of a Spectra Physics Stabilite 2017 Ar+ ion laser. In order to reduce sample irradiance, the incident laser light (adjusted at a 40 mW power level) was slightly defocused.
In situ Raman spectra were obtained for the studied catalysts under flowing (15 cm3 min−1) O2 gas (99.999%) at 430 °C following a 1 h treatment. Subsequently, for monitoring the response of the catalysts' molecular structure to changes in the reactor gas atmosphere, each sample was subjected to a 20 cm3 min−1 flow of 5.6% C2H6/5.6% O2/He reaction mixture for 1 h and thereby the in situ Raman spectrum was recorded under ethane ODH reaction conditions. Finally, each catalyst was reoxidized under flowing O2 for 1 h and was exposed to a 20 cm3 min−1 flow of 11.2% C2H6/He for 1 h and its in situ Raman spectrum was recorded under reducing conditions. In order to be able to perform mutual comparisons among spectra of different samples, all Raman spectra were normalized. The normalization was performed by dividing each entire spectrum by the total area under the spectrum in the wavenumber region of interest (550–1100 cm−1); prior to this process the baselines of the spectra were zeroed by subtracting the minimum intensity (at ca. 1100 cm−1) from the intensities at each point.
2.3 Catalytic measurements
The catalytic measurements were performed in a differential fixed-bed reactor, described previously [10]. The reactor cell comprised a quartz frit for holding in place the catalyst powder as a fixed-bed (particle size, 125–180 μm). The reactant gas mixture consisted of 5.6% C2H6 and 5.6% O2 balanced in He and was admitted after 1 h of treatment under flowing O2 at 480 °C. The samples were first examined at a residence time (expressed as the W/F ratio; W: catalyst weight; F: total flow) of W/F = 1.25 g s cm−3 for the Mo/TiO2 and W/TiO2 series; and 0.06 g s cm−3 for the V/TiO2 series in the temperature range 420–480 °C. The above W/F values were selected in such a way that the conversion measured for the most reactive sample in each series is below 10% at the highest measured temperature (480 °C). For studying the temperature dependence of catalytic activity, measurements started at 480 °C and were repeated for each system at fixed temperature intervals (in the range 480–420 °C). Finally, the effect of residence time was checked by varying the W/F in the range of 0.03–1.25 g s cm−3 (by varying either the catalyst weight or the total gas flow) at a fixed temperature of 480 °C. All gas flow rates were controlled by using electronic mass flowmeters.
The gas stream exiting the reactor was analyzed by using an on line Schimadzu 14B GC using Porapak Q and Molecular Sieve 5A packed columns in a series or bypass configuration and a TCD detector. The catalytic measurements as well as their temperature dependence were performed under conditions where conversions were below 10% in order that differential reactor conditions could be safely assumed and apparent activation energies could thereby be inferred. Runs with an empty reactor were done in order to check that the possible contribution of gas phase reactions and the pertinent ethane conversion at 480 °C was negligible.
The selectivity, SN, with reference to a specific product of the reaction (N = C2H4, CO, and CO2) was determined by:
- : the molar flow rate of component N at the reactor exit, with n = 1 for C2H4 and n = 2 for CO and CO2;
- : the molar flow rates of C2H6 at the reactor inlet and exit, respectively (moles ethane/s);
Finally, the reaction rates expressed in terms of the turnover frequency (TOF, expressed as moles of C2H6 converted per sec and per mole of M) were determined by:
- : the molar flow rates of C2H6 at the reactor inlet and exit, respectively (moles ethane/s);
- SBET: the catalyst BET specific surface area (m2/g);
- W: the catalyst weight (g); and
- ns: the surface density (mol M/m2)
3 Results and discussion
3.1 In situ Raman spectra of MOx/TiO2 (M = Mo, W and V) catalysts
3.1.1 In situ Raman spectra under O2(g)
Figs. 1,2 and 3 show the in situ normalized Raman spectra obtained under flowing O2(g) at 430 °C for the (MoOx)n/TiO2 (Fig. 1), (WOx)n/TiO2 (Fig. 2) and (VOx)n/TiO2 (Fig. 3) catalyst samples. A well-defined band observed at 992–995 cm−1 for (MoOx)n/TiO2, 1005–1008 cm−1 for (WOx)n/TiO2 and 1026–1029 cm−1 for (VOx)n/TiO2 is due to the terminal MO (M = Mo, W, and V) stretching mode, νMO, of deposited mono-oxo metallates [26–28]. The band due to the νMO mode evolves with gradually increasing relative intensity with increasing metal surface density (M atoms/nm2). At the same time, its position undergoes a concurrent progressive slight blue shift, i.e. the νMoO shifts from 992 cm−1 for 0.3 Mo/nm2 to 995 cm−1 for 3.8 Mo/nm2; the νWO shifts from 1005 cm−1 for 1.7 W/nm2 to 1008 cm−1 for 3.8 W/nm2; and the νVO shifts from 1026 cm−1 for 1.9 V/nm2 to 1029 cm−1 for 4.0 V/nm2. The νMO band asymmetry (i.e. tailing at its low-frequency side, especially for samples with coverage higher than 2 M/nm2) is due to the occurrence of a number of structurally related (OMOx)n configurations in sites with local variation in the coordination number of the metal atom (CNM) and/or with varying extent of polymerization. Notably, the signal-to-noise ratio for the 4.0VTi catalyst (Fig. 3) is inherently lower due to the very dark color exhibited by this sample at elevated temperatures, thereby leading to partial absorption of the incident laser radiation.
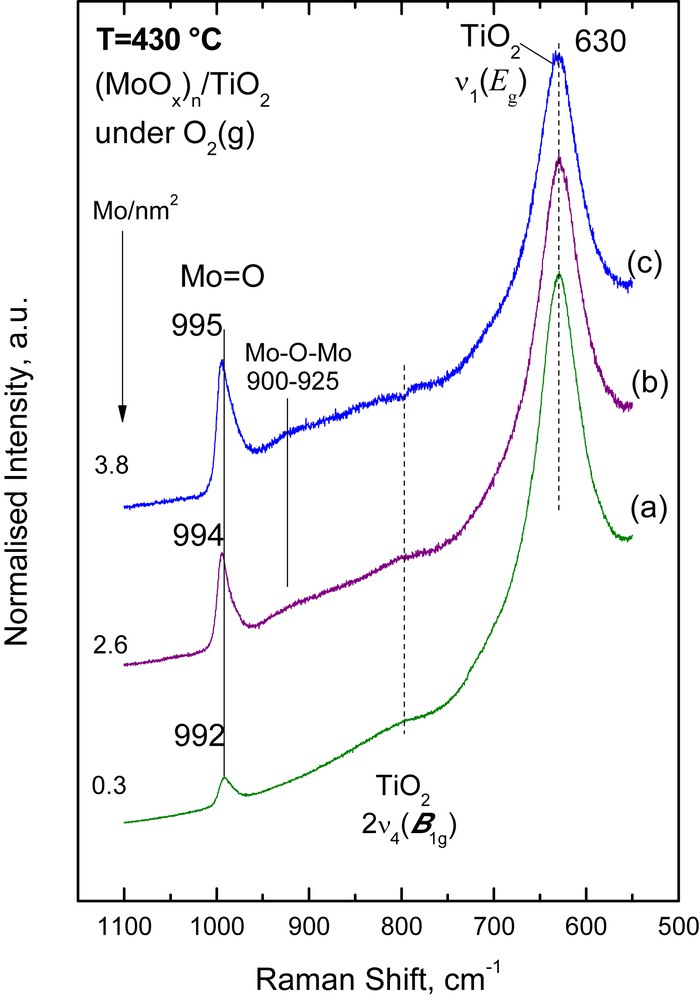
In situ normalized Raman spectra of (MoOx)n/TiO2 catalysts under flowing O2(g) at 430 °C: (a) 0.3 Mo/nm2; (b) 2.6 Mo/nm2; (c) 3.8 Mo/nm2. Laser wavelength, λ0 = 488.0 nm; laser power, w = 40 mW; spectral slit width, ssw = 7 cm−1.
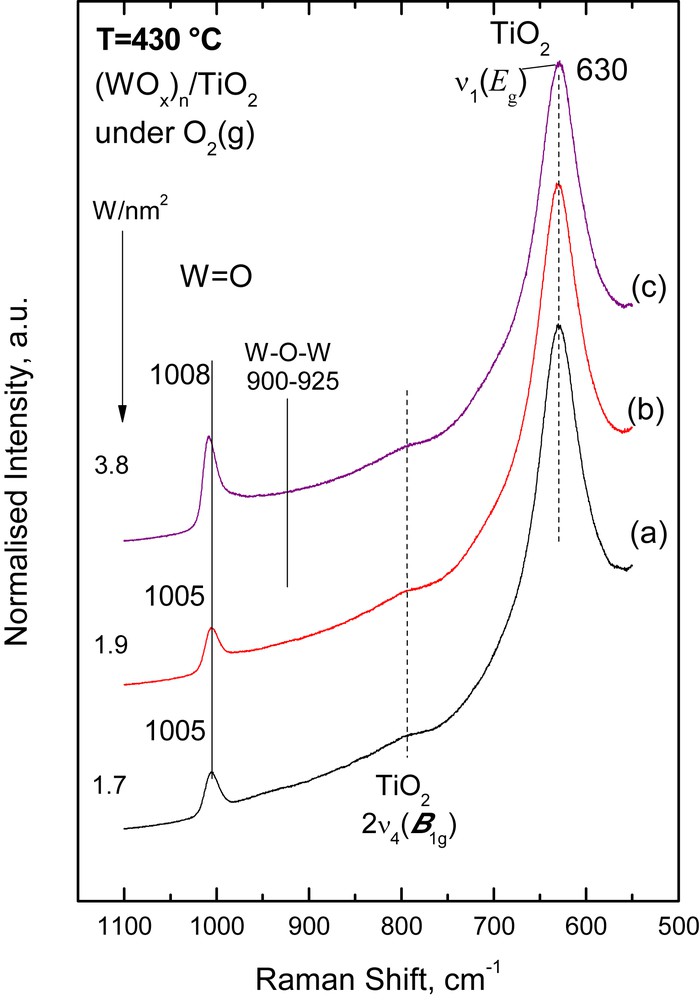
In situ normalized Raman spectra of (WOx)n/TiO2 catalysts under flowing O2(g) at 430 °C: (a) 1.7 W/nm2; (b) 1.9 W/nm2; (c) 3.8 W/nm2. Recording parameters: see Fig. 1 caption.

In situ normalized Raman spectra of (VOx)n/TiO2 catalysts under flowing O2(g) at 430 °C: (a) 1.9 V/nm2; (b) 2.8 V/nm2; (c) 4.0 V/nm2. Recording parameters: see Fig. 1 caption.
An inherently weak/broad feature at 900–940 cm−1 assigned to bridging M–O–M functionalities [26,28], νM−O−M, is observed in all three systems, albeit at different relative intensities. The relative intensity of the νM−O−M mode flags the extent of association/polymerization of the deposited oxometallic phase. In particular, νMο−O−Mο is observed at 900–925 cm−1 only for the samples with medium (2.6 Mo/nm2) and high (3.8 Mo/nm2) surface density (Fig. 1). A νW−O−W weak/broad feature is observed only for the high loaded 3.8 W/nm2 WOx/TiO2 sample (Fig. 2), evidenced from the elevated background in the 900–925 cm−1 range. The relative intensity of the νV−O−V mode (clearly observed in the 890–940 cm−1 range) for the VOx/TiO2 samples (Fig. 3) is substantially higher (compared to that of its νMο−O−Mο and νW−O−W counterparts), indicating a higher extent of association/polymerization for the deposited (VOx)n phase compared to the extent of association for the (MoOx)n and (WOx)n deposited phases. Likewise, the progressive blue shift of the νMO mode with increasing loading is attributed to the formation of associated (polymeric) species with a domain size that increases with increasing coverage [26–28]. The prevalence of associated/polymeric species in the deposited oxo-V(V) phase of V2O5/TiO2 catalysts is well established at surface densities exceeding 2 V/nm2 [28]. The broad band in the 880–940 cm−1 region (Fig. 3) as well as the weaker ∼800 cm−1 feature can be assigned to V–O–V functionalities [28–30]. This can be explained by observing that the intensity of the, e.g., 880–940 cm−1 feature, IV−O−V increases (with increasing surface density, from 1.9 to 4.0 V/nm2) relative to the IVO intensity of the terminal stretching mode and this can only be explained if one contemplates the increase at the extent of incorporation of V atoms in V–O–V bridges with increasing loading. Since there is only one VO site per V, the progressive increase in the number of V–O–V bridges per V can account for the relative increase in IV−O−V. Previously [31], for a very low loaded (0.1 V/nm2) VOx/Al2O3 catalyst a band at ∼910 cm−1 has been assigned to a V–O–Al mode instead of conventionally assigning the band to a V–O–V mode.
One of the governing factors for the observed variations, in the extent of polymerization in the individual catalyst systems is the interfacial speciation of the deposited oxometallic phase right after the equilibration stage of the catalyst preparation by the EDF method. The interfacial speciation is controlled inter allia by the acid–base properties of the support, the pH and the precursor concentration of the impregnation solutions [20,27]. The speciation of oxo-Mo(VI) and oxo-W(VI) species in the precursor solutions used [20, 27] as well as the interfacial speciation of the deposited oxometallic phases after the equilibrium deposition and filtration catalyst preparation steps [20, 27] are suggestive of a strong prevalence of monomeric species for the preparation conditions used (Table 1). The monitoring of the temperature dependent evolution of the molecular structures and configurations by in situ Raman snapshots has provided sound evidence suggesting a prevalence of monomeric MoOx and WOx species after calcination [26,27]. However, one should be rather careful when suggesting a low extent of association (polymerization) of oxometallic units on anatase, based solely on e.g., the low relative intensity of the ∼925 cm−1 Mo–O–Mo band, as compared to the intensity of the 995 cm−1 MoO band. Pertinent concern on the possibility for laser wavelength dependence of the relative intensities of bands due to the deposited species resulted in the discovery that Raman bands due to out-of-plane symmetric stretching vibrations of bridging oxygen units (Mo–O–Mo) appear much stronger with UV excitation compared to the corresponding band intensity when visible laser excitation was used [32].
Finally, it is noteworthy that no bands due to crystalline transition metal oxides (MoO3, WO3, and V2O5) are observed in Figs. 1–3, indicating a good dispersion for the deposited oxometallic phases, achieved by the EDF preparation method.
3.1.2 Spectral response to catalyst exposure to reacting (C2H6(g)/O2(g)) and reducing (C2H6(g)) atmospheres
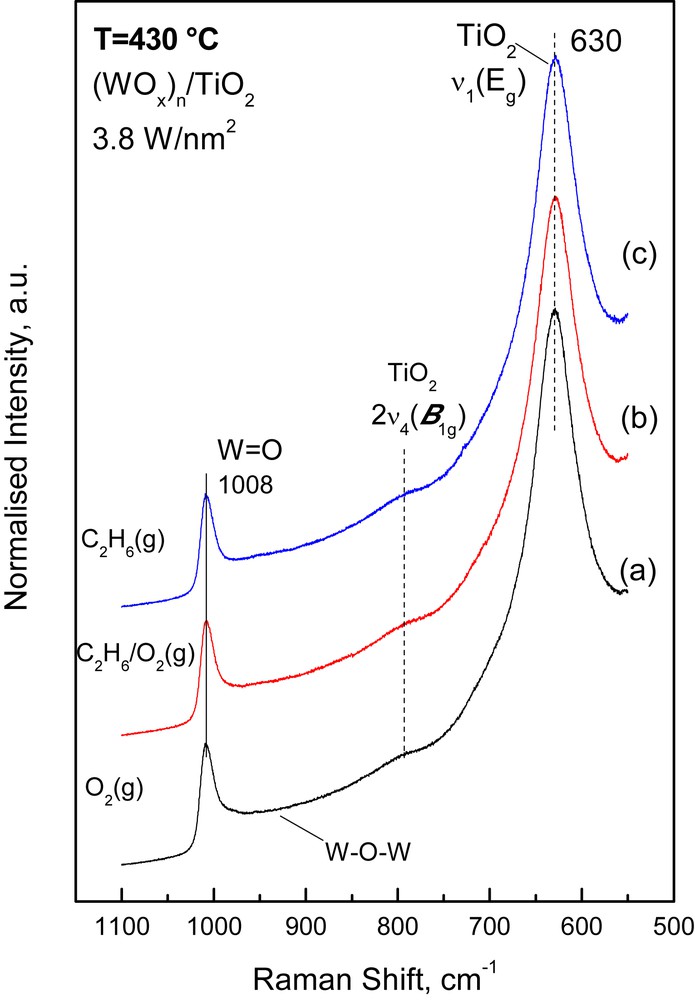
The response of the vibrational properties of the deposited (MOx)n amorphous phase to changes in the gas atmosphere was studied by switching the feed gas from O2(g) to 5.6% C2H6/5.6% O2/He (i.e. ethane ODH reaction conditions) and to 11.2% C2H6/He (i.e. reducing conditions) and obtaining the pertinent in situ Raman spectra at 430 °C under the respective flowing gas mixtures after 1 h of treatment. The protocol used has been outlined in Section 2.2. Figs. 4–6 show (as representative examples) the effect of the reactor atmosphere on the in situ Raman spectra obtained at 430 °C for the high-loaded 3.8 Mo/nm2 (Fig. 4), 3.8 W/nm2 (Fig. 5) and 4.0 V/nm2 (Fig. 6) catalyst samples. Typically, the following effects are observed:
- (a) a decrease in the relative Raman band intensity due to the νMO mode; the decrease follows the sequence (VOx)n >> (MoOx)n > (WOx)n and is furthermore monotonically larger with increasing coverage. A quantitative exploitation of the normalized band intensities and plots of the relative normalized intensity of the νMO mode, IMO, for each sample are compiled in Fig. 7. It is seen that the intensity decrease for IVO is rather abrupt (reaching ∼65%) for the high loaded 4.0VTi sample and is barely ∼6% for the WTi samples.
- (b) a progressive red shift is observed for the band position of the νMO mode upon exposure of the (MoOx)n/TiO2 and (VOx)n/TiO2 samples to C2H6/O2 and C2H6 containing gases; no such effect is observed for the (WOx)n/TiO2 catalysts, for which the effect of the reducing atmosphere is generally low. Table 2 compiles the MO band wavenumbers for the high loaded catalysts measured under O2(g) and C2H6/He(g) conditions as well as the corresponding measure of the red shift observed in the νMO.
In situ normalized Raman spectra obtained for the (MoOx)n/TiO2 catalyst with 3.8 Mo/nm2 at 430 °C under: (a) flowing O2(g); (b) flowing 5.6% C2H6(g)/5.6% O2(g)/He(g); (c) 11.2% C2H6(g)/He. Recording parameters: see caption of Fig. 1.

In situ normalized Raman spectra obtained for the (WOx)n/TiO2 catalyst with 3.8 W/nm2 at 430 °C under: (a) flowing O2(g); (b) flowing 5.6% C2H6(g)/5.6% O2(g)/He(g); (c) 11.2% C2H6(g)/He. Recording parameters: see caption of Fig. 1.
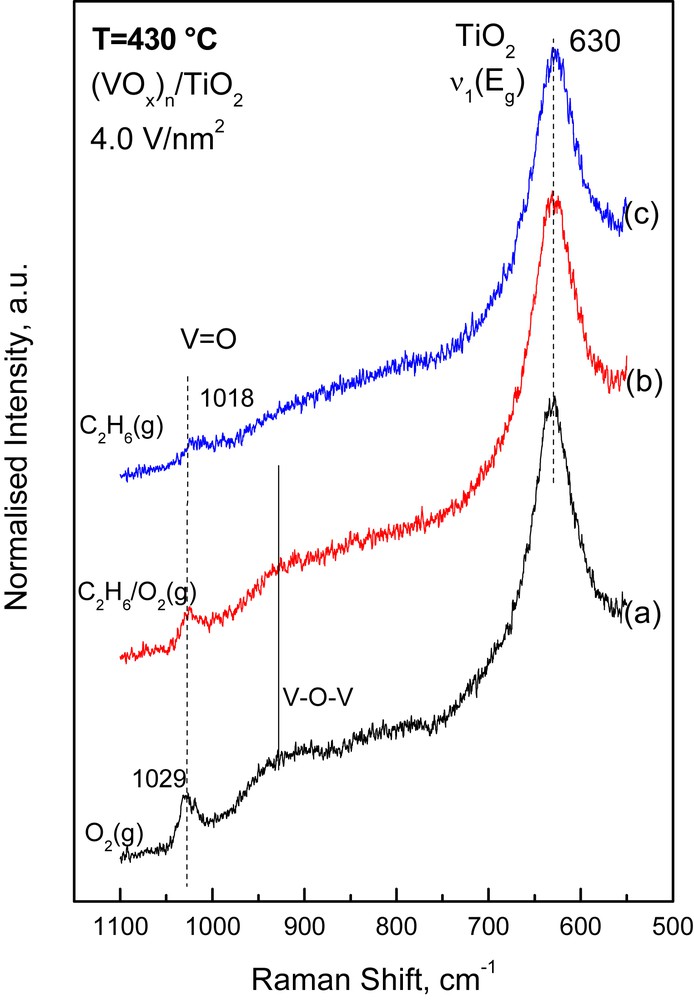
In situ normalized Raman spectra obtained for the (VOx)n/TiO2 catalyst with 4.0 V/nm2 at 430 °C under: (a) flowing O2(g); (b) flowing 5.6% C2H6(g)/5.6% O2(g)/He(g); (c) 11.2% C2H6(g)/He. Recording parameters: see caption of Fig. 1.
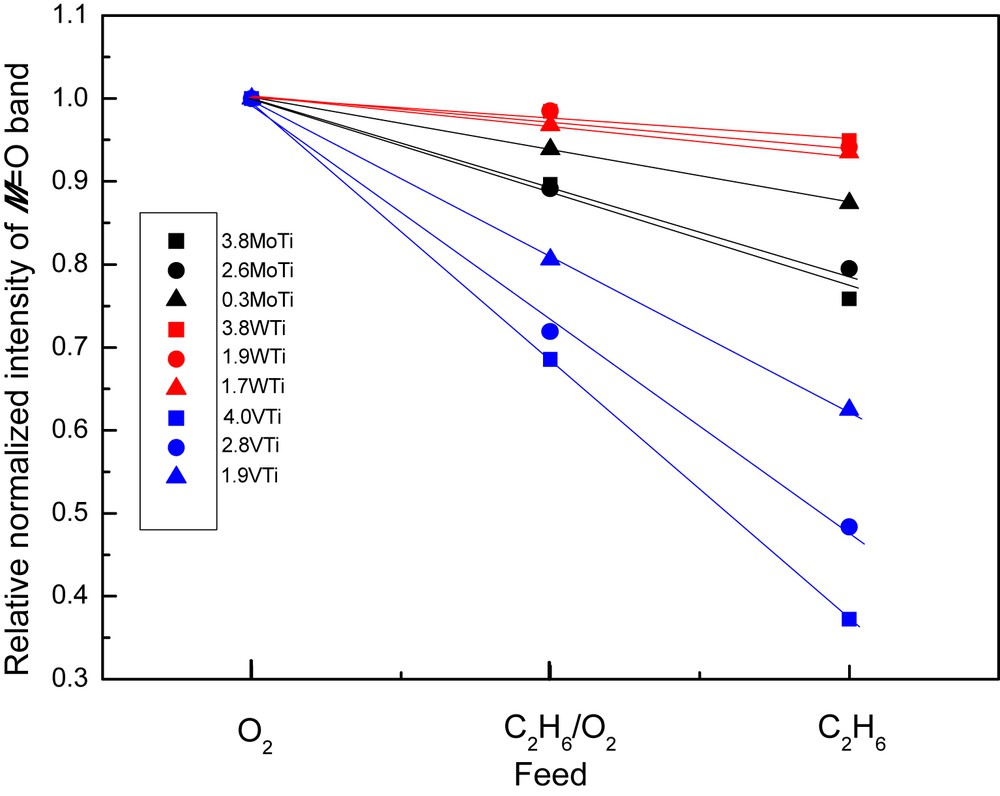
Relative normalized intensity of the MO band (M = Mo, W, and V) under the indicated gas feed conditions (see text) for the catalyst samples as indicated.
Vibrational Raman wavenumbers of terminal MO bond vibrations (M = Mo, W, and V) at 430 °C.
| Catalyst | νMO(cm−1), under O2(g) | νMO(cm−1), under C2H6/He(g) | ΔνMO(cm−1) |
| 0.3MoTi | 992 | 992 | 0 |
| 2.6MoTi | 994 | 993 | 1 |
| 3.8MoTi | 995 | 992 | 3 |
| 1.7WTi | 1005 | 1005 | 0 |
| 1.9WTi | 1005 | 1005 | 0 |
| 3.8WTi | 1008 | 1008 | 0 |
| 1.9VTi | 1026 | 1023 | 3 |
| 2.8VTi | 1028 | 1024 | 4 |
| 4.0VTi | 1029 | 1018 | 11 |
Previously, it has been demonstrated by in situ Raman spectroscopy that under reducing conditions the band due to νMO undergoes an intensity loss along with broadening and a slight red shift and that the extent of these observations is commensurate with the extent of reduction [7–10,28]. Therefore, the data in Fig. 7 and Table 2 are suggestive of an extent of reduction that follows the sequence (VOx)n >> (MoOx)n > (WOx)n and is furthermore increasing with increasing coverage within each series. Evidently, a large extent of reduction is related to a correspondingly high extent of association/polymerization evidenced by the in situ Raman spectra (Figs. 1–6). Therefore, a higher susceptibility to reduction is evidenced for the associated/polymeric species (MOx)n, compared to their isolated counterparts, MOx. Moreover, as will be discussed below (Section 3.2.3), the extent of the reduction susceptibility exhibited by the deposited (MOx)n phase is commensurate with its reactivity during ethane ODH, albeit the reaction pathways (i.e. ethylene selectivity, etc.) are affected by a number of additional parameters. Finally, whereas the intensity decrease of the νMO mode is interpreted to indicate oxygen removal (especially for the νVO case suggesting a partial loss of the vanadyl character for the V(IV) species) and decrease in the abundance of MO sites, the slight red shift and νMO band broadening under reduction conditions indicate a lower bond order for certain MO terminal bonds (also resulting in a wider distribution of bond orders, as evidenced by the band broadening). This can be a result of cascade effects (i.e. events including alterations in local geometry, coordination, etc. that affect through the valence sum rule the bond order of the MO site) that result in weakening of a number of MO bonds under reducing conditions.
3.2 Catalytic measurements
3.2.1 Effect of coverage and residence time on catalytic performance
The dependence of the ethane TOF, expressed as moles C2H6 converted per sec and per mol of M (M = Mo, W, and V) on temperature is shown in Fig. 8. The upper part (Fig. 8(A)) pertains to the (MoOx)n/TiO2 and (WOx)n/TiO2 samples at a residence time, expressed by the ratio W/F, of 1.25 g s cm−3. Notably, ethane conversions were nearly zero for the 0.3MoTi and 2.6MoTi catalysts below 480 °C and the pertinent TOF data are not included in Fig. 8. Ethane TOF's are generally low and exhibit an exponential-like dependence on temperature.
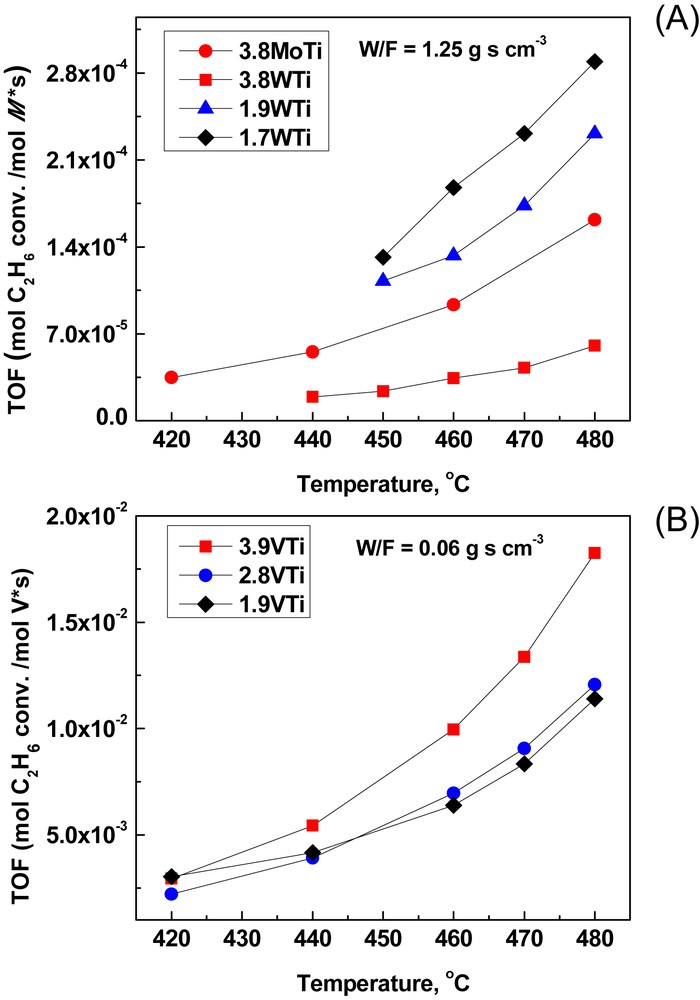
Ethane conversion as a function of temperature for all catalysts: (A) MoTi and WTi catalysts; W/F = 1.25 g s cm−3; (B) VTi catalysts; W/F = 0.06 g s cm−3.
The 3.8WTi sample, although of high coverage (approximate monolayer), exhibits significantly lower reactivity compared to the 1.7WTi and 1.9WTi samples of medium–low coverage. This is due to the inherent reactivity of the exposed TiO2 phase, which for the samples with medium–low coverage (1.7WTi and 1.9WTi) contributes very significantly to the apparent reactivity. Thus, the deposition of (WOx)n species on TiO2 up to the approximate monolayer (e.g., for the 3.8WTi sample) merely consumes(blocks) the reactive carrier sites. Notably, ethane ODH tests over pure TiO2 (at T = 480 °C and W/F = 1.25 g s cm−3) resulted in ∼3% conversion (compared to 1, 1.4 and 0.5% for 1.7WTi, 1.9WTi and 3.8WTi, respectively), albeit at negligible selectivity for C2H4 (∼99% selectivity for CO2). A comparison among the 3.8MoTi and 3.8WTi with coverages approaching the approximate monolayer suggest an almost triple reactivity for the deposited (MoOx)n phase, compared to its (WOx)n counterpart at 480 °C. Meticulous analysis of the structural properties of (MoOx)n/TiO2 and (WOx)n/TiO2 catalysts prepared by the equilibrium–deposition–filtration (EDF) method is reported elsewhere [20,26,27].
Fig. 8(B) displays the ethane TOFs measured over (VOx)n/TiO2 catalysts in the 420–480 °C range which were measured at much lower residence times (corresponding to W/F = 0.06 g s cm−3) due to the much higher reactivity of the deposited vanadia phase. A consistent monotonic increase in the achieved conversions with increasing coverage is observed within the (VOx)n/TiO2 series. The effect of the exposed TiO2 sites is negligible due to the much higher reactivities of the deposited (VOx)n phases.
The discussion on catalyst reactivity is complemented by also addressing the selectivity achieved at various conversion levels by varying the residence time (see below).
3.2.2 Reaction pathways for catalysts with low and high surface coverage
The ODH of ethane over supported transition metal oxide catalysts follows diverse reaction pathways that depend strongly also on the surface coverage of the deposited oxometallic phase. A general scheme for alkane dehydrogenation reaction pathways is shown in Fig. 9. The uncovered TiO2 surface contains lattice and adsorbed oxygen species that constitute total oxidation sites for C2H6 as well as of C2H4 [33]. For shedding light on this mechanistic issue we will examine the catalytic behavior of samples with both low and high coverage.
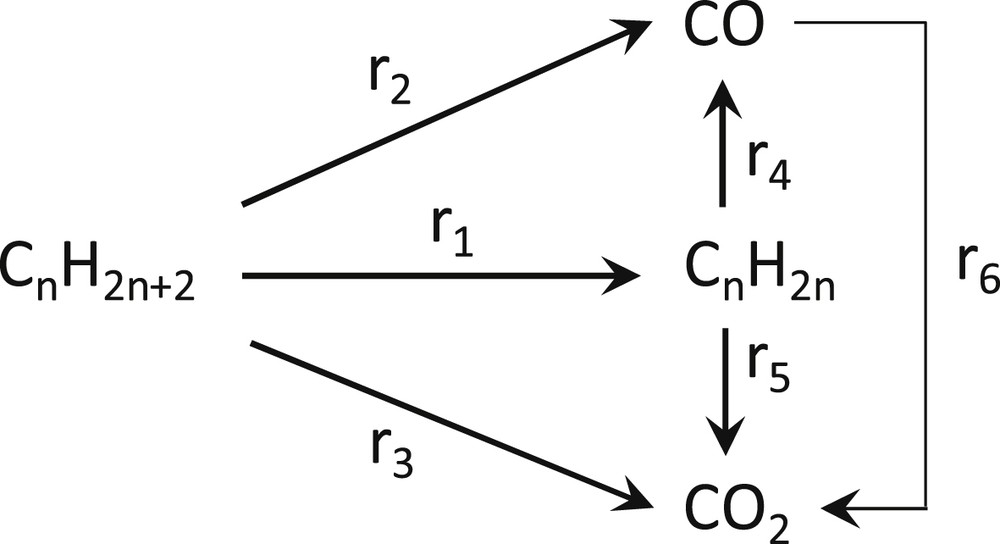
Reaction scheme for alkane dehydrogenation pathways.
For brevity, the discussion will be confined to the (MoOx)n/TiO2 and (VOx)n/TiO2 catalysts; the (WOx)n/TiO2 catalysts exhibit limited reactivity for the ethane ODH reaction.
Fig. 10 shows the selectivities for C2H4, CO and CO2 as well as the C2H6 conversions achieved with increasing residence time, expressed as the W/F ratio in the range of 0.28–1.25 g s cm−3, for the 0.3MoTi and 3.8MoTi samples at 480 °C. Fig. 11 displays the corresponding catalytic behavior of the 1.9VTi and 4.0VTi catalysts as a function of W/F, which is varied between 0.04 and 0.28 g s cm−3. The much lower residence times for the VTi samples were necessary in order to ensure the differential operation of the reactor (conversion lower than 10%). Although conversions exceeded 10% for the 4.0VTi sample at W/F > 0.10 g s cm−3 (Fig. 11(B)), the conversion vs W/F behavior is suggestive of lack of mass transfer limitations at W/F higher than 0.10 g s cm−3.
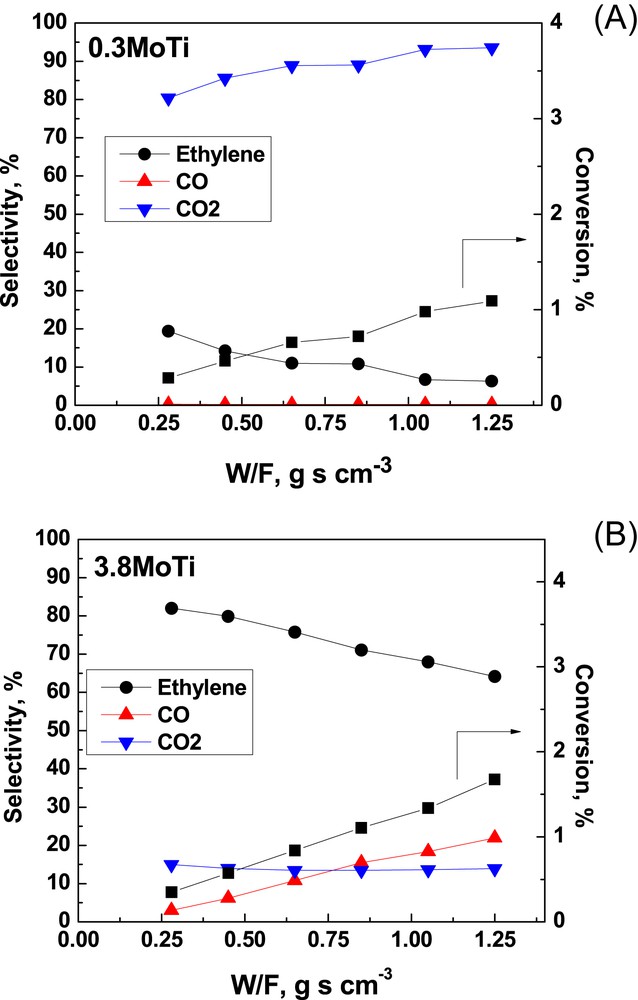
Catalytic data (conversion and selectivities) as a function of W/F for: (A) the 0.3MoTi; (B) the 3.8MoTi catalyst samples. T = 480 °C.
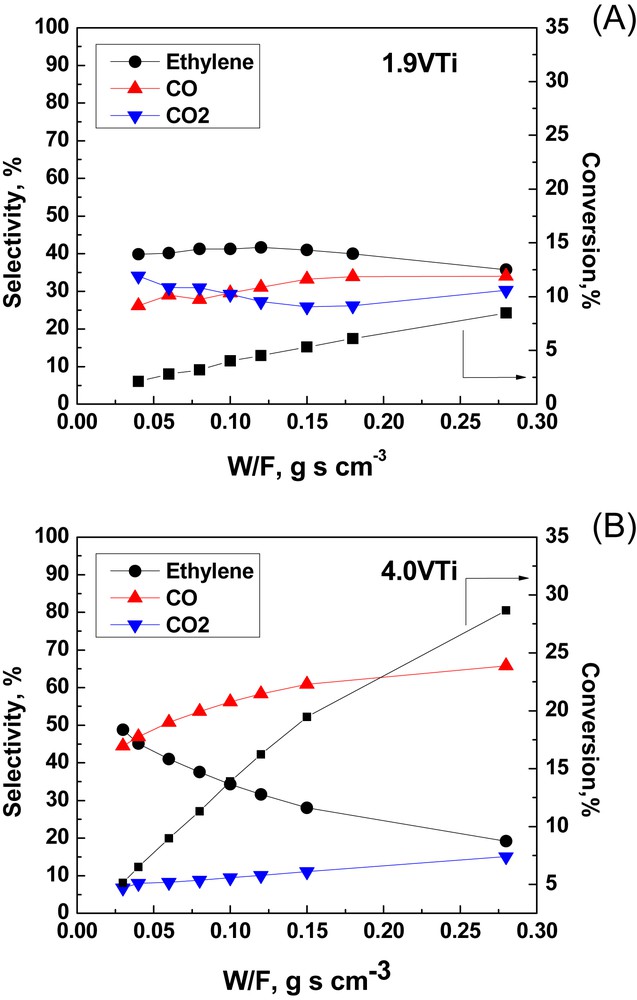
Catalytic data (conversion and selectivities) as a function of W/F for: (A) the 1.9VTi; (B) the 4.0VTi catalyst samples. T = 480 °C
As seen in Fig. 10(A), primary steps of ethane activation for the 0.3 Mo/nm2 catalyst (with a very high area of exposed TiO2) follow mainly route r3 (combustion to CO2) and partly also the selective route r1 (leading to C2H4). Extrapolation of the CO2 and C2H4 selectivity plots to W/F = 0 points to ∼70% and ∼30% initial selectivities for CO2 and C2H4. Significantly, uncovered titania support contributes to the reactivity through the plethora of active lattice oxygen as well as adsorbed oxygen sites favoring an easy activation of ethane that, however, leads to CO2 formation following combustion routes [33]. With increasing residence time the increases at the expense of through activation of route r5 resulting in total oxidation of part of the C2H4 produced over the exposed titania active sites [33].
The behavior of the 3.8 Mo/nm2 sample, of which the surface is mostly covered by the deposited (MoOx)n phase, is markedly different (Fig. 10)(B). Primary steps appear to follow route r1 over the (MoOx)n sites (leading to C2H4) and (to a much lesser extent) route r3 over the exposed titania sites (leading to CO2); this is evidenced by extrapolating the corresponding selectivity plots to W/F = 0, thereby pointing to initial selectivities of ∼85%, ∼15% and 0% for C2H4, CO2 and CO, respectively. The molybdena saturation capacity on TiO2, determined by Raman spectroscopy, is ∼5 Mo/nm2 [10,34,35]. Therefore, the partial activation of route r3 for the 3.8 Mo/nm2 sample is ascribed to the partial occurrence of exposed active oxygens of the carrier lattice [33]. Whereas the CO2 selectivity remains stable at a ∼15% level, a partial activation of route r4 (through which C2H4 is converted to CO over the plethora of (MoOx)n sites) takes place with increasing W/F. The general behavior of decreasing C2H4 selectivity with increasing conversion conforms to established trends for alkane ODH over supported transition metal oxide catalysts [7–9,12,36–42].
The behavior of the 1.9VTi sample with 1.9 V/nm2 is quite unique (Fig. 11(A)). Primary steps of ethane activation seemingly follow route r1 over (VOx)n sites leading to C2H4 and route r3 over the exposed titania sites leading to CO2. Additionally, substantial amounts of CO are produced over (VOx)n sites (presumably through the r1 → r4 sequence). For a residence time corresponding to W/F = 0.06 g s cm−3 the selectivity values for C2H4, CO and CO2 are 40%, 29% and 31%. Notably, the monolayer capacity for the dispersion of (VOx)n on TiO2(anatase) is ∼7–8 V/nm2 [28]. Thus, a large proportion of the surface offers exposed active oxygen sites of the anatase that through route r3 result in a substantial production of CO2. Although appears to decline at the benefit of for high W/F values (as expected) the overall stability of vs W/F is not completely understood.
A high reactivity with an initial selectivity for C2H4 exceeding 60% is evidenced for the 4.0VTi catalyst, albeit with a selectivity for CO that increases markedly at the expense of C2H4 selectivity with increasing conversion, suggesting that an initial activation of the selective route r1 over (VOx)n sites is followed by route r4 (leading to CO) at increasing residence times. A significant part of the carrier remains exposed for the 4.0VTi sample (the monolayer capacity is ∼7–8 V/nm2), thereby justifying the partial activation of route r3 resulting in CO2 through total oxidation of C2H6. The observed slight increase of at increasing residence times is ascribed to total oxidation of some of the extant C2H4 over exposed titania sites through route r5.
From the above discussion, it turns out that despite the attempted tailoring of the deposited (MOx)n (M = Mo, W, and V) species on titania by means of the EDF method, the synthesized catalysts exhibit mutatis mutandis a similar behavior to the corresponding supported transition metal oxides prepared by conventional methods (e.g., wet impregnation) and tested for ODH reactions of light alkanes [7–10,17]. Indicatively, for W/F = 0.28 g s cm−3, (MoOx)n/TiO2 catalysts with a surface density of 3.8 Mo/nm2 prepared by EDF(present work) and wet impregnation [10] exhibit ethane TOF values of 1.5 × 10⁻⁴ and 3.0 × 10⁻⁴ per mole of Mo and per sec. Comparative data pertaining to (VOx)n/TiO2 catalysts with 4.0 V/nm2 prepared by EDF (present work) and wet impregnation [7] exhibit for W/F = 0.06 g s cm−3 alkane TOF values of 1.8 × 10⁻² and 1.3 × 10⁻² per mole of V and per sec. Thus, although (as shown above) primary reaction paths of ODH of light alkanes over supported transition metal oxides follow highly selective routes, the respective products (ethylene and propene) are often converted to combustion products (CO and CO2) through secondary reaction paths. Such non-selective pathways are commonly activated at high conversions or low GHSV [7–9,17].
3.2.3 Apparent turnover rates and apparent activation energies
Comparative reactivity assessments among catalysts can be made by comparing the apparent turnover frequencies, TOF, expressed per M site (i.e. moles of C2H6 converted per sec and per M atom). The apparent TOF incorporates and reflects the site reactivity as well as aspects related to site availability/accessibility. The eventual inherent reactivity of the exposed carrier surface is also unavoidably reflected by the apparent TOF. The comparative picture is complemented by the pertinent selectivities (see previous sub-section) as well as by the apparent activation energies, determined by the corresponding Arrhenius-type plots (ln TOF vs 1/T).
Fig. 12 shows the Arrhenius-type plots of ln TOF vs 1/T for all catalysts studied up to 480 °C and the pertinent apparent activation energies, determined from the slopes of the plots shown in Fig. 12 (corresponding to −Ea/R), are compiled in Table 3. A consistent monotonic increase of Ea is found with increasing coverage of the carrier surface from the deposited (MOx)n oxometallic phase. This behavior implies a progressively more difficult activation of ethane with increasing surface density (M/nm2). However, the apparent ease of activation at low coverages is to be ascribed to the active oxygen atoms of the exposed carrier lattice (leading to non-selective pathways, as discussed above) and not to the deposited (MOx)n phase. Conversely, the progressive increase in the surface density of the (MOx)n deposited species activates selective reaction pathways. Evidently, the possibility for the mobile intermediate ethoxy species to “burn out” on exposed support non-selective active center is diminished with increasing coverage.
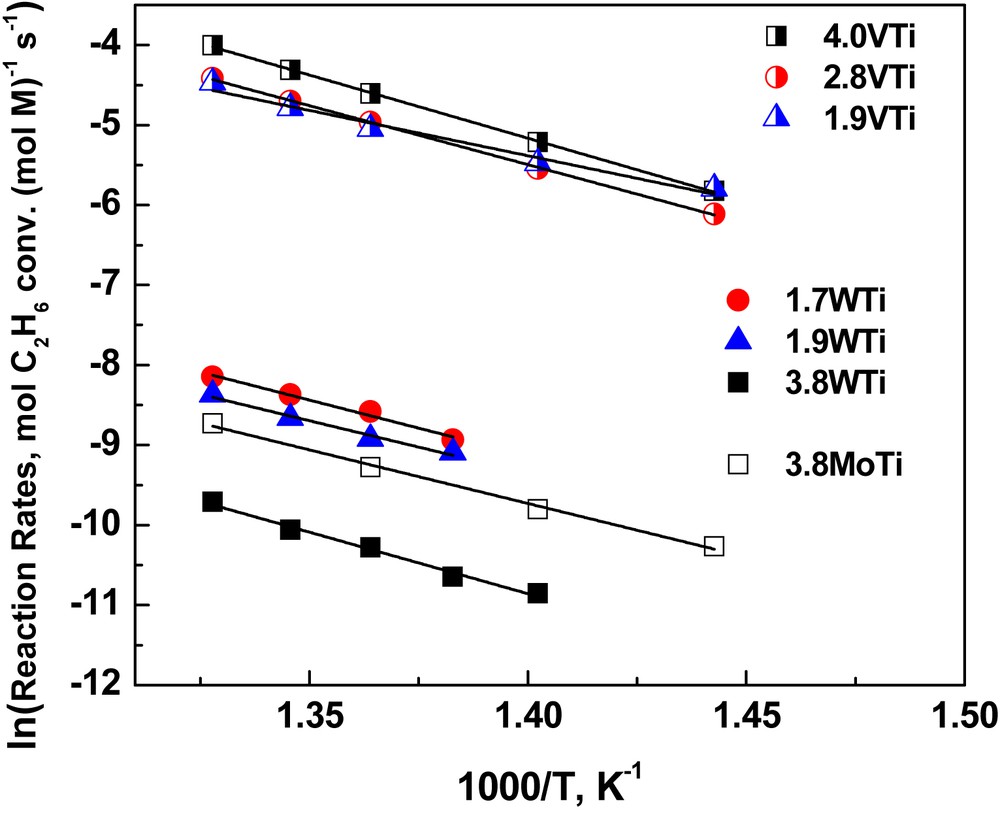
Arrhenius-type plots of ln TOF vs 1/T pertaining to ethane consumption for the catalysts studied.
Apparent activation energies (Ea) of ethane conversion for the studied catalysts (kJ mol−1).
| Catalyst | 3.8MoTi | 1.7WTi | 1.9WTi | 3.8WTi | 1.9VTi | 2.8VTi | 4.0VTi |
| Ea (std. error) | 106.2 (2.6) | 109.6 (9.8) | 116.5 (9.8) | 127.8 (7.0) | 94.1 (8.2) | 122.5 (2.8) | 131.3 (1.3) |
Moreover, it is seen that the catalyst reactivity apparently tracks the reducibility of the metal center evidenced by the in situ Raman spectra (Section 3.1, Fig. 7) with the relationship between reducibility and electron transfer being of critical nature; the higher the density of states susceptible to electron acceptance, the higher the reducibility of a substance. The increased activity with increasing coverage (above 2.8 V/nm2) for the (VOx)n/TiO2 series can be well understood under this viewing angle. With progressive increase in the extent of deposition, in parallel with the structural and configurational evolution, changes also occur in the electronic structure of the complexes. The V atoms within the (VOx)n phase are linked to the surface (V–O–Ti anchors) and to each other through V–O–V bridges and with increasing extent of association more intermediate range interactions between V centers take place. As a result, the electron levels form bands and the density of states increases [43], thereby affecting the charge accommodation by the V center. Therefore, whereas the translational, rotational and vibrational partition functions contributing to the pre-exponential factor (reflecting the degrees of freedom and the structural properties of the deposited amorphous phase at intermediate and high coverage) can be considered as mutatis mutandis stable, it remains to the electronic partition function of the pre-exponential factor (as directly relevant to the density of electronic states) to account for the observed increase in the inherent activity of the deposited phase at high coverage. The corresponding effect cannot be revealed for the (WOx)n/TiO2 series, of which the deposited oxo-tungsten phase exhibits very low reducibility (Fig. 7) and limited reactivity that is thereby masked by the reactivity of the exposed carrier sites.
4 Conclusions
The molecular structural properties of the deposited oxometallic phase in (MoOx)n/TiO2, (WOx)n/TiO2 and (VOx)n/TiO2 catalysts prepared by the EDF (equilibrium–deposition–filtration) method were studied by in situ Raman spectroscopy under oxidizing (O2), reaction (C2H6/O2/He) and reducing (C2H6/He) conditions. A well-expected increase in the extent of association is evidenced with increasing coverage, following the sequence (VOx)n >> (MoOx)n > (WOx)n. The response of the in situ Raman spectra under reaction and reducing conditions reflects (through intensity lowering and band position red shift for the νMO mode) the extent of reducibility exhibited by the different catalysts; both the intensity decrease and the red shift of the νMO mode follow the sequence (VOx)n >> (MoOx)n > (WOx)n and are furthermore much more pronounced with increasing coverage within each catalyst series. Reaction pathways follow selective routes at high coverages, albeit the selectivity is partly controlled also by the achieved conversion, with secondary routes to CO activated at high residence times. The apparent activation energies (determined from differential activity data) increase with increasing coverage, revealing an ease of activation at low coverage where the exposed carrier is involved by favoring non-selective pathways. Preferences to selective reaction pathways with increasing coverage occur concurrently with increased susceptibility to reduction (evidenced by the in situ Raman spectra) and are accounted for by changes in the charge accommodation by the metal center that affect the pre-exponential factor through the corresponding electronic partition function.
Acknowledgment
George D. Panagiotou is thanked for assisting the catalyst preparation. Financial support was provided by the Research Committee of the University of Patras (C. Caratheodory program C.583). The article is dedicated to Professor Edmond Payen, one of the luminaries in scientific research at the interface of spectroscopy and catalysis.