

1 Introduction
Recycling wastewater from textile industries is one of the options to meet the demand for clean water sources. Among the conventional physical and chemical methods used to dispose of the water pollutants, coagulation/flocculation [1,2] and coagulation/carbon adsorption [3] are used. Advanced oxidation processes are innovative water treatment technologies based on the in situ generation of highly reactive radical species (mainly OH) for mineralization of refractory organic compounds [4]. Among the advanced oxidation processes, heterogeneous photocatalysis using semiconductor photocatalysts has demonstrated its efficiency in degrading a large number of ambiguous refractory organics into CO2 and H2O or into readily biodegradable compounds [5]. When a photon of the appropriate energy (hν) is absorbed by a semiconductor, it promotes an electron from the valence band (VB) to conduction band (CB), generating an electron–hole pair (e−, h+) and leaving a hole (h+) in the VB (Eq. 1). The electron–hole pairs can recombine immediately (less than 1 ns) [6] (Eq. 2), but some of them can also migrate to the surface of the catalyst and react separately with other species adsorbed on the surface such as H2O, OH−, O2, and dyes molecules (R). The holes at the semiconductor VB can oxidize adsorbed water or hydroxyl ions to form highly reactive hydroxyl radicals (Eqs. 3 and 4). On the other hand, the generated electrons at the CB can react with adsorbed oxygen molecules to produce OH radicals via a succession of reactions (Eqs. 5–8). These formed hydroxyl radicals have a strong ability to degrade organic dyes such as methyl orange (MO) (Eq. 9). Furthermore, a direct oxidation of organic dyes can occur by reaction with holes (Eq. 10). These reactions are expressed by the following equations [7–14]:
| (1) |
| (2) |
| (3) |
| (4) |
| (5) |
| (6) |
| (7) |
| H2O2 + e− → OH + OH− | (8) |
| (9) |
| (10) |
Various metal oxide semiconductors, such as TiO2, ZnO, CdS, WO3, and so forth, were used as photocatalysts [16–19]. ZnO has attracted particular attention because of its interesting physical and chemical properties (nontoxicity; thermal stability; wide band gap, Ebg ≈ 3.37 eV; and so forth) [4,20–22]. It is well known that the photocatalytic activity is influenced by a wide variety of factors such as specific surface area, adsorption affinity and capacity for organic contaminants, electron–hole recombination processes in the bulk and on the surface of the catalyst, intensity and spectral distribution of the illuminating light [23,24], morphology, intrinsic solid state defects, pH solution [25], the presence of electron acceptors [26], and so forth. ZnO nanopowders in the form of various morphologies and size [13,14,20–22,27] have been synthesized using different methods as sol–gel [13,21–26], hydrothermal [28], microwave-assisted hydrothermal [15,29], spray pyrolysis [30], chemical vapor deposition [31], thermal deposition [14], or chemical precipitation [13]. Among these methods, sol–gel and precipitation are the most widely used because of their simplicity and reproducibility. In addition, they are low cost processes to manufacture high purity of nanoparticles with good control over the shape and size of particles, even at low temperatures [13,21]. On the other hand, although the preparation of ZnO particles from various precursors, depending on the preparation method chosen, has been extensively investigated [13–15,20–22,27–29], none of these studies dealt with the effect of the ZnO precursor's nature on the structural, textural, morphological, optical, and photocatalytic properties of ZnO particles by using the same preparation method. It has been found that the morphology and size of the photocatalyst particles play an important role in the photocatalytic efficiencies of ZnO particles [13–15,20–22,27–29,32,33]. Wang et al. [22] prepared ZnO powders, with various size scales, by using thermal evaporation and chemical deposition methods, and examined them as photocatalysts for degradation of MO in aqueous solution. Their results indicated that the preparation method was the decisive factor rather than the size and morphology. Saravanan et al. [13] in their comparative study on photocatalytic activity of ZnO nanoparticles showed that the spherical shaped ZnO samples exhibited higher MO photocatalytic degradation efficiency compared with the spindle and rod shaped samples. Zhu et al. [15] observed that 9 h are necessary to degrade completely MO in the presence of ZnO rod-assembled microspheres. Other researchers [27] reported that the photodegradation efficiencies of MO depended significantly on the different morphologies of ZnO synthesized by the two-step hydrothermal method. They demonstrated that sheet-like ZnO structures were more efficient than flower-like and sphere-like ZnO structures. The present study reports the influence of (1) the preparation method (sol–gel and precipitation) using one precursor (zinc acetate dihydrate), and (2) the nature of ZnO precursor (zinc acetate dihydrate, zinc nitrate hexahydrate, and zinc sulfate heptahydrate) using one preparation method (precipitation) on the structural, textural, morphological, optical, and photocatalytic properties of the synthesized ZnO particles. The synthesized ZnO particles were calcined at 500 °C for 3 h before evaluating their photocatalytic properties using MO as a molecule probe in aqueous solution under UV-A radiation.
2 Materials and methods
The reagents Zn(CH3COO)2·2H2O (Scharlau, 99%), Zn(NO3)2·6H2O (Acros Organics, 98%), ZnSO4·7H2O (Fisher Scientific International Company, 99.5%), NaOH (Fisher Scientific International Company, 98%), ethanol (Carol Erba Reagent, 99.9%), and MO (Fisher Scientific International Company, 99%) used in this study were of analytic grade. All chemicals were used as received without further purifications.
2.1 Catalyst preparation
2.1.1 Sol–gel method
Zinc acetate (10 g) was refluxed in ethanol (300 mL) at 80 °C and stirred for 10 h until a clear solution is obtained. A solution of sodium hydroxide (0.225 mol/L) was then added at 0 °C into the clear solution while stirring until a white gel was formed, which was preserved at room temperature for 3 days. The obtained nanopowder (ZnO(Ac, SG)) was then ground and calcined at 500 °C for 3 h.
2.1.2 Precipitation method
2.1.2.1 From zinc acetate dihydrate
Zinc acetate (26.9 g) was dissolved in double distilled water (100 mL) under constant stirring. Twenty milliliters of a molar solution of sodium hydroxide was then added (7 mL/min) into the mixture at 50 °C. After that, the solution was continuously stirred for 1 h at 50 °C. The obtained precipitate was filtered, washed three times using distilled water, and dried overnight in an oven at 100 °C. The obtained material (ZnO(Ac, Pr)) was then ground and calcined at 500 °C for 3 h.
2.1.2.2 From zinc nitrate hexahydrate
In this method, 245 mL of a molar solution of sodium hydroxide was heated until 70 °C under constant stirring and then mixed with 245 mL of an aqueous solution of Zn(NO3)2·6H2O (0.5 M). After that, the mixture was continuously stirred for 2 h at 70 °C, and the obtained precipitate was filtered and washed three times using distilled water. The recovered powder (ZnO(Nit, Pr)) was dried overnight in an oven at 65 °C and calcined at 500 °C for 3 h.
2.1.2.3 From zinc sulfate heptahydrate
In this method, 35.32 g of zinc sulfate heptahydrate was dissolved in 25 mL of double distilled water while constant stirring at room temperature, and the a solution of sodium hydroxide was added (7 mL/min) until the pH of the solution reached 7. The white precipitate formed was then filtered and washed three times using distilled water. The resulting powder (ZnO(Sul, Pr)) was dried overnight in an oven at 100 °C and calcined at 500 °C for 3 h.
2.2 Characterization
The crystal structures of the prepared ZnO powders were characterized by powder X-ray diffraction (XRD) using an X'PERT MPD_PRO diffractometer with Cu Kα radiation. The accelerating and the applied current were 45 kV and 40 mA, respectively. The determination of the crystalline phases was carried out by applying the Bragg law, where λ = 1.5406 Å. Fourier transform infrared (FTIR) spectra were obtained as KBr pellets in the 400–4000 cm−1 wavenumber range using FTIR spectrometer (type JASCO 4100). The size and morphology of the prepared samples were determined by transmission electron microscopy (TEM) imaging (Microscope Tecnai 12 from FEI Company). The Brunauer-Emmett-Teller (BET) surface areas of different ZnO powders were obtained at −196 °C using an ASAP 2010 instrument. Diffuse reflectance UV–vis spectra were recorded using a JASCO V-570 spectrophotometer equipped with a Labsphere DRA-CA-30I integration sphere using BaSO4 as a standard.
2.3 Photoactivity experiments
The photocatalytic degradation of MO was carried out at room temperature (28 ± 2 °C) in a Pyrex cylindrical beaker (100 mL) surrounded by a water jacket. Before photocatalytic run was started, an aqueous suspension (50 mL) containing 0.5 × 10⁻⁵ to 9 × 10⁻⁵ M of MO and 25 mg of ZnO was stirred in the dark for 30 min to establish adsorption/desorption equilibrium between MO molecules and ZnO particles. Thereafter, the suspension was irradiated with a low pressure lamp (40 W; model Vilber, VL-340.BL) emitting UV radiation with 365 nm and positioned above the reactor. The distance between the top of the reactor and the UV lamp was 12 cm, and the light intensity was about 413 μW/cm2. At given intervals of irradiation times, the suspension was filtered through a 0.45 μm Millipore filter and analyzed by measuring the absorbance at its maximum absorbance wavelength of 460 nm using a UV–vis spectrophotometer (Shimadzu 2100 spectrophotometer). The photocatalytic degradation efficiency was calculated using the following expression:
To verify that the photodegradation of MO occurs only in the presence of UV light and photocatalyst, black experiment was conducted by placing a solution of MO under UV irradiation in the absence of catalysts for 5 h. The analysis of the solution showed that about 2% of the MO was photolyzed. So, it can be concluded that the simultaneous presence of photocatalyst and UV light is necessary in the photocatalytic reaction.
3 Results and discussion
3.1 Characterization
3.1.1 FTIR spectra
The FTIR spectra for ZnO(Ac, SG), ZnO(Ac, Pr), ZnO(Nit, Pr), and ZnO(Sul, Pr) were recorded at room temperature and are presented in Fig. 1. The broad absorption band around 3420 cm−1 and the band at 1650 cm−1 appearing in all of the spectra can be assigned to the stretching and bending vibrations, respectively, of H2O adsorbed on the surface of the solid [34]. The absorption bands at 425 and 510 cm−1 appearing in all of the spectra can be linked to infrared active modes of the würtzite ZnO [35]. The bands observed at about 1425 and 1545 cm−1 on the spectra (a) and (b) are attributed to C–O and CO stretching vibrations in acetate groups [36]. The band appearing on spectrum (c) at 1389 cm−1 corresponds probably to the presence of residual nitrate (NO3−) [37]. The spectrum (d) recorded for ZnO(Sul, Pr) shows two SO42− characteristic peaks at 1120 and 630 cm−1 [38].
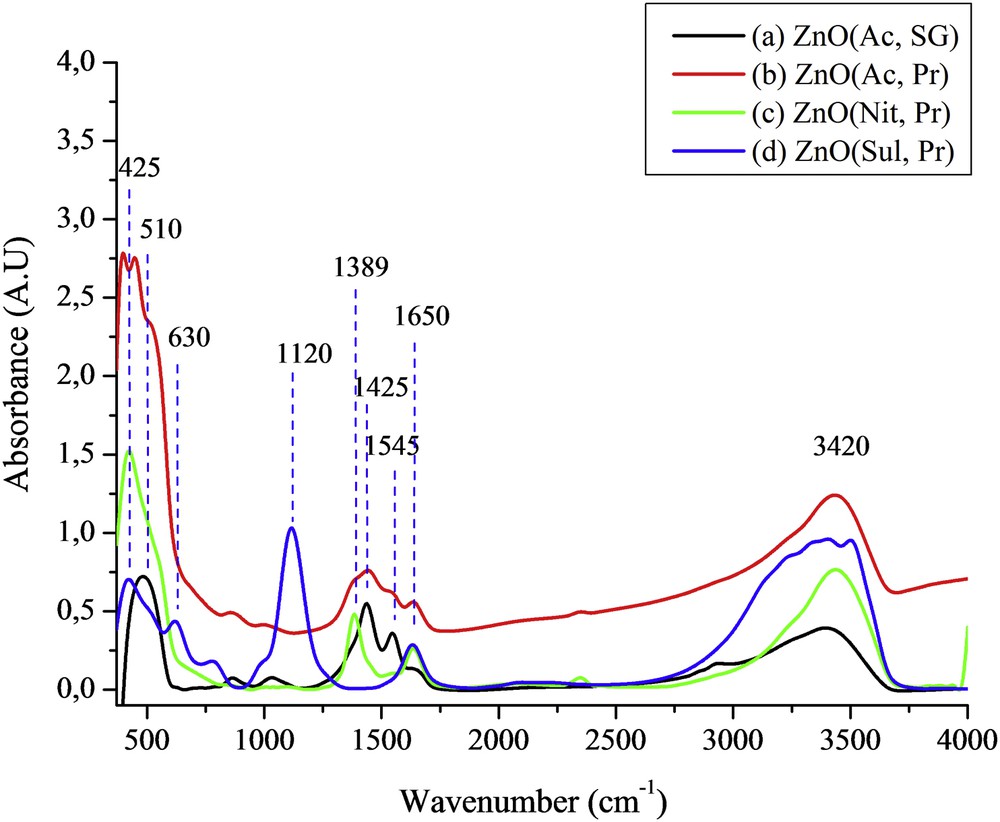
FTIR spectra of (a) ZnO(Ac, SG), (b) ZnO(Ac, Pr), (c) ZnO(Nit, Pr), and (d) ZnO(Sul, Pr).
3.1.2 X-ray diffraction
The XRD patterns of the prepared ZnO(Ac, SG), ZnO(Ac, Pr), ZnO(Nit, Pr), and ZnO(Sul, Pr) samples are shown in Fig. 2. All of the diffraction peaks recorded for ZnO(Ac, SG), ZnO(Ac, Pr), and ZnO(Nit, Pr) were indexed as the hexagonal würtzite ZnO (ICSD reference code 01-075-0576). However, for ZnO(Sul, Pr) prepared from zinc sulfate as a precursor, XRD analysis (spectrum d, Fig. 2) revealed the coexistence of two crystalline phases: hexagonal würtzite ZnO (denoted W, ICSD reference code 01-075-0576) and traces of Zn3O(SO4)2 (denoted S, ICSD reference code 00-032-1475). Therefore, XRD analysis indicates that the zinc sulfate used as a precursor was not completely converted into ZnO during the precipitation process, and a part of it was transformed into a zinc oxysulfate during the step of calcination at 500 °C.
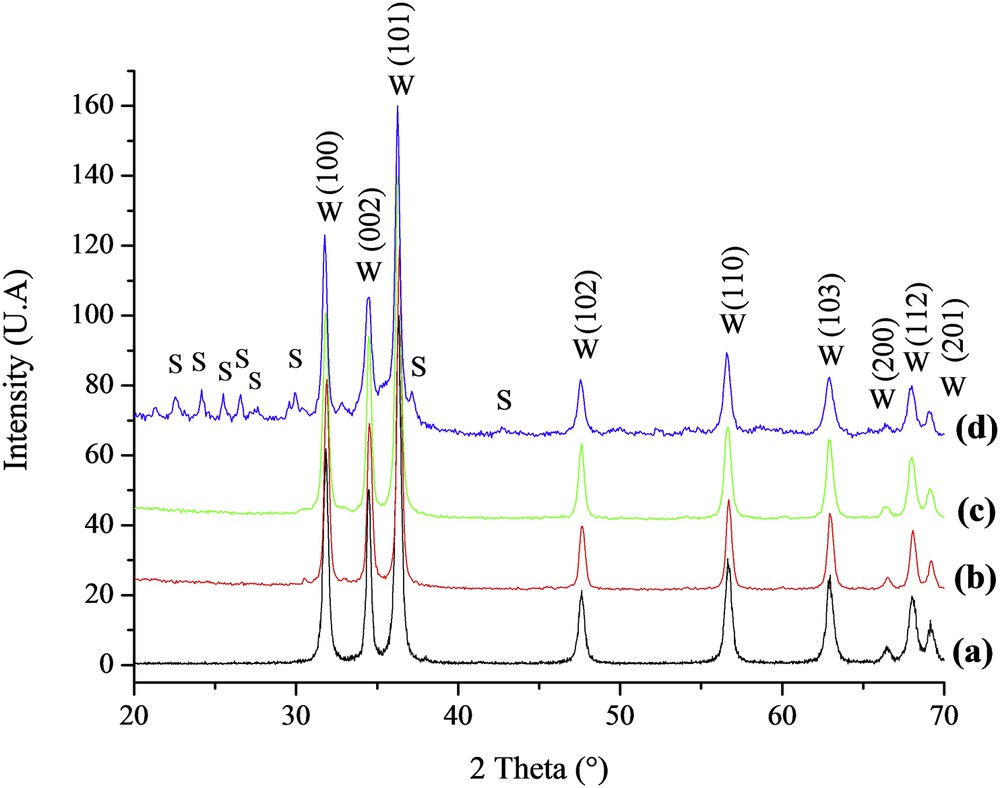
X-ray spectra of (a) ZnO(Ac, SG), (b) ZnO(Ac, Pr), (c) ZnO(Nit, Pr), and (d) ZnO(Sul, Pr). W: hexagonal würtzite ZnO; S: Zn3O(SO4)2 phase.
3.1.3 Transmission electron microscopy
Fig. 3 depicts the TEM images of the synthesized ZnO particles using different precursors. Fig. 3a shows that the ZnO sample prepared from zinc acetate using the sol–gel method is composed of irregular shaped nanoparticles with rounded edges. The average nanoparticle size determined by TEM observation is about 30–40 nm. Fig. 3b shows that the ZnO prepared from zinc acetate using the precipitation method is constituted of nanoparticles having a uniform and hexagonal shape. The average size of the nanoparticles is about 40 nm. Fig. 3c relative to ZnO prepared from Zn(NO3)2·6H2O using the precipitation method shows the formation of a well-defined microrod-like structures that have a hexagonal shape confirming the XRD results. The ZnO grains look like flower clusters. The typical length, estimated by TEM observations, may reach 800 nm, and the average size is about 100 nm. For ZnO obtained by the precipitation method using zinc sulfate as a precursor, the TEM observations (Fig. 3d) show that the nanoparticles are highly agglomerated and are in the form of clusters with an average size greater than 100 nm. These results show that the preparation method (sol–gel or precipitation) influences slightly the shape but does not have a significant effect on the size of the ZnO nanoparticles. However, the nature of the precursor used influences strongly both the shape and the size of the ZnO particles.

TEM micrographs of (a) ZnO(Ac, SG), (b) ZnO(Ac, Pr), (c) ZnO(Nit, Pr), and (d) ZnO(Sul, Pr).
3.1.4 Surface area
From the results presented in Table 1, it can be seen that neither the preparation method (sol–gel or precipitation) nor the nature of ZnO precursor used in this study affects significantly the BET surface area of the obtained ZnO nanoparticles.
BET surface areas, average sizes estimated by TEM observations, absorption edges, and band gap energies of ZnO samples.
| Material | SBET (m2/g) | Average crystallite size (nm) estimated by TEM observations | Absorption edge (nm) | Band gap energy (eV) |
| ZnO(Ac, SG) | 8.0 | 30–40 | 373 | 3.32 |
| ZnO(Ac, Pr) | 9.1 | About 40 | 375 | 3.31 |
| ZnO(Nit, Pr) | 7.0 | About 100 | 376 | 3.30 |
| ZnO(Sul, Pr) | 6.5 | >100 | 373 | 3.32 |
3.1.5 UV–vis diffuse reflectance
The UV–vis diffuse reflectance spectra of ZnO powders prepared by the sol–gel and precipitation methods using different precursors are shown in Fig. 4. The UV absorption edge wavelengths determined from spectra and the corresponding band gap energies (Ebg) are given in Table 1. The Ebg values were calculated from the equation: Ebg=1240/λ (eV), where λ is the wavelength in nanometers [13].

The UV–vis diffuse reflectance spectra of (a) ZnO(Ac, SG), (b) ZnO(Ac, Pr), (c) ZnO(Nit, Pr), and (d) ZnO(Sul, Pr).
From these results, it is clearly observed that all samples exhibit the absorption edge in the UV region indicating that these materials can absorb UV light irradiation. Also, the calculated Ebg of ZnO powders were about 3.30–3.32 eV, which are slightly lower than reported (3.37 eV) [39]. Therefore, the preparation method (sol–gel or precipitation) and the ZnO precursor used in this study do not affect significantly the band gap energy of the final solid.
3.2 Evaluation of the photocatalytic activity
3.2.1 Comparison of photocatalytic activities of ZnO particles
Fig. 5 shows the curves of MO photocatalytic degradation efficiencies versus irradiation time obtained under similar conditions in the presence of the prepared ZnO materials. These results show that at the same time, the ZnO sample prepared by the sol–gel method (curve a) has better photocatalytic efficiencies than that prepared by the precipitation method (curve b). The final photodegradation percentages of MO obtained after 200 min of irradiation time are 97.1 and 90.8% for ZnO(Ac, SG) and ZnO(Ac, Pr), respectively (Table 2). The difference in MO photodegradation percentage, although it is weak, indicates that the fabrication route influences the photocatalytic efficiency of ZnO nanoparticles, probably because of the creation of specific sites whose abundance depends on the preparation method of ZnO. These results are in agreement with those reported by many authors [22,33,40,41]. For the same preparation method (precipitation), as shown in Fig. 5 and Table 2, the ZnO sample prepared from zinc acetate has the higher photodegradation efficiency (90.8%) compared with the other two samples prepared from zinc nitrate (71.6%) or zinc sulfate (20.9%). It has been reported that the morphology and size of ZnO particles affect the photocatalytic efficiency of ZnO [13,22,33,40,41]. These authors have linked this effect to the exposed crystal faces that are noticeably different depending on the crystalline forms of ZnO particles. As mentioned below in the characterization section, the prepared ZnO samples from the three precursors exhibited a clear difference in the particle size and morphology. Consequently, nanoparticles of ZnO with a uniform and hexagonal shape (average size, 40 nm) are more efficient, in MO photocatalytic degradation, than those having microrod-like structures (length may reach 800 nm and the average size is about 100 nm) or highly agglomerated particles (average size, 100 nm). However, the difference in the particle size and morphology of ZnO cannot alone explain the drastic decline in the observed MO photocatalytic degradation, particularly for ZnO(Sul, Pr). It is more prudent to verify the possible implication of another parameter that contributes to the effect of size and morphology of particles in the abatement of MO photocatalytic degradation. Many studies reported the negative effect of NO3−, SO42−, and other ions on the photocatalytic activity of TiO2 [42–47] or ZnO–SnO2 [48] toward organic molecules. In the present study, FTIR analysis showed the presence of nitrate and sulfate ions for ZnO(Nit, Pr) and ZnO(Sul, Pr), respectively, and XRD analysis indicated the presence of traces of Zn3O(SO4)2 crystalline phase for ZnO(Sul, Pr). It is a plausible reason to suspect that these two ions contribute, more or less, to the decrease in the photodegradation efficiency for ZnO(Nit, Pr) and ZnO(Sul, Pr). To verify this assumption, the effect of NO3− and SO42− ions on the photocatalytic degradation of MO was studied in the presence of ZnO(Ac, Pr). As shown in Fig. 6, the addition of NO3− ions has a little effect on photocatalytic efficiency of ZnO(Ac, Pr), which is in agreement with the literature [43,44,48]. However, the inhibitive effect of SO42− ions on photocatalytic degradation of MO is very noticeable. These results are in agreement with those reported by Zhang et al. [48], which attributed the inhibitive effect of SO42− ions to the competitive adsorption between SO42− and MO at the photocatalyst surface.

The photocatalytic degradation efficiency of methyl orange in the presence of (a) ZnO(Ac, SG), (b) ZnO(Ac, Pr), (c) ZnO(Nit, Pr), and (d) ZnO(Sul, Pr). ZnO dose = 0.5 g/L, C0(MO) = 10−5 mol/L, pH neutral (≈7.8).
Methyl orange photodegradation in the presence of the prepared ZnO materials.
| Material | Photodegradation (%) | k (min−1) | R2 |
| ZnO(Ac, SG) | 97.1 | 0.0198 | 0.9975 |
| ZnO(Ac, Pr) | 90.8 | 0.0151 | 0.9996 |
| ZnO(Nit, Pr) | 71.6 | 0.0063 | 0.9929 |
| ZnO(Sul, Pr) | 20.9 | 0.0017 | 0.9731 |
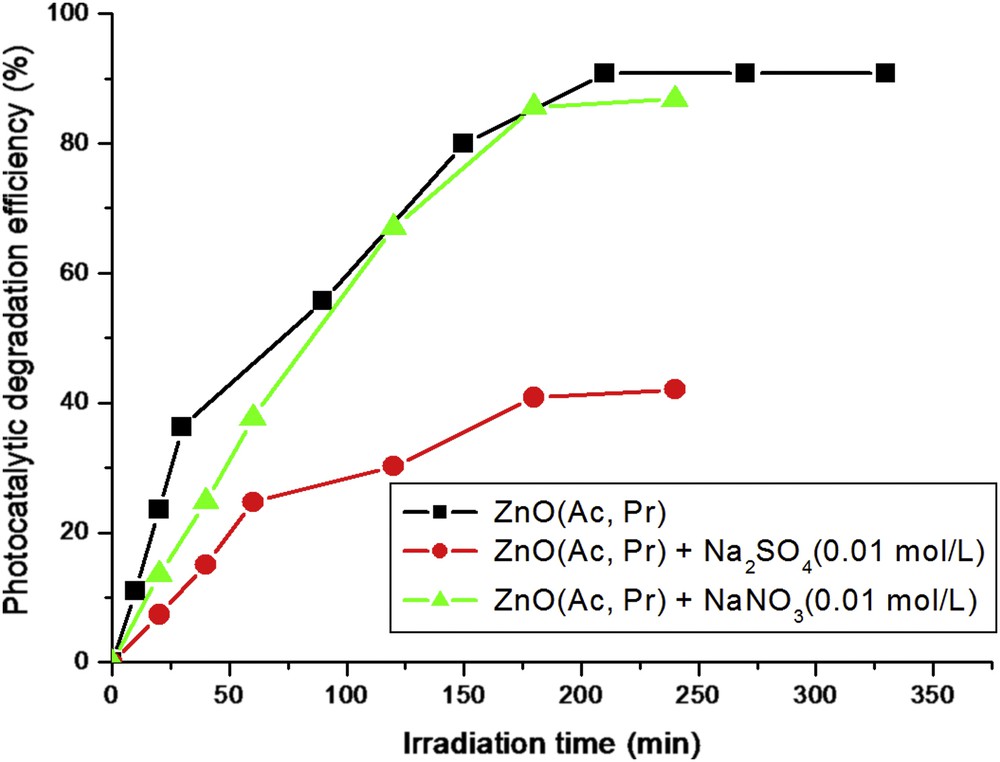
The effect of NO3− and SO42− ions on the photocatalytic degradation of MO in the presence of ZnO(Ac, Pr). ZnO dose = 0.5 g/L, C0(MO) = 10−5 mol/L, pH neutral.
On the other hand, photocatalytic degradation reactions of MO with the prepared ZnO are all the pseudo-first-order reactions during the first 3 h of irradiation in agreement with a generally observed Langmuir–Hinshelwood mechanism [49–52]. In this mechanism, the rate r can be expressed by the following equation:
| (11) |
| (12) |
The values of the apparent rate constants calculated from the slopes of the linear plot of Ln(C0/C) versus irradiation time and the coefficient of determinations are given in Table 2. It is easily seen that the degradation rate of MO in the presence of ZnO(Ac, SG) and UV light is faster than that in the presence of ZnO(Ac, Pr), ZnO(Nit, Pr), and ZnO(Sul, Pr) by 31, 214, and 1065%, respectively. The last solid exhibits the lowest photocatalytic degradation efficiency with the lowest rate.
3.2.2 Effect of initial MO concentration
The effect of initial MO concentration on the photocatalytic degradation efficiency was investigated from 0.5 × 10⁻⁵ to 9 × 10⁻⁵ mol/L. The amount of ZnO was kept constant (0.5 g/L). The evolutions of the photodegradation efficiency and the pseudo-first-order constant values according to the initial MO concentration obtained after 180 min of irradiation time for the ZnO powders synthesized by sol–gel and precipitation methods are shown in Fig. 7. As noticed, the photodegradation efficiency (Fig. 7a) and the apparent rate constant (Fig. 7b) decrease sharply with the initial MO concentration. The negative effect of the initial dye concentration was observed by many authors [20,22] and was attributed to the fact that the more the dye concentration is increased, the more the photons get intercepted before they can reach the photocatalyst particles leading to a decrease in the absorption of the photons by the catalyst. From Fig. 7a,b, ZnO(Ac, SG) seems to be more efficient than ZnO(Ac, Pr), ZnO(Nit, Pr), or ZnO(Sul, Pr), because the degradation efficiency and the apparent constant rate, obtained with the first oxide, decrease when the MO concentration decreases until 3 × 10⁻⁵ mol/L, and then, remain substantially constant, whereas for the latter oxides, they decrease continually with dye concentration, particularly for ZnO(Ac, Pr) and ZnO(Nit, Pr).

Effect of initial dye concentration on (a) the photocatalytic degradation efficiency and (b) the apparent rate constant for ZnO(Ac, SG) and ZnO(Ac, Pr). ZnO dose = 0.5 g/L, pH neutral (≈7.8).
4 Conclusions
The results of different physicochemical characterization techniques obtained in this study demonstrated the strong influence of the preparation methods (sol–gel and precipitation) and the precursors (Zn(CH3COO)2·2H2O, Zn(NO3)2·6H2O, and ZnSO4·7H2O) used as reactant to synthesize ZnO powders on their crystalline structure, size, and morphology. The results of the photocatalytic degradation of MO in the presence of the different synthesized samples and UV light irradiation showed that the use of the sol–gel method produces nanomaterials with enhanced photocatalytic properties compared with the precipitation method. For the same preparation method (precipitation), the sample prepared from zinc acetate showed a higher photodegradation efficiency compared with the other two samples prepared from zinc nitrate or zinc sulfate.
Acknowledgments
The support of Moulay Ismail University in the framework of the research project allocated in 2012 is acknowledged with gratitude.