

1 Introduction
In the 1930s, the term photocatalysis was introduced as a new branch of catalysis [1]. Among photocatalytic applications, the oxidation and the reduction of organic compounds in water have become important and have received considerable attention during the last few years [1,2]. Owing to its excellent catalytic and oxidative properties, titanium dioxide TiO2 has been frequently employed to degrade most kinds of organic pollutants, including detergents, dyes, pesticides, and herbicides under UV-light irradiation in order to transform them in water, carbon dioxide and some simple mineral acids [3–6]. However, titanium dioxide was used also for other catalytic applications [7,8]. Among the three common phases of crystalline TiO2, it is widely known that anatase (band gap = 3.2 eV, absorption ≤ 385 nm) is the most photocatalytically active. Therefore, only a small fraction (∼ 5%) of the solar energy can be utilized in practical application [9,10]. Moreover, a low rate of electron transfer to oxygen and a high rate of recombination between excited electron/hole pairs lead to a low-quantum yield rate and a limited photooxidation rate [11,12]. Modification of TiO2 is thus an active and important field of research. Efforts have been made using chemical or physical methods to enhance the photocatalytic activity of TiO2 through modification with different metal groups such as alkaline metals [13], earth alkaline metals [14], transition metals [15], rare earth metals [16], and noble metals [17], but with varying degree of results.
Transition metal doping has been widely used to extend TiO2's light-absorption in the visible-light region. In particular tungsten (W) was reported as the best one for the photodegradation under visible-light irradiation of 4-nitrophenol, benzoic, methanoic and oxalic acids [18,19], methylene blue (MB) [20], methyl orange (MO) and orange acid (OA7) [21,22]. Various tungsten precursors (H2WO4, W(OEt)5,(NH4)6H2W12O40,WCl6, etc.) and different techniques for doping (impregnation, sol–gel, flame spray synthesis, etc.) were used in these different researches [23,24]. As a result, the different photocatalytic tests and the various experimental conditions used do not allow comparing the obtained results. Moreover, the most prepared W–TiO2 catalysts cited in the literature are of high level of W-doping and relatively weak surface area. Thus, the aim of this research is to prepare, by a simple sol–gel method, a new weakly W-modified TiO2 having a high surface area. It is expected that the new W–TiO2 photocatalyst allows a better visible-light absorption and a higher photocatalytic activity than the prepared pure TiO2 and the Degussa P25. The Congo red (CR) (Scheme 1) was used as a pollutant model for testing the prepared photocatalysts. Several operational parameters were studied, such as W-loading and the heat-treatment temperature of the photocatalysts.
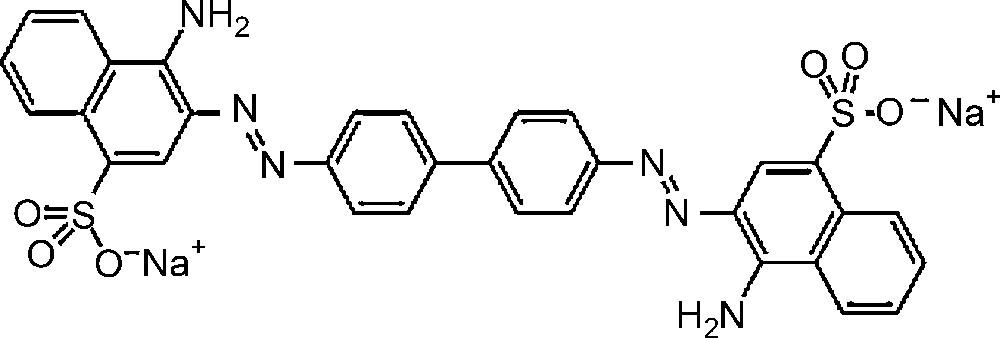
Molecular structure of Congo red dye.
2 Experimental
2.1 Materials
All reagents used were of analytical grade and employed as received. Titanium tetraisopropoxide (TTiP) and tungstic acid H2WO4 were purchased from Aldrich Chemicals. Propanol (C3H7OH) and acetic acid (CH3COOH) were obtained from Merck Chemicals. The azo dye used in the experiments is Congo red.
2.2 Photocatalyst preparation
The W–TiO2 photocatalysts were prepared by the sol–gel method. In a typical procedure, 10 g of titanium tetraisopropoxide (TTiP) was dissolved at room temperature in 20 mL of 2-propanol under stirring for 20 min to prepare solution A. Then, a solution B was prepared by dissolving some amount of tungstic acid in 20 mL of distilled water and 1.4 mL of acetic acid. The amount of tungstic acid added corresponds to W-to-TiO2 molar ratios of 0.5, 1, 2, 3, 6 and 10%. Solution A was subsequently added dropwise to solution B under vigorous stirring, within 40 min. The mixture was aged for 12 h at ambient temperature followed by filtering and washing with distilled water. Samples were then dried at 120 °C overnight and heat-treated for 2 h at different temperatures between 350 °C and 650 °C. The as-prepared photocatalysts were labeled based on tungsten loading: Wx–TiO2, where x is the molar ratio of W.
2.3 Characterization of the photocatalysts
The crystalline phases of the synthesized materials were identified by X-ray diffraction analysis on a D8 Advance Bruker Diffractometer in a θ/2θ mode and using the Kα1 radiation of Cu at 1.5406Å. The pattern was obtained at a scan rate of 0.020°/0.4 s from 10° to 90°. The average crystalline size of the catalysts was determined according to the Scherrer equation using the full width at half maximum data after correcting for the instrumental broadening with the normal assumption of spherical crystallites. The crystalline structure was identified using the database of the Joint Committee on Powder Diffraction Standards (JCPDS). The morphology of the photocatalysts was examined by means of a scanning electron microscope (SEM, JEOL XL 30 FEG) working at 10–20 kV and a transmission electron microscope (TEM, Topcon 002B) working at 200 kV and a point-to-point resolution of 0.17 nm. The Brunauer, Emmett and Teller (BET) surface areas of the materials were determined using nitrogen adsorption–desorption at 77 K on an ASAP2010 Micrometrics. In order to determine the light-absorption range of powder samples, diffuse reflectance spectroscopy (DRS) was used in the UV–visible region, with the help of an integrated sphere. These measurements have been carried out on a Varian CARY 100 SCAN UV/vis, between 200 and 800 nm and using BaSO4 as a reference. The energy band gap (Eg) of the powders was calculated using the differential reflectance method. The elemental analysis was evaluated using X-ray fluorescence (XRF).
2.4 Photocatalytic degradation experiments
The photocatalytic experiments were carried out in a cylindrical Pyrex glass reactor containing 0.5 g of catalyst and 1 L of aqueous solutions of Congo red (CR). The suspension was kept for 90 min in the dark and was continuously stirred using a magnetic stirrer to equilibrate the adsorption–desorption processes. Then, the mixture was illuminated with a 250-W visible-light halogen lamp immersed within the photoreactor, which was surrounded by a circulating water jacket (Pyrex) to cool the reaction solution. An aliquot of the aqueous suspension was periodically sampled from the reactor and centrifuged. The absorbance of the clear solution was measured using a Shimadzu 3150 UV–vis spectrophotometer operating at 498 nm to deduce the CR concentration as a function of irradiation time. The total organic carbon (TOC) concentration was determined using a TOC-analyzer (Shimadzu 5000A) equipped with an auto-sampler (ASI-5000).
3 Results and discussion
3.1 Catalyst characterization
3.1.1 XRD analysis
XRD was used to investigate the changes of phase structure of TiO2 samples prepared with different W-loadings. The XRD patterns of the samples are shown in Fig. 1. It can be clearly seen that the diffraction peaks of all the W–TiO2 samples present the structure of the anatase phase of TiO2 [JCPDS No. 21-1272]. No other phases like rutile and brookite are detected. It is also noteworthy that the doped samples exhibit the typical structure of TiO2 crystal without any detectable WO3 peaks when the W content is less than 2%. Typical peaks attributed to WO3 appear for samples containing molar ratios of W more or equal to 2%. In particular, a new strong diffraction peak that corresponds to the orthorhombic WO3 (JCPDS No. 20-1324) emerges at about 2θ = 24° when the W amount reached 2 mol %, which gives evidence of WO3 formation in the composite, undergoing the WO3 transformation from monoclinic to orthorhombic phase [16]. The W6+ cations may have been located into either the interstitial or the substitutional sites of the TiO2 crystal structure [20]. A careful examination of the W–TiO2 XRD patterns shows that the (101) diffraction peak of TiO2 shifts slightly toward lower 2θ values when W-loading increases. According to Bragg's law, dhkl = λ/(2 sinθ), the distance between (hkl) crystal planes is inversely proportional to the diffraction angle θ. Because the ionic radius of W6+ (41 pm) is smaller than that of Ti4+ (53 pm), the decrease in the dhkl value should result in an increase in 2θ values. Consequently, the observed shift of (101) diffraction peak toward lower angles is not due to the smaller dhkl resulting from W6+ substitution for Ti4+. The average size of TiO2 crystallites was estimated based on the broadening of anatase (101) peak at 2θ = 25.4° using the Scherrer equation: d = k λ/β·cosθ, where k is the shape factor of particles equal to 0.89, β is the peak width at half maximum (in radians) and λ is the X-ray wavelength (0.15418 nm). It was found that the particle size of all the W–TiO2 samples ranges from 8.6 to 13.6 nm. The formation of nanoparticles is expected to promote the photocatalytic activity of the photocatalysts.

X-ray diffraction patterns of (a) pure TiO2 and (b–f) tungsten (W)x–TiO2; x = 0.5, 2, 3, 6 and 10, respectively (heat-treatment temperature = 450 °C).
3.1.2 Fluorescence X analysis
As shown in Table 1, X-ray fluorescence (XRF) analysis revealed that the real molar fraction of W found in the W–TiO2 samples was virtually identical or very close to the nominal value only if TiO2 was weakly loaded with tungsten. The metal loading procedure was carried out in very acidic media. Under these experimental conditions, W is present under the form of anionic species. Interactions between oxoanions of W and TiO2 could be responsible for the quantitative presence of W in TiO2, which was also confirmed in the samples containing large amounts of metal.
The W content in the W–TiO2 photocatalysts measured by XRF.
| W content (mol%) (calculated) | W content (mol%) (measured) |
| 0.5 | 0.50 |
| 1 | 1.06 |
| 2 | 2.12 |
| 3 | 2.98 |
| 6 | 4.78 |
| 10 | 8.79 |
3.1.3 TEM and SEM analysis of samples
Fig. 2a and b presents the typical SEM images of the prepared pure TiO2 and W0.5–TiO2 heat-treated at 450 °C, respectively. Both samples appear homogeneous and formed of a large number of aggregated small particles. A high-resolution TEM image (Fig. 2c) of W0.5–TiO2 show nanoparticles of an average size of 10 nm, in agreement with XRD results calculated by the Scherer equation. Lattice images of the nanoparticles (Fig. 2d) are clearly observed, indicating that these nanoparticles have high cristallinity. The parallel fringe spacing of the nanoparticles is estimated to be 0.35 nm, corresponding to (101) plane of anatase phase of TiO2, which indicates that this plane is the preferential growth direction of the nanocrystallites.
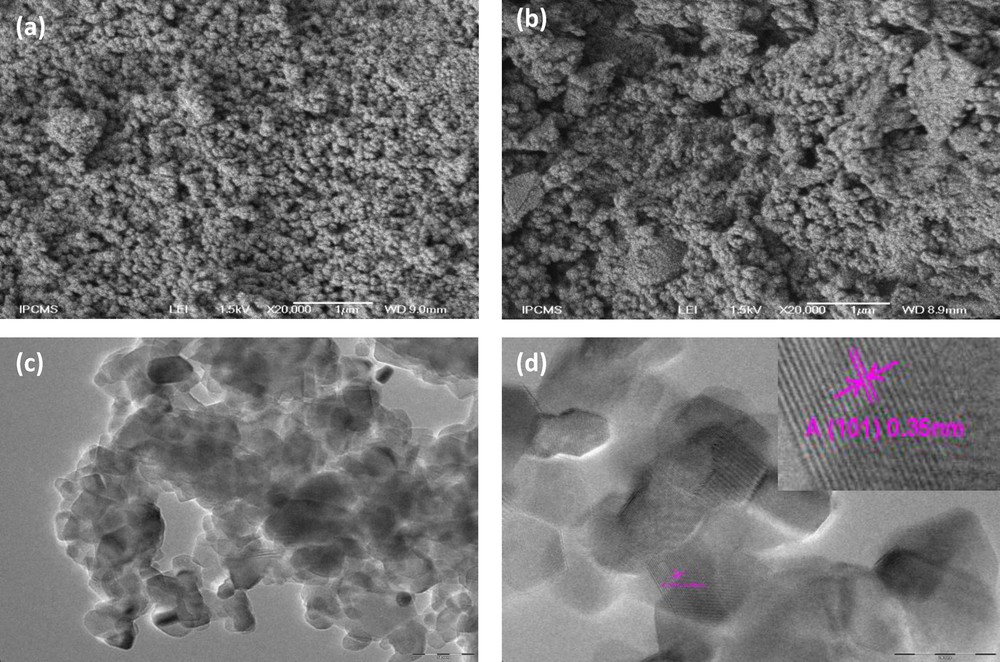
Scanning electron microscopy images of (a) pure TiO2, (b) tungsten (W)0.5–TiO2 and high-resolution transmission electron microscopy images of W0.5–TiO2 photocatalysts heat-treated at 450 °C (c and d).
3.1.4 Surface area measurement
The obtained results show that the preparation method used in this research has allowed high surface areas for the prepared pure TiO2 and the weakly W-doped TiO2. Particularly, the BET surface area of the pure TiO2 is 196.5 m2g−1, while that of W0.5–TiO2 is 216.5 m2g−1 (Table 2). Further increase in W-loading leads to a decrease in the BET surface area W–TiO2 samples. As a result, W10–TiO2 has the lowest surface area of 68.6 m2g−1. This tendency implies that introducing W into TiO2 structure could curb the growth of the catalyst crystallites. On the other hand, it was found that the heat-treatment temperature affects strongly the surface area of the W–TiO2 samples (Table 3). Thus, the surface area of W0.5–TiO2 decreases considerably from 216.5 to 136 m2g−1, when its heat-treatment temperature increases from 350 °C to 650 °C. This finding is possibly due to particle aggregation that may occur at high temperatures.
BET surface areas of undoped and doped W–TiO2 calcined at 350 °C.
| W to TiO2 molar ratio | BET surface (m2g−1) |
| 0 | 196.5 |
| 0.5 | 216.5 |
| 1 | 182.5 |
| 2 | 175.3 |
| 3 | 107.4 |
| 6 | 90.2 |
| 10 | 68.7 |
BET surface areas of W0.5–TiO2 for different temperatures of calcination.
| T (°C) | BET surface (m2g−1) |
| 350 | 216.5 |
| 450 | 173.0 |
| 550 | 158.0 |
| 650 | 136.0 |
3.1.5 Absorption spectrum of TiO2
Fig. 3a shows UV–vis-diffuse reflectance spectra (UV–vis-DRS) of W–TiO2 samples. It should be noted that the W-doped TiO2 samples possess a remarkable redshift absorbance threshold as compared to prepared TiO2. The edge of the characteristic absorption band for W0.5–TiO2 could be distinguished at wavelength λ = 428 nm, extrapolating the steep slope in the curve to the largest wavelength side. The obvious redshift of the absorption band edge to the visible range can be attributed to the success of W species doped on the TiO2, and is found owing to the narrow band gap of WO3. Thus the W–TiO2 particles should have a good photocatalytic potential, not only under UV-light, but also under visible-light. These results are in concordance with those obtained by other researchers [25]. However, further increases in W-doping decrease photon absorption. Modification with W can shift the absorption spectrum of TiO2 into the visible region, but this is very much dependent on the method of synthesis, the nature of the precursors and the heat-treatment temperature of the photocatlyst samples [26]. Fig. 2b shows the UV–vis–DRS spectra of W0.5–TiO2 and pure TiO2 that are heat-treated at different temperatures. It is found that W0.5–TiO2 annealed at 350 °C has the strongest absorption in the visible region, with the highest band edge at around 430 nm. An increase of heat-treatment temperature to 450 °C decreases the light-absorption intensity of W0.5–TiO2 in both the UV and visible region, and leads to a blue shift in comparison to prepared pure TiO2 heated at the same temperature.
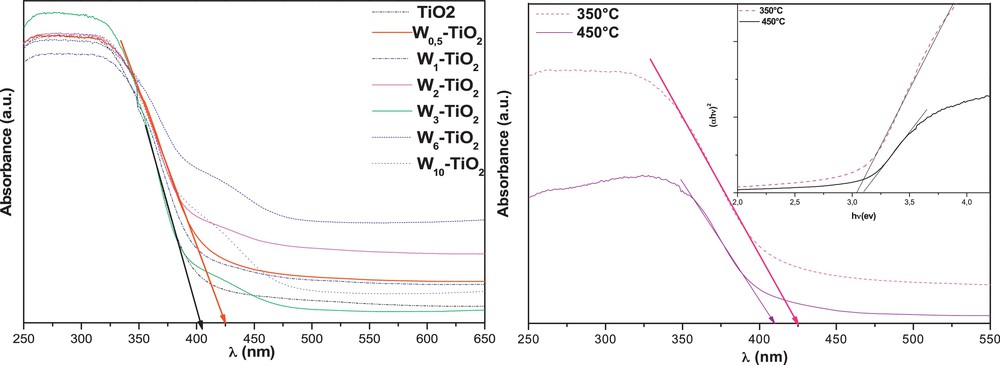
UV–vis-diffuse reflectance spectroscopy (DRS) patterns of pure TiO2 and the various doped tungsten (W)–TiO2 (a) and (b) the effect of calcinations temperature on the DRS spectra of W0.5–TiO2.
3.2 Photodegradation studies
3.2.1 Effect of tungsten loading
To evaluate the photocatalytic activity of the W-doped TiO2 and find out the optimum amount of W-doping, a series of degradation experiments of Congo red dye were carried out by using different W–TiO2 photocatalysts from 0.5 to 10 mol %. Degussa P25 and prepared pure TiO2, were used as reference samples for comparison purpose. Compared to P25, the W–TiO2 photocatalysts present two different kinetics types in the photodegradation reaction of CR, as shown on Fig. 4. Thus, weakly doped TiO2 (less than 2%) are faster than P25, whereas highly doped TiO2 (more than 3%) are slower than P25. The relatively high amount of W seems to be detrimental to the photodegradation reaction of CR by promoting the charge pair recombination. On the contrary, W-doping may promote the charge pair separation efficiently for W–TiO2 photocatalysts when the W-loading is weak. As a consequence, an appropriate W content is required to optimize its role of photogenerated electron trapping. As shown in Fig. 4, the optimum amount is about 0.5 mol% and W0.5–TiO2 photocatalyst achieves the highest photodegradation efficiency of CR. The enhanced photocatalytic efficiency of weakly W-doped TiO2 may also be attributed to the presence of a surface acidity on photocatalysts as reported by Keller et al. [27] for WO3/TiO2 catalysts. This was confirmed here by measurement of the point of zero charge (PZC) of W0.5–TiO2, which is found equal to 5.6, a lower value than that of the prepared pure TiO2 (PZC = 6.3). This decrease in the PZC value is obviously due to the presence of WO3 having an acidic surface (PZC = 0.4).
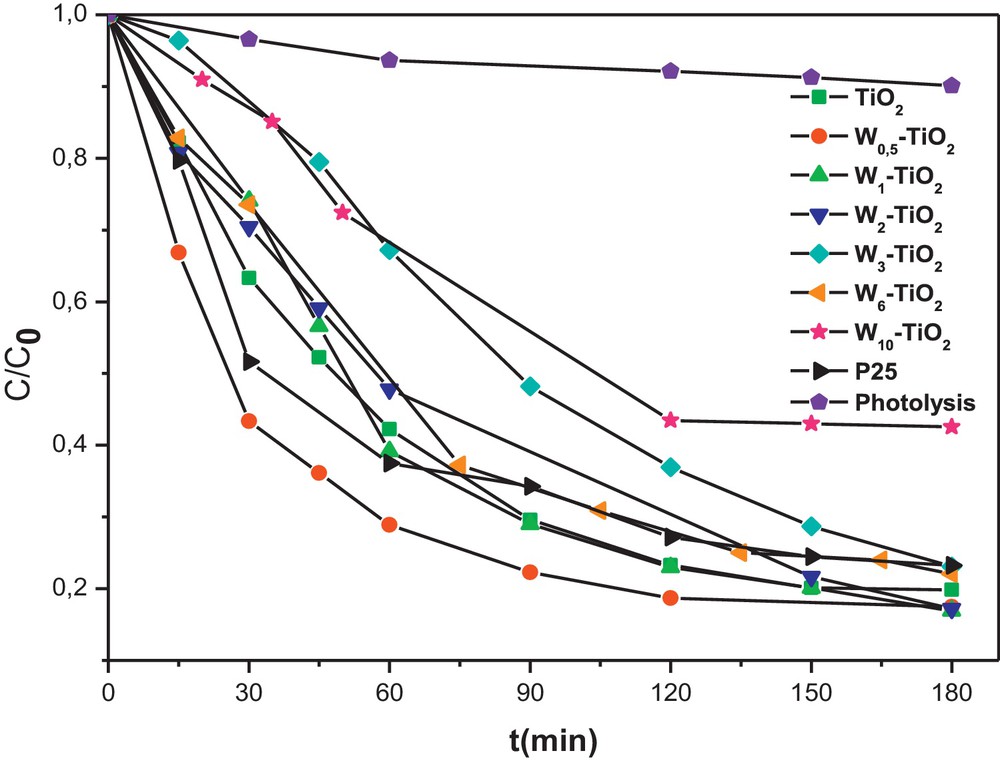
Effect of the doped amount of tungsten (W) in TiO2 on Congo red (CR) photodegradation kinetics (initial concentration of CR = 50 mg L−1 and of photocatalyst = 0.5 g L−1).
3.2.2 Effect of heat-treatment temperature
It is found that heat-treatment temperature affects greatly the photocatalytic activity of the W0.5–TiO2 photocatalyst. In fact, the increase of the heat-treatment temperature from 350 °C to 650 °C leads to a clear decrease in the efficiency of the photocatalysts, as shown in Fig. 5. That main reason may be attributed to the influence of the surface area, the crystallization and the aggregation of the photocatalyst crystallites. The more perfect crystallization, obviously obtained at high temperature, would lead generally to a better photocatalytic activity. But this tendency is thwarted by the aggregation of crystallites leading to the low surface area of W0.5–TiO2 obtained when the calcination temperature is high (650 °C).
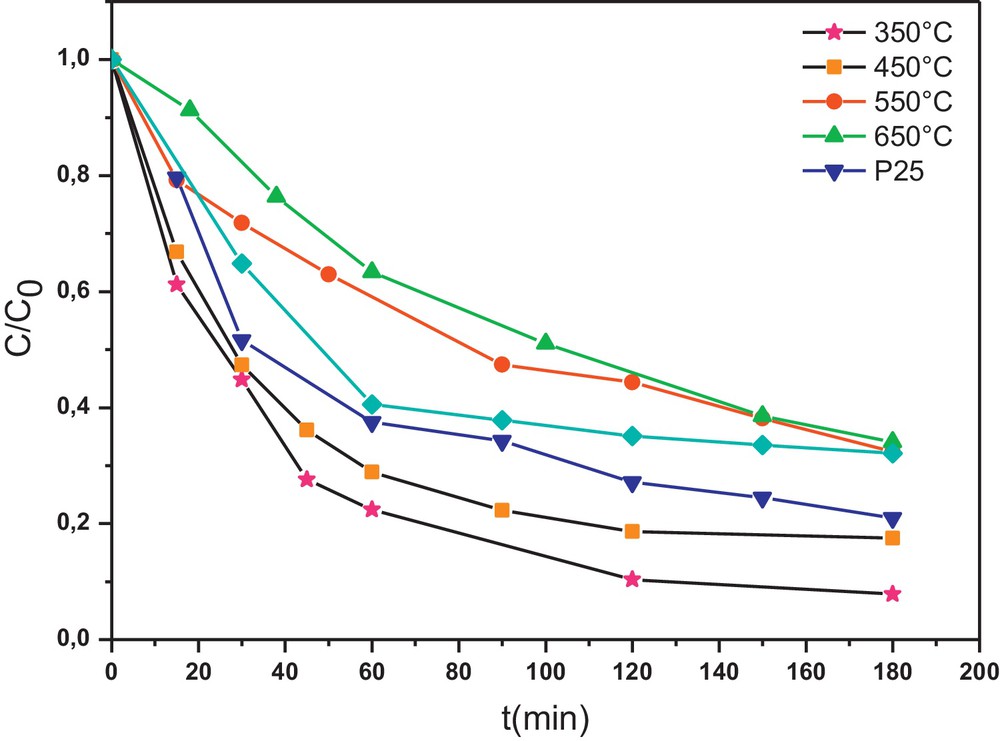
Effect of the heat-treatment temperature of tungsten (W)0.5–TiO2 on the Congo red (CR) photodegradation kinetics (initial concentration of the CR = 50 mg L−1 and photocatalyst = 0.5 g L−1).
The photocatalytic degradation reaction of CR can be assumed to follow a pseudo-first-order expression: v = −dC/dt = k·C which can be integrated to give the following form: lnC0/C = k·t, where C0 and C are respectively the initial concentration and the concentration at time of CR, and k is the apparent reaction rate constant. This kinetic model has been successfully applied to the results and straight lines are obtained (not shown here) when plotting lnC0/C = f(t). According to the above kinetic model, the values of the rate constant k are calculated and summarized in Table 4. It is found that the reaction rate constant depends strongly on the calcination temperature. The W0.5–TiO2 calcined at 350 °C shows the highest kinetic rate constant of 2.62 min−1, more than twice that of the Degussa P25 (k = 1.25 min−1).
The rate constants k of the photodegradation reaction of CR in the presence of W0.5–TiO2, calcined at different temperatures, and that of Degussa P25.
| T(°C) | kapp(min−1) |
| 350 | 0.02621 |
| 450 | 0.01884 |
| 550 | 0.00672 |
| 650 | 0.00629 |
| P25 | 0.0125 |
3.2.3 Kinetics of TOC disappearance
In order to evaluate the complete degradation of organic compounds using the photocatalysis process, total organic carbon (TOC) concentration as a function of irradiation time is usually analyzed. The stoichiometric eq. (1) of the CR oxidation is:
| (1) |
Significant mineralization of CR was observed in the present work, and the TOC removal of CR was up to 60% after 180 min of visible-light irradiation when W0.5–TiO2 photocatalyst is used. Only 35% of TOC removal is measured when using the prepared non-doped TiO2 (Fig. 6). This indicates that the photodegradation with the as-prepared W0.5–TiO2 photocatalysts was not only bleaching or decomposition, but also a deep oxidation process to mineralize organic molecules into inorganic ones such as SO42−, NO3−, CO2, and H2O.
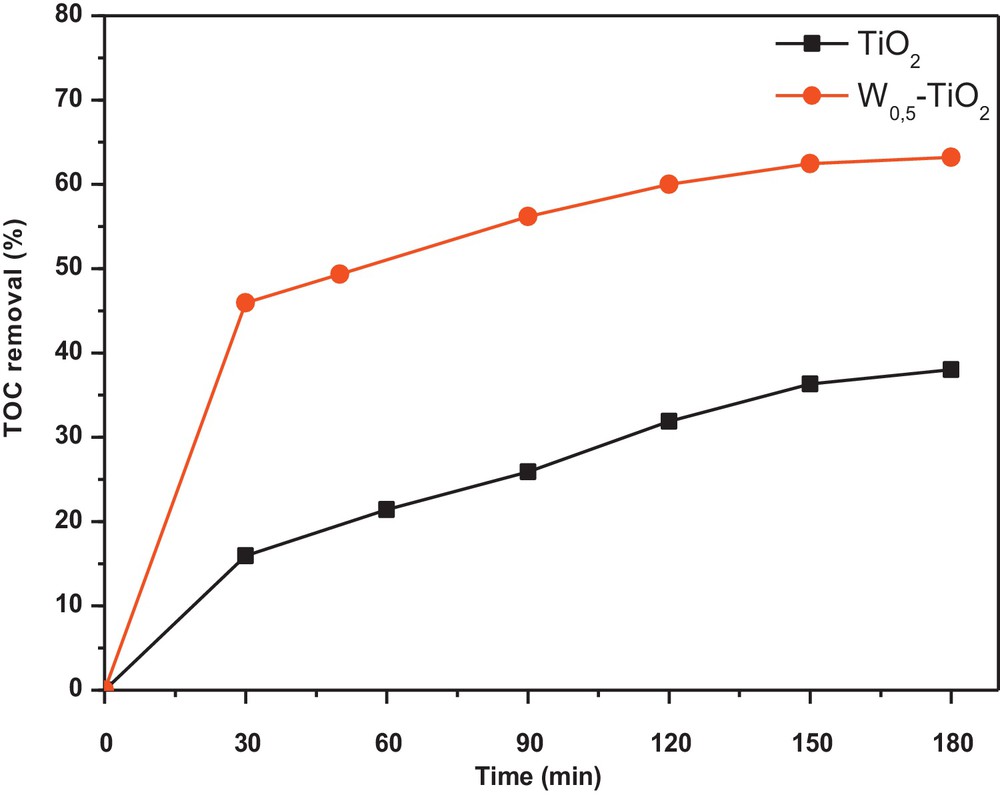
Total organic carbon removal kinetics for pure TiO2 and tungsten (W)0.5–TiO2 heat-treated at 350 °C.
4 Conclusion
In this research, we have successfully prepared new W-doped TiO2 photocatalysts by the sol-gel method. The new photocatalysts are characterized by different techniques such as DRS, BET, DRX, SEM, and TEM. Photocatalytic experiments are carried out using the CR as a photodegradable organic compound. The obtained results show the formation of nanoparticles with an average size of 10 nm. Moreover, the new photocatalysts have high surface areas and their light-absorption extends to the visible region, which can promote their photocatalytic activity. Thus it is found that W0.5–TiO2 calcined at 350 °C for 2 h shows higher activity for the degradation of CR under visible-light irradiation compared to the non-doped or to the highly W-doped TiO2.