

1 Introduction
Phosphorus containing species are now most often included in fertilizers and are necessary for agriculture [1,2]. Large amounts of phosphate wastes in water are also due to soaps and detergents and to mining wastes [3] and metallurgical industries [4,5]. Because the price of phosphates steadily increases, various treatments have been developed for their recovery. The methods in use include biological treatments [6], physical treatments [7], or chemical treatments such as precipitation or crystallization of phosphate-containing solids, like Ca-phosphate for instance [8,9]. Adsorption is comparatively the cheapest and most efficient technique [10]. To improve phosphate recovery, several active solids have been studied in recent years, in particular: iron-coated natural and engineered sorbents [11], slag materials [12], bauxite [13], ashes from coal and petroleum coke combustion [14], goethite [15], La-impregnated silica gel [16], natural calcite [17], B2O3 on borosilicate glasses [18], natural calcium-rich sepiolite [19], La-doped natural vesuvianite (double silicate of calcium and aluminum) [20], and La-doped natural bentonite clays [21].
Nano-titania, because of its availability, low cost and good stability, is considered as an important solid for the treatment of wastewater. However, nano-titania particles easily agglomerate and lose their activity. To overcome this problem and stabilize titania nanoparticles, natural porous solids, zeolites and clays have been tested [22,23]. The two latter types of materials have Al and Si species in framework positions and their porous volume is filled by water and compensating cations. Recent publication showed that a zeolite, with native charge-compensating cations exchanged by Ti-species, had enhanced properties for phosphate removal from water [24]. In contrast to zeolites, the exchange of the natural cations of clays can lead to an increase of porous volume associated with an improved adsorption capacity. This “pillaring” principle has been explored with mixed alumina/lanthanum-pillared montmorillonite [25] and with alumina clusters introduced between the layers of a natural bentonite clay from Northeast Brasil [25]. Synthesizing titania pillars within montmorillonite to obtain a pillared inorganic layered compound (Ti-PILC) has also been reported in the studies of the Tianhong Mining Company (China) [26]. Montmorillonite is an expandable layered alumino-silicate mineral whose chemical composition depends on soil composition and hydration and on climate, and which can be represented by the general chemical formula: (EC)x+y(Si8–xAlx)IV(Al4–y–zFeyMgz)VIO20(OH)4·nH2O (with IV: Td site and VI: Oh site) [27], where EC are exchanged compensating interlayer cations (EC: Ca2+, Na+, K+ and even traces of Ti4+) and x, y, and z characterize metallic substitutions in the Si tetrahedral and Al octahedral sites [28–31]. The montmorillonite used here comes from the Maghnia region in Algeria. The preparation of Ti-PILC consists in exchanging the positive natural charges between a sodic-enriched version of the clay and colloidal titanium Ti(IV) polymeric complexes [32]. After calcination, TiO2 pillars are formed, the porous volume increases and an improvement of arsenic absorption capacity was observed [16]. Possible applications of Ti-PILC for photocatalytic reactions were also reported, for methylene blue degradation for instance [33].
The mechanism of UV-light activation has been studied in detail with pure commercial titania semi-conducting oxide (Degussa P25) [34]; its energy gap is given by the equation E = hc/λ (the band gap of semiconductor is essentially the energy gap between the valence and conduction bands). This model, based on a band-gap of 3.1 eV, classically assumes that upon absorption of UV-light, the electrons located in the valence band (VB) are promoted into the conduction band (CB, e−CB) leaving positive holes (h+-VB) in the valence band. These electrons and holes migrate on the titania surface where they react respectively with dioxygen and water molecules, leading to the formation respectively of superoxide O2− and HO radicals. Therefore, the number of TiOH superficial groups increases [35].
In the present study, we prepared a single batch of Ti-PILC where we introduced much more Ti-species than the maximal amount of titanium that can be intercalated within the layers. By XRD, N2 sorption, and TEM, we have identified in calcined samples three kinds of Ti-oxide nanoparticles: 1) intercalated within the layers, 2) rutile nanoflowers, and 3) anatase deposits. Secondary cationic species Men+ such as La3+, Se4+ and Rb+ in 3%(w/w) have been introduced using ultrasounds. After washing, drying and calcination at 450 °C in air for 3h, the obtained Me/Ti-PILC have been used for the removal of phosphate ions in aqueous solutions, under very acidic conditions (pH ≈ 1.4). This high acidity level was selected to avoid the spontaneous speciation of phosphorus species in water and the formation of polyphosphates. Under such conditions, dihydrogenophosphate anions, H2PO4−, are predominant. The removal of phosphate ions was monitored as a function of time, both in the dark and under UV light.
2 Experimental
2.1 Reagents
The natural clay was provided from the Roussel-II mine of the Maghnia region (Northwestern Algeria). This clay of Montmorillonite-type is of a grey-white color. Identified inorganic impurities are quartz (α-SiO2) and feldspar (NaAlSiO4) [36]. HCl (37%, Prolabo), TiCl4 liquid (99%, Fluka), H3PO4 (88%, Sigma Aldrich), La(NO3)3.6H2O, SeO2 anhydrous and RbCl (all three from Sigma-Aldrich) were used as received.
2.2 Preparation of Ti-PILC
The natural clay has been subjected to sedimentation (24 h in double-distilled water) to remove a substantial amount of Limon impurities. The clay was then submitted to a sodium-exchange (homoionisation step). In a large container, the clay was suspended in a molar NaCl solution (400 g of clay with 4 L of 1 M solution) under ambient conditions, for 7–10 days. The solid was extracted by decantation and separated into fractions by using the Stokes method (selected aggregate fractions ≤2 μm). The sodic clay was recovered by centrifugation (4000 rpm for 15 min) and the precipitate was washed with distilled water. Ti-PILC was obtained (Scheme 1) by adding drop wise of Ti-polymeric complex aqueous solution to the sodic clay suspension. The complex was prepared by addition of 120 mL of HCl (6 mol L−1) solution to 44 mL of pure TiCl4 with an addition rate of 14.7 mL min−1. The obtained complex solution was left to mature for 36 h. The H+/Ti4+ molar ratio was fixed at 1.8. The complex-containing solution was added to the sodic clay suspension with a peristaltic pump, at a rate of 8 mL min−1, under stirring and under ambient conditions (1 atm, 25 °C). After centrifugation (performed at 3000 rpm for 15 min) with two washing cycles, the single batch of Ti-PILC was dried at 80 °C for 24 h and calcined at 450 °C in air for 3h (rate: 5 °C min−1). The proportion of titanium was measured in the calcined Ti-PILC by XRF to be Ti4+/sodic-clay = 60 mmol g−1.
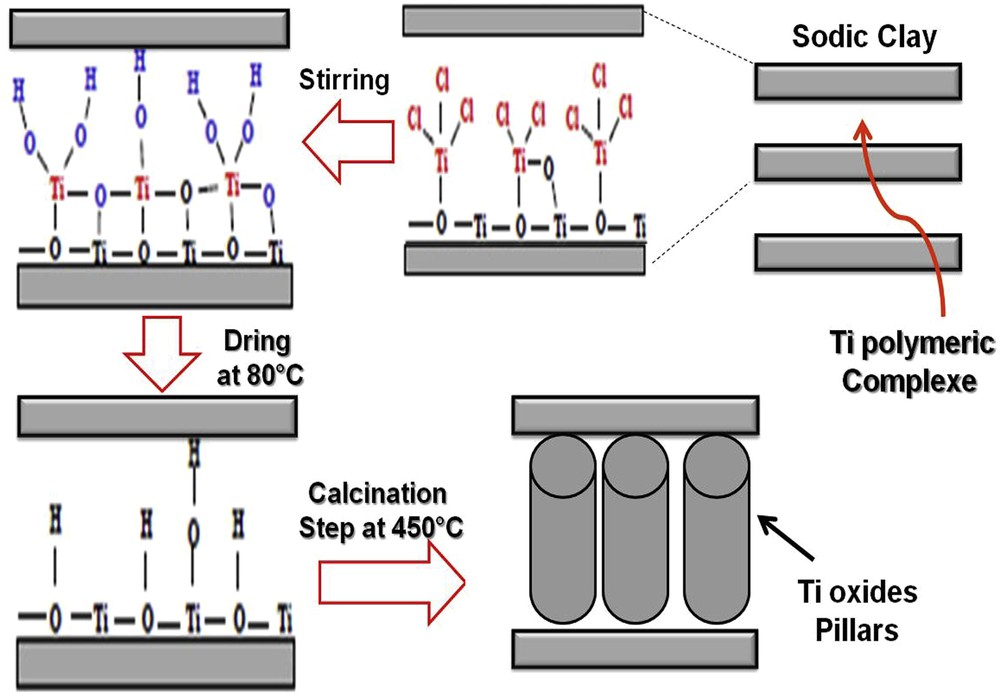
Synthetic steps of intercalation of sodic clay by a polymeric complex [28].
2.3 Introduction of the secondary Me species
The three “Me” precursors (Me: La, Se or Rb) were weighed and dissolved into pure distilled water to produce 0.5 mol L−1 solutions. These solutions were dispersed on calcined Ti-PILC for a fixed atomic ratio of 3% (w/w) of the added element. The intermediate suspensions were submitted to treatment in a ultrasound bath (25 KHz, EULMA S10H) at 40 °C for 24 h. Centrifugation was then performed (3000 rpm, 15 min) and the material was washed twice with 120 mL of distilled water. The recovered solids were dried at 80 °C overnight. The three solids were calcined in air at 450 °C for 3 h (rate: 5 °C min−1) and were labeled “Me/Ti-PILC” (Me: La, Se or Rb).
2.4 Quantification of phosphate species in aqueous solutions
Distilled water with low hardness (degree <7) was used to avoid any precipitation of phosphate species with Ca2+ and/or Mg2+ cations (potentially present in conventional mineralized water).
In this work, the solutions used for the phosphate removal study were prepared by dilution in water of phosphoric acid with a concentration of 75.97 g L−1 (or 6.8 × 10⁻³ mol L−1 of phosphorus, with pH = 1.36). The H3PO4 triacid has three pKa [37]:
- (1)
- (2)
- (3)
At these concentration and pH values, the most favored phosphate species is dihydrogenophosphate (H2PO4−) and the condensation of phosphate species remains unlikely. This phosphorus concentration corresponds to water contamination by phosphate mines of the Skikda region in Algeria.
To quantify the phosphorus species, we directly used the absorption band due to the π→π* electronic transition occurring in PO double bonds with a UV-spectrometer (Jasco V-630). The maximum of this band is located between 250 and 260 nm depending on the phosphorus concentration in water (and therefore the pH). The maximum of absorption was plotted as a function of the weight concentration of phosphoric acid from 10 to 110 g L−1. A straight line was obtained by considering the intensity of the maximal absorption (which position is pH-dependent) and its slope was further used to deduce the phosphorus concentration, expressed in weight by Liter, from the measured absorbance, using the Beer–Lambert relation.
2.5 Techniques of characterization
X-ray Fluorescence (XRF) spectra were measured with a XEPOS (Spectro Ametek) spectrometer. With this apparatus, quantification of all elements with 12 < Z < 92 (between 12Mg and 92U) is possible. The elements are quantified as milligrams per kilogram (ppm) or percentage.
XPS spectra were collected on an Omicron X-ray photoelectron spectrometer. XPS measurements were performed under ultra-high vacuum (UHV) conditions (1 × 10⁻⁸ Pa) at room temperature with a ESCA+ (Electron Spectroscopy for Chemical Analysis) using excitation by AlKα (hν = 1486.6 eV). The characteristic X-ray irradiation source works at 280 W (20 mA, 14 kV) with a 1 mm2 spot size. After data collection, the binding energies were calibrated with respect to the binding energy of C1s, set at 284.7 eV [38]. Spectra processing was carried out using the Casa XPS software package.
Crystalline particles were identified by X-ray diffraction (XRD) at large angles under ambient conditions of temperature and pressure. Identifications were made by comparison with ICDD (International Crystallography Diffraction Data). A Siemens D500 with a Bragg-Brentano 2θ geometry (λ(CuKα) = 1.5418 Å) has been used. X-ray diffractograms were collected at 40 mW and 40 mA over an angular range of 10 < 2θ < 90° by scanning in steps of 0.01° and with a counting time of 10 s per step.
Field-emission gun scanning electron microscopy (SEM-FEG Zeiss ultra 55) was used to study the morphology and the size of clay and titania nanoparticles, with an acceleration voltage of 5 kV. Additional HR-TEM transmission electron micrographs have been obtained with a JEOL 2011 microscope (200 kV). Powders were suspended in ethanol and deposited on a copper grid covered by a carbon film for investigation of the titania and clay particles. The identification of titania allotropic varieties is possible based on fringes that correspond to reticular planes. However, with this technique, precise measurements of the clay interlayer spacing are difficult due to the ultra-high vacuum in the TEM chamber (see the Discussion section). Energy dispersive spectra (EDS) were used to assess the chemical homogeneity of the samples.
N2 (Air Liquid 99%) sorption isotherms at 77K were measured with a static volumetric ASAP 2020 Micromeritics apparatus. 100 mg of the sample were degassed for 3h at 423K until a pressure of 0.134Pa (1.34.10−3 mbar) was reached. The Brunauer–Emmett–Teller (BET) formula was used to obtain the surface area in the relative pressure range of 0.1–0.3. The total pore volume (Vp) was estimated from the amount of nitrogen adsorbed at a relative pressure of 0.975. The microporous volume (Vμp) was calculated using the t-plot equation (with the Harkins–Jura statistical model) [39].
Diffuse reflectance UV-visible-NIR spectra were collected in air and on solid powders with a Cary 5000 (Agilent) spectrometer, equipped with an internal diffusion sphere of 70 mm in diameter covered with white Teflon (PTFE, Teflon®). Teflon was also used as a reference. Spectra were acquired over the range of 200–2500 nm (200–400 nm for UV, 400–800 nm for visible and above 800 nm for NIR). Data acquisition was made with a Spectral Band Width, SBW, of 2 nm and with a rate of 600 nm per min. This technique was used here because it provides information on the nature and band gap of semi-conducting oxide nanoparticles. On the spectra of titania, the band gap position should be affected by the nature (anatase 3.02 eV and rutile 3.1 eV [40,41]) of the nanoparticles, their size and shape and also by their contacts with secondary cations and/or other nanoparticles.
2.6 Photocatalytic reactor and phosphate photo-removal
Scheme 2 displays the continuous stirring reactor used for dephosphatation tests. This reactor consists of a Teflon cylindrical-jacket and a stainless cover; the assembly was irradiated by a UV-A excitation source (365 nm). 200 mg of the solid catalyst were introduced in 100 mL of the H3PO4 solution and a first equilibration time of 60 min in the dark was used. The reactor was then irradiated with a double UV lamp (Philips linear tube, total optical power 5W, 70 mm in length). Aliquots of the solution were collected using a syringe equipped with a filter membrane disk with 0.25 μm porosity. The evolution in time of the concentration in phosphate species without and with the UV-A irradiation was monitored every 30 min.

Schematic representation of the reactor used for dephosphatation tests.
3 Results and discussion
3.1 Comparison of chemical compositions (atomic absorption, XRF, and XPS)
Elementary analysis by atomic absorption of Algerian pristine natural clay (raw clay) gives atomic percentages of 32.38% Si, 7.78% Al, 0.56% K, 0.12% Ti, 0.21% Ca and 0.84% Fe, which are consistent with the literature data [36,42]. Table 1 displays the chemical compositions obtained by XRF for the Na-exchanged clay, Ti-PILC and three Me/Ti-PILC samples. The observed differences in Si and Al contents between raw clay and Na-exchanged clay are associated either with the solid purification (due to elimination of quartz traces) or with a small dealumination. A clear increase of the Ti atomic proportion (from 0.12 to 19.8%) between sodic clay and Ti-PILC, matched by parallel decreases in both Al and Si atomic proportions, is observed. The Si/Al ratio remains similar for three Me/Ti-PILC catalysts and Ti-PILC, indicating that the chemical composition of the clay is only slightly modified by ultrasound treatment and calcination. After washing and centrifugation, the atomic proportions of secondary Me-species are very small and vary in the following order: Se/Ti-PILC (0.62%) > Rb/Ti-PILC (0.21%) > La/Ti-PILC (0.10%). The value obtained with the La-species is particularly small, which indicates probably an important loss of La during the dispersion under ultrasounds and the associated centrifugation/washing. Traces of chlorine were detected with Ti-PILC but minimized (0.03%) after the deposition of secondary species and the subsequent washings.
Ratios and chemical composition by atomic absorption for all samples.
| Atomic concentrations (%) | Si | Al | Mg | K | Ca | Ti | Cl | Fe | La | Se | Rb | Al/Si | Me/Si |
| Sodic clay | 24.15 | 4.95 | 0.82 | 0.88 | 0.78 | 0.12 | 0.01 | 1.61 | / | / | / | 0.20 | / |
| Ti-PILC | 7.70 | 1.26 | 0.16 | 0.18 | 0.05 | 19.80 | 0.16 | 0.35 | / | / | / | 0.16 | / |
| La/Ti-PILC | 7.10 | 1.18 | 0.19 | 0.15 | 0.06 | 19.40 | 0.03 | 0.33 | 0.10 | / | / | 0.25 | 0.02 |
| Se/Ti-PILC | 6.40 | 1.21 | 0.34 | 0.14 | 0.07 | 18.00 | 0.03 | 0.30 | / | 0.62 | / | 0.19 | 0.10 |
| Rb/Ti-PILC | 6.50 | 1.12 | 0.17 | 0.12 | 0.03 | 17.70 | 0.03 | 0.30 | / | / | 0.21 | 0.17 | 0.03 |
Table 2 presents a direct comparison of atomic percentages obtained by XRF and XPS. Both of these techniques use X-rays; however XRF is considered a bulk technique whereas, for large enough particles, XPS is considered as a surface technique. Indeed, in the depth XPS surface, the detected photoelectrons are known to range between 0.5 and 10 nm. Here, the clay particles are much bigger. The difference in concentration of secondary Me-species shown by the larger values measured in XRF (0.6% Se) than in XPS (0.3% Se3p) proves that these species lie deep within the clay particles. In XRF, the chemical compositions in Ti and Si remain identical between Ti-PILC and Me/Ti-PILC. In XPS, the integrated surface of the Ti2p photoelectron peak (relative to the total intensity of the photoelectrons) decreases from 9.2% (for Ti-PILC) down to 0.6% (for La/Ti-PILC) after lanthanum dispersion under ultrasound and after calcination. Otherwise, two broad photopeaks at 464.5 and 458.6 eV correspond to the Ti2p1/2 and Ti2p3/2 of the Ti(+IV) oxidation state in Ti-PILC and three Me/Ti-PILC samples. In parallel, the atomic percentage of Si2p is halved.
Comparison of chemical compositions obtained by XPS and XRF (O1s percentages, Ti/Si and O/Ti ratios).
| Catalysts | Ti2p (%)XPS | Ti (%)XRF | Si2p (%)XPS | Si (%)XRF | Secondary element (%) XPS | Secondary element (%) XRF | B.E. of O1s in eV (percentage %) | Ti/SiXPS | O/TiXPS |
| Ti-PILC | 9.2 | 19.8 | 10.9 | 7.7 | / | / | O1 532.1(87.55) O2 529.9 (12.45) | 1.86 | 7.87 |
| La/Ti-PILC | 0.6 | 19.4 | 5.0 | 7.1 | 0.0 (La3d) | 0.1 (La) | O1 532.04 (62.36) O2 530.28 (16.16) O3 533.47 (21.48) | 0.43 | 16.58 |
| Se/Ti-PILC | 0.8 | 18.0 | 4.4 | 6.4 | 0.3 (Se3p) | 0.6 (Se) | O1 531.98 (65.42) O2 530.15 (17.10) O3 533.52(17.48) | 1.2 | 11.5 |
| Rb/Ti-PILC | 1.6 | 17.7 | 4.4 | 6.5 | 0.0 (Rb3p) | 0.2 (Rb) | O1 532.17(85.22) O2 529.91(14.78) | 1.05 | 6.4 |
For the O1s XPS spectra (Fig. 1), the photopeaks can be decomposed into two or three components. The observed O1s B.E. (binding energies), the three species relative percentages, the overall O/Ti and Ti/Si atomic ratios are also summarized in Table 2. A first O atom (noted O1) is common to the five studied samples. For sodic clay, a single O1s photo-peak (100% of intensity), observed at 532.0 eV, corresponds to oxygen atoms of the surface clay (O1). For Ti-PILC, besides the first peak at a similar position at 532.0 eV (O1), a second peak at a lower energy is observed. The second peak is located at 529.9 eV (labeled O2) and can be related to oxygen in TiOTi bonds according to the literature [43]. The O1 and O2 peaks have relative intensities of 87.55:12.45, very far from the Ti/Si ratio. This difference can be explained by assuming that some TiOH groups contribute to the O1 peak. The spectra recorded for Rb/Ti-PILC are similar to that of Ti-PILC (Fig. 1), as expected because of the very small amount of Rb-species remaining inside the sample after the centrifugation and washing. By contrast, three distinct O1s peaks are detected with La/Ti-PILC and Se/Ti-PILC. The first one (O1) is associated with oxygen atoms at the surface of the clay and TiOH, and the second one (O2) is related to oxygen atoms of titania nanoparticles. The Ti/Si ratio and the relative contributions of the O1 and O2 peaks are not the same for Ti-PILC and La/Ti-PILC or Se/Ti-PILC, which indicates that some of the accessible Ti-species are modified by the ultrasound treatment and calcination step. A third O1s XPS signal, noted O3, is located at a higher energy of 533.47–533.52 eV and its position matches that of a signal previously identified in the partially reduced Magneli Ti8O15 phase [44]. We think that this O3 signal is characteristic of O vacancies which have reacted with water and/or oxygen during the sample storage in air. These peculiar species are very important, because we will show further, that these species are associated with a cationic migration inside the anatase nanocrystallites. We will also show further, that La/Ti-PILC and Se/Ti-PILC catalysts contain these species (O3) which would be responsible to complete photocatalytic removal of phosphate anions from water under our experimental conditions.
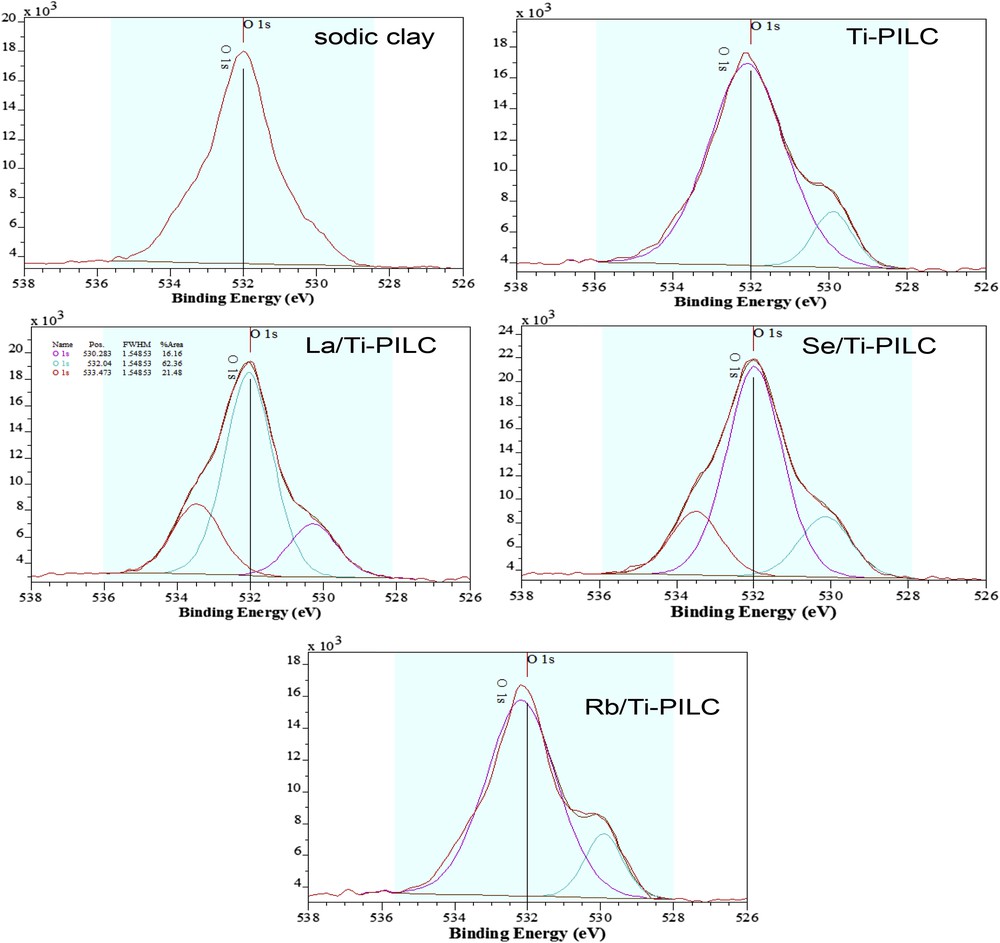
XPS depth analysis of the O1s peak on the surface of sodic clay, Ti-PILC and three catalysts.
3.2 Structure and morphologies (XRD, TEM, and SEM)
X-ray diffraction measurements of natural clay, Ti-PILC and Me/Ti-PILC (with Me: La, Se, Rb) are shown in Fig. 2 (A, B). In the diffractograms of the calcined samples, some SiO2 quartz lines (ICDD 85-1780) are detected at 21, 27, 60 and 63°. The montmorillonite diffraction peaks (ICDD 002-0014) and those of rutile TiO2 (ICDD 01-078-1508) are systematically superimposed. The (200), (211), (110), (002) and (301) rutile lines are indicated in Fig. 2-B. Another diffraction peak, due to the main diffraction line of TiO2 anatase (ICDD 089-4203), is also detected (Fig. 2-B). Anatase is not completely transformed into rutile because of the low temperature of calcination (<600 °C). Amorphous Ti-rich domains must have been present in the uncalcined samples; obviously, these amorphous species cannot be detected by XRD. However, their presence is necessary to explain why a strong diffraction of anatase, absent before calcination, is detected after. The position of the anatase peak is slightly changed after deposition of the secondary Me-species and calcination (from 3.5195 Å with Ti-PILC to 3.5184 Å with Se/Ti-PILC and 3.5137 Å for La/Ti-PILC). Another piece of information can be obtained by XRD measurements: the lamellar (001) reflection of the natural clay, detected ca. 8° (distance 11.05 Å), is no longer observed with Ti-PILC and Me/Ti-PILC. This absence could be correlated with some disorder between adjacent layers of clay. The average size, circa 65 Å, of the rutile nanoparticles has been estimated using the FWHM (Full Width at Half Maximum) of the (110) diffraction peak, observed at 27.44°, using the Scherrer formula. For Me/Ti-PILC catalysts, no diffraction peak corresponding to oxides of La, Se or Rb (or metallic form) was observed. Moreover, the secondary species are detected by XRF and XPS more in the bulk than at the surface, these results indicate a high cationic mobility that is probably related to the method used to disperse the secondary Me elements (under ultrasound and calcination).
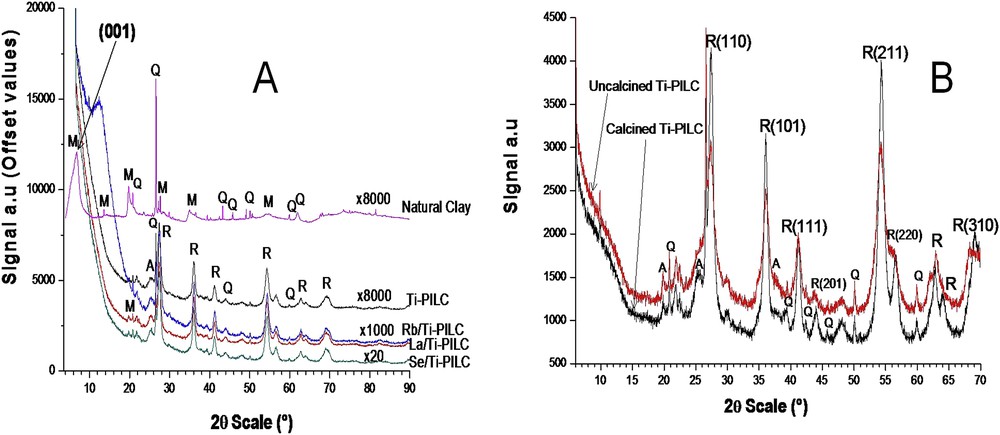
(A) X-rays powder diffraction patterns of natural clay and calcined catalysts (offset ×8000, ×1000, ×1000, ×20). (B) XRD of calcined and uncalcined Ti-PILC. M: montmorillonite; Q: quartz; R: rutile TiO2; and A: anatase TiO2.
The TEM images revealed, on the external surface of clay particles, very peculiar aggregates made of elementary radially arranged nanosheets. These titanium-rich aggregates are asymmetrical (TEM-EDS5) and will be called “nanoflowers” in the following. Several TEM micrographs and EDS analyses performed with Ti-PILC are displayed in Fig. 3. Table 3 gives atomic Si, Ti, Al percentages and Al/Si ratios for three nanoflowers selected to test their chemical homogeneity and also for three regions identified as montmorillonite crystals. The aggregates can be as large as 500 nm (TEM-EDS5) and are made of more than 50 nanosheets. EDS measurements have shown that they contain small concentrations of Al and Si. The nanosheets have a thickness of 8–17 nm and a length that can reach 100-150 nm. Similar nanoflowers have been observed for TiO2 nanoparticles grown on layered double hydroxides [45], in acidic ionic liquids [46], and also for titania nanocrystals grown on Si substrates [47]. The TEM micrographs of Ti-PILC also show that the distance between adjacent clay layers is ca. 13.0 nm but this measure is probably affected by the vacuum in the TEM microscope (TEM-EDS6). As expected, this value is larger than 9.0 nm reported for the dehydrated montmorillonite [48]. Moreover, on three distinct EDS measurements, atomic concentrations are reasonably reproducible (Table 3). The Al/Si ratio remains roughly constant (in agreement with atomic absorption analysis) and indicates that there is no significant dealumination of the montmorillonite. The cationic exchange capacity of montmorillonite lies between 70 and 120 meq of monovalent cations (meq: milliequivalent) for 100 g [49,50]. The maximum amount of Ti4+ cations that can be intercalated within the layers cannot then exceed an atomic percentage of 30% (120/4). One of the measured EDS values (EDS1: 46.8%), reported in Table 3, is significantly larger than the literature value. This large value is actually consistent with the presence of Ti-rich domains outside the clay particles.
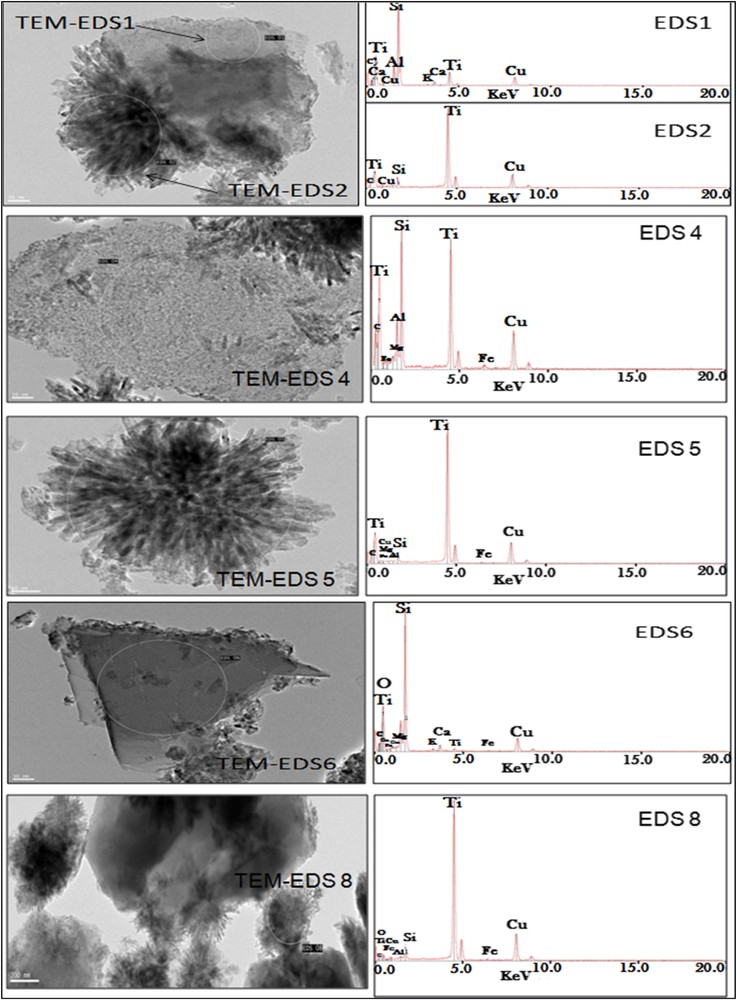
TEM/EDS of titania nanoflowers and intercalated montmorillonite domains in Ti-PILC. The detection of Cu is due to the used sample holder (grid of copper covered with a carbon film).
EDS/TEM analysis of Ti-PILC (calculation performed without the Cu peak).
| Compositions | %Si | %Ti | %Al | AlOh/SiTd(a) |
| Nanoflowers (EDS2) | 10.1 | 87.8 | 2.0 | 0.20 |
| Nanoflowers (EDS5) | 4.8 | 88.6 | 1.9 | 0.39 |
| Nanoflowers (EDS8) | 6.6 | 79.5 | 2.2 | 0.33 |
| Montmorillonite–crystallite (EDS1) | 48.6 | 25.7 | 11.2 | 0.23 |
| Montmorillonite–crystallite (EDS4) | 30.9 | 46.8 | 10.9 | 0.35 |
| Montmorillonite–crystallite (EDS6) | 61.0 | 21.2 | 12.7 | 0.20 |
a Oh: octahedral, Td: tetrahedral.
Fig. 4 displays HR-TEM images of the nanosheets in the nanoflowers of the calcined Ti-PILC sample. Clear lattice fringes are measured all along the nanoparticles, showing that they are monocrystalline. Fringes arising from reticular planes with a spacing of 3.3 and 2.5 Å are respectively associated with the (110) and (101) reticular planes of the rutile tetragonal unit-cell.
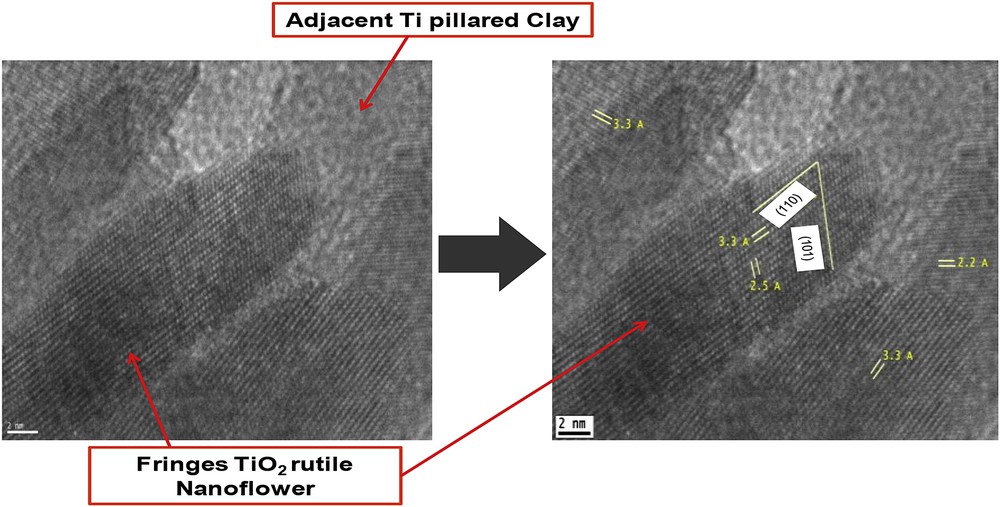
HR-TEM micrographs of TiO2 rutile nanoflowers (JCDD 078-1508) in Ti-PILC.
The SEM micrograph of La/Ti-PILC shown in Fig. 5 demonstrates that the titania nanoflowers are preserved after the ultrasound treatment used for the deposition of secondary species.
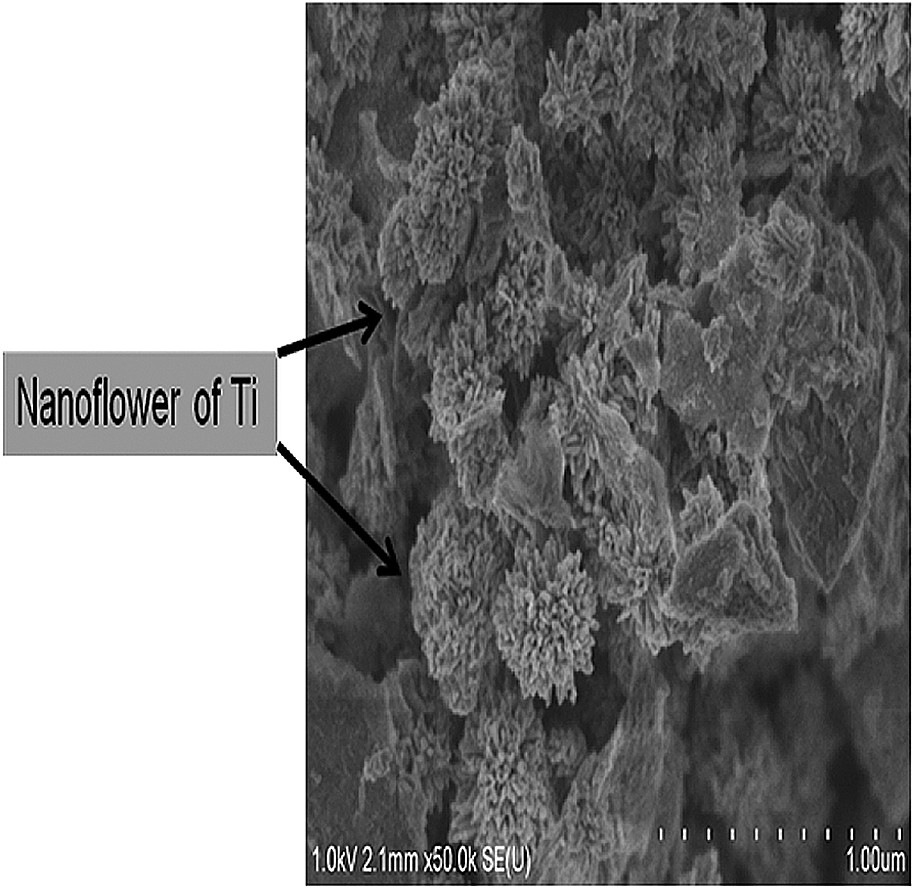
SEM micrographs of TiO2 nanoflowers and clay particles in La/Ti-PILC.
3.3 Textural characterization by N2 sorption
The textural parameters of Ti-PILC and Me/Ti-PILC are summarized in Table 4. The highest BET surface area (116.2 m2/g) is that measured with Ti-PILC. The surface area is only slightly modified after incorporation of secondary species and calcination step; SBET varies in the following order: Ti-PILC (116.2 m2/g) > Se/Ti-PILC (115.2 m2/g) > Rb/Ti-PILC (113.0 m2/g) > La/Ti-PILC (110.3 m2/g). The N2 sorption isotherms of Ti-PILC and 3% Me/Ti-PILC materials are compared in Fig. 6. For all four samples, the isotherm shapes are typical of slit-shaped pores of size in the mesoporous range. According to the IUPAC nomenclature, they correspond to type IV isotherms with a hysteresis loop of type H4. For all four materials, the first points indicate the additional presence of micropores [36,42]. The pore size distribution curves calculated from the adsorption branch by the BJH method are plotted in Fig. 6 and can be analyzed as follows: (1) small mesopores of radius ca. 3.65 nm are present in all the samples; (2) on the left side of the distribution curve, micropores are present for the four samples (detection limit: 2 nm); and (3) on the right part of the distribution curves, mesopores of 4.70 nm diameter in Ti-PILC are replaced in Me/Ti-PILC by much larger mesopores of diameter reaching up to 7.00 nm. Analyzing of Ti-PILC and Me/Ti-PILC samples by N2-sorption is therefore complex: although the specific surface area and overall porous volumes are not strongly modified by the ultrasound treatment, the micropores are eliminated, and mesopores are enlarged. In Table 4, the average pore diameter is only an estimate using the ratio of the volume Vp to the surface SBET (4Vp/SBET).
Textural characteristics of all samples.
| Catalysts | SBETa(m2/g) | VPb(cm3/g) | Dc(nm) |
| Ti-PIaC | 116.2 | 0.21 | 9.6 |
| La/Ti-PILC | 110.3 | 0.19 | 8.6 |
| Se/Ti-PILC | 115.2 | 0.23 | 8.6 |
| Rb/Ti-PILC | 113.0 | 0.19 | 8.5 |
a Specific surface area calculated using the BET equation in the P/P0 range of 0.05–0.3.
b Total porevolume (measured at a P/P0 of 0.97).
c Estimated average diameter calculated as (4Vp/SBET).
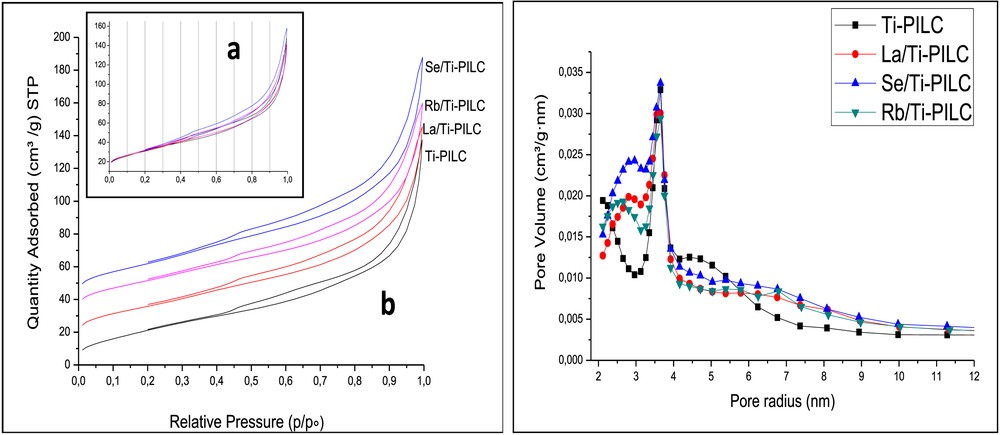
N2 Isotherms for Ti-PILC and Me/Ti-PILC: (a) without offset and (b) with offset (×-10, 5, 20, 30). Pore size distribution with the BJH model applied to the N2 desorption (Harkins and Jura correction).
3.4 UV-vis. diffuse reflectance
UV–Visible absorption spectra of Ti-PILC and Me/Ti-PILC solids recorded in Diffuse Reflectance Spectroscopy are presented in Fig. 7. With Ti-PILC, a first small absorption peak below 515 nm (2.4 eV) is associated with a strong signal at 400 nm (3.1 eV) that corresponds to the titania band gap. The first peak due to structural defects is no longer detected after introduction of secondary Me-species and calcination. The titania band gap is not modified, as expected because of the very low concentration in the “Me” element. Background signals in the UV-visible region are detected and vary as Rb/Ti-PILC > Se/Ti-PILC > La/Ti-PILC > Ti-PILC. The very large increase in background that is specific of Rb is compatible with the presence of a small proportion of reduced Rb species despite the calcination step. A small signal, always detected around 1500 nm, confirms the presence of TiOH bonds.
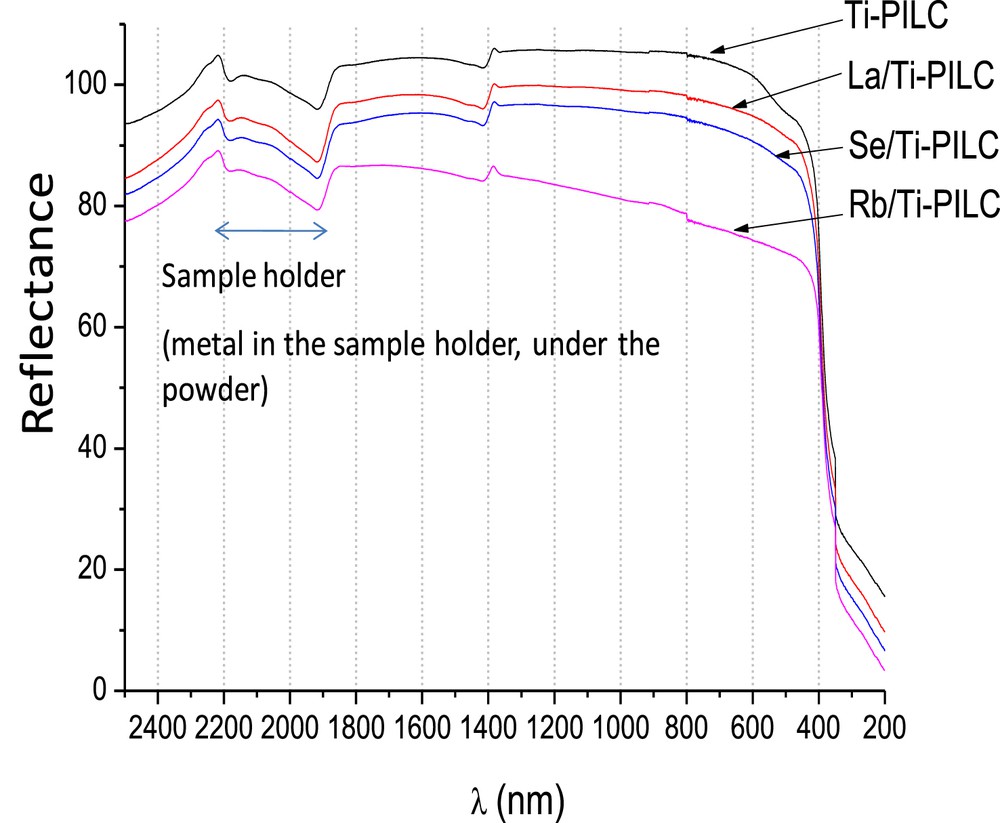
UV-visible absorption spectra of Ti-PILC and Me/Ti-PILC.
3.5 Evaluation of the photocatalytic activity
The rate of phosphate removal from water was evaluated using a first-order kinetic expression:
kapp (min−1) is the apparent rate constant of the reaction, assuming a pseudo-first order in a Langmuir–Hinshelwood model. C0 (gL−1) is the initial concentration of phosphates and Ct is the remaining concentration measured after time t (minutes).
Fig. 8 displays the variation of Ct/C0 in a function of the reaction time for polluted water containing 75.97 g L−1 of H3PO4. Prior to UV irradiation, all photocatalysts and contaminated water were kept in the dark for 1 h (at room temperature) to reach an equilibrium adsorption state. All the photo-removing performances of calcined Me/Ti-PILC, calcined Ti-PILC, and uncalcined sodic clay were then evaluated under UV irradiation at different times (60–300 min), under identical experimental conditions and continuous stirring. The aim of testing the uncalcined sodic clay is to estimate its adsorbent capacity and to compare it to those of Ti-PILC and Me/Ti-PILC. The use of uncalcined sodic clay, as photocatalyst, was in reality not possible, because this sample swells in water and can even become a viscous material with muddy aspect.
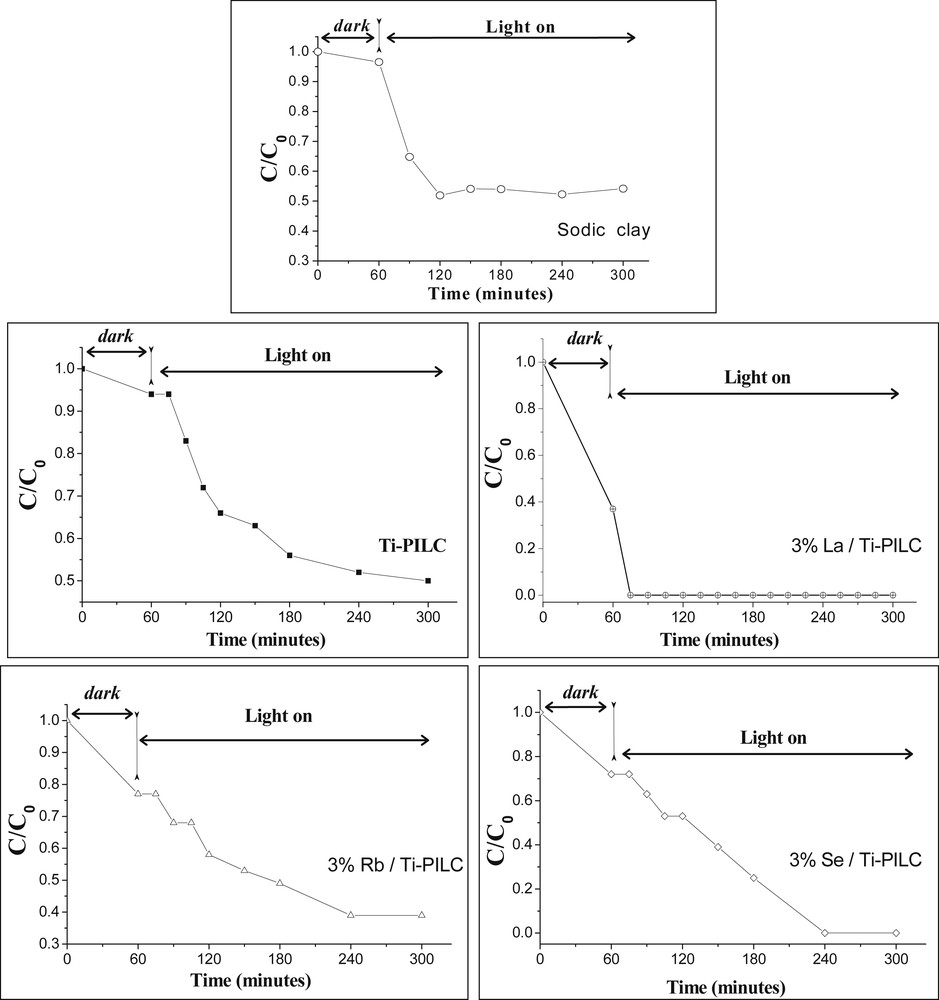
Variation of C/C0 in a function of the irradiation time over Ti-PILC and Me/Ti-PILC (75.97 g L−1of H3PO4 or 0.0068 mol L−1 of phosphorus, pH = 1.36).
After 60 min in the dark, a low proportion of phosphate ions is removed with both sodic clay (5%) and Ti-PILC (8%). This proportion is improved after deposition of the secondary species (60% with La/Ti-PILC, 25% with Rb/Ti-PILC, and 30% with Se/Ti-PILC). This amount is governed by chemical interactions, electrostatic forces [51] and also by an exchange between the hydroxyl groups present on the catalyst surface and dihydrogenophosphate ions, leading for instance to monodentate adsorbed species, as illustrated in the following scheme:
Under UV illumination, the photocatalytic activities are improved and increase along sodic-clay≈Ti-PILC < Rb/Ti-PILC < Se/Ti-PILC < La/Ti-PILC. The mechanism involved is difficult to fully elucidate with the present data. Obviously, the phosphorus species cannot undergo a photo-degradation due to OH radicals and should rather be adsorbed on the catalysts modified by the irradiation. An exchange between the O2–• radicals that are generated by the UV irradiation and the phosphate anions is also possible.
Our work allows identifying three important factors to improve phosphate photo-removal: 1) titania nanoparticles inserted within the clay layers increase its porous volume; 2) addition of Me-secondary species; and 3) UV light. The two most active catalysts, La/Ti-PILC and Se/Ti-PILC, are those in which the peculiar O1s XPS peak (noted O3 peak) is observed. This peak is attributed to anionic O vacancies and associated with cationic migrations occurring inside anatase nanoparticles, in good agreement with the literature available for La/anatase and Se/anatase supported samples [52,53]. These O vacancies have evolved during the sample storage in air. Indeed, these two catalysts keep the largest O/Ti XPS atomic ratios. The amount of Ti-species accessible to XPS is lower in La/Ti-PILC than in Se/Ti-PILC but the proportion of O vacancies (O3 species) detected by XPS is larger for La/Ti-PILC which is the most active catalyst. For Se/Ti-PILC, the secondary species dispersed on the external surface of the catalyst remain accessible to XPS. This sample corresponds to the highest atomic O/Si ratio (13.09 compared to 7.17 for La/Ti-PILC) but has a lower proportion of O3 species and is therefore less active. The observed capacity of La/Ti-PILC for phosphate removal (6.6 × 10⁻³ mol.L−1 per gram of catalyst) is 100 times better than the value measured for natural zeolites (1.3 mg/g) and also significantly larger than that of Ti-modified zeolites (34.5–37.6 mg/g) [54].
Under our experimental conditions, the pH change with time is particularly difficult to be considered since some dissolution CO2 from air is expected. More detailed studies aimed at demonstrating the role of O2– radicals and at understanding the mechanism of formation of the rutile titania nanoflowers are now required. The concentrations in Me-species (Se and La) and conditions of calcination (time, rate, final temperature) have also to be optimized.
The main interest of our results is to show that we can use very simple experimental conditions of laboratory scale, simple characterization techniques (no sophisticated techniques) under cost-effective conditions. Thereafter, the differences between the photo-catalytic and adsorption properties of several solids can be compared; it corresponds to a necessary preliminary step before to apply for more advanced experimental techniques, especially those using synchrotron radiation.
4 Conclusion
We synthesized a Ti-PILC material which contains intercalated Ti species inside montmorillonite clay and identified (using XRD) two kinds of excess titania species: nanoflowers of rutile and nanocrystals of anatase in calcined samples. Modifications of the anatase unit-cell were observed by XRD after calcination steps. HR-TEM micrographs of Ti-PILC proved necessary to identify rutile in external nanoflowers. A doping of this material was achieved by introducing La, Se and Rb elements, under ultrasound exposure. The specific surface evolves in the following order: Ti-PILC (116.2 m2/g) > Se/Ti-PILC (115.2 m2/g) > Rb/Ti-PILC (113.0 m2/g) > La/Ti-PILC (110.3 m2/g). The global porous volume is not modified by the deposition of secondary species (no dealumination is detected) but the micropores are suppressed and the mesopores are enlarged. In UV-visible spectroscopy, the backgrounds vary in the following order: Se/Ti-PILC > La/Ti-PILC > Ti-PILC, and a very large increase of background was observed for Rb/Ti-PILC, suggesting that some Rb species are in the metallic form after calcination. Adsorption and photocatalytic properties of Me/Ti-PILC and Ti-PILC for phosphate removal, in the dark and under UV irradiation, were studied. Results show that the maximum phosphate adsorption is obtained with secondary La and Se species under UV irradiation. According to the XPS results, the good photocatalytic activity of La and Se catalysts can be correlated to the higher oxygen content on their surface. In addition, the presence of O3 oxygen species (characteristic of O vacancies) observed only on the surface of La- and Se-catalysts seems to enhance the photocatalytic activity. In the presence of La/Ti-PILC, we have observed that 75.97 g of phosphate species can be retrieved in less than 70 min of UV irradiation through the good production of OH and O2− radicals. Further investigations are needed to reach a better understanding of the photocatalytic mechanisms.
Acknowledgements
This work has been financially supported by the LMCCCO laboratory of USTHB (Algiers, Algeria). We thank Dr. Mohammed Kebir for his contribution to photo-removal measurements.