

1 Introduction
Synthetic organic dyes are widely used in various industries (textile, leather, paper, plastic, cosmetics, photographic, and biomedical) as coloring agents because of their wide spectrum of shades, such as ability for covalent attachment to fibers, ease of application, brilliant colors, and minimal energy consumption [1]. These properties justify the annual production over 7 × 10⁵ tons of dyes [1,2]. Unfortunately, their proved toxic, mutagenic, and carcinogenic characteristics [3,4] represent an important ecological concern, as a significant part of the total production of dyes (about 15%) is lost and discharged into the environment as effluents during dye production and dying processes [1,5,6]. Improper handling of water pollution with dyes can affect the quality of the drinking water for several generations.
In this regard, numerous chemical, physical, and biological methods have been developed for the efficient removal of organic dye pollutants from wastewaters [7–9]. Among chemical methods, photocatalysis is very often used for the effective removal of organic dyes from industrial effluents. Frequently, the photodegradation of these refractory pollutants is successfully mediated by titanium dioxide (TiO2) because of strong oxidizing capacity, chemical and biological stability in aggressive reaction environment, cost effectiveness, and nontoxicity [10,11]. In spite of these benefits, two major drawbacks are often mentioned in the literature to hinder the practical application of TiO2 as photocatalysts for these kinds of processes: (1) absorption limited to ultraviolet light, which represents only about 4% of the solar spectrum, because of its relatively wide band gap (around 3.2 eV depending on structural parameters) [12–14] and (2) difficulties in recovering from the reaction environment and recycling of the photocatalyst [10]. The solution to simultaneously solve these problems is to dope the TiO2 with a narrow band gap magnetic material [10,15]. The most appropriate doping compounds are the spinel ferrites, and particularly the zinc ferrites, because of their good magnetic properties, band gap ranging between 1.0 and 2.0 eV (depending on chemical composition and synthesis method), chemical and physical stability in photodegradation medium, low cost, and relatively easy preparation [12,16–18]. Several strategies were adopted to obtain ferrite–TiO2 composites. Two main approaches for the synthesis of such composites should be taken into account either by one-pot method [17] or by two-step method [18,19]. The two-step synthesis procedure consists of two possible preparation routes: one refers to preparing the spinel ferrite in the presence of titania [18] and the other to the synthesis of TiO2 over preprepared dopant nanoparticles [19]. Nevertheless, to the best of our knowledge, no study dealing with the influence of the order of the component synthesis on the properties of the resulted photocatalysts for the two-step procedure was previously reported.
In the present work, nanocomposite materials having 10ZnFe2O490TiO2 (wt %) composition, prepared via a two-step synthesis procedure by alternating the order of the component addition during the preparation protocol are studied. Furthermore, their performances as visible light–driven photocatalysts for Rhodamine 6G degradation are evaluated.
2 Experimental section
2.1 Materials
Analytical grade nickel nitrate, zinc nitrate [Zn(NO3)2·6H2O], iron nitrate [Fe(NO3)3·9H2O], citric acid monohydrate [C6H8O7·H2O], Pluronic F-127, titanium isopropoxide (TIPO) [Ti(OCH(CH3)2)4], isopropanol [C3H8O], and Rhodamine 6G [C28H31N2O3Cl] dye were used without further purification as purchased from Sigma–Aldrich.
2.2 Synthesis of TiO2 (T)
A mixture of 10% Pluronic F-127 in a 1:1 water/isopropanol solution was ultrasonicated for 1 h at 25% amplitude with a horn-probe sonic tip (750 W; VibraCell) with ON and OFF cycle set for 2 s. Further, the required volume of TIPO was added (F127/TIPO = 1/1.7). The as-obtained mixture was subjected to the ultrasonication treatment for 1 h at 25% amplitude, with 2 s ON/OFF cycles. The resulted white precipitate was separated by filtration, washed with distilled water, dried, and finally calcinated at 450 °C to obtain the pure TiO2.
2.3 Synthesis of spinel ferrite (ZF)
ZnFe2O4 spinel ferrite (ZF) was prepared by a sol–gel autocombustion method using citric acid as a chelating/combustion agent [7]. In a typical synthesis approach, stoichiometric amounts of Zn(NO3)2·6H2O and Fe(NO3)3·9H2O with the molar ratio Zn2+/Fe3+ of 1:2 were dissolved in distilled water. Furthermore, the as-obtained nitrate solution was mixed with an aqueous solution of the fuel agent (citric acid). The molar ratio of total metallic cations to citric acid was 1:1. The resulting mixture was stirred and heated to 80 °C in a water bath until a viscous gel was obtained. The gel was heated up to 350 °C when the autocombustion was clearly observed. The resulting powder was finally sintered at 450 °C for 5 h.
2.4 Nanocomposites' preparation (ZFT and TZF)
Nanocomposite materials with the 10ZnFe2O490TiO2 (wt %) composition were prepared in two steps, alternating the order of the component addition during the synthesis protocol, as described in the synthesis flowchart shown in Fig. 1. Thus, to obtain the ZFT composite material, zinc ferrite was synthesized in the presence of titania (preprepared TiO2 was added in the nitrate solution and the mixture was further treated according to the ZF preparation protocol), whereas for the TZF sample the titania was prepared in the presence of the zinc ferrite by adding the ferrite to the Pluronic F-127 solution and following further the T obtaining procedure.
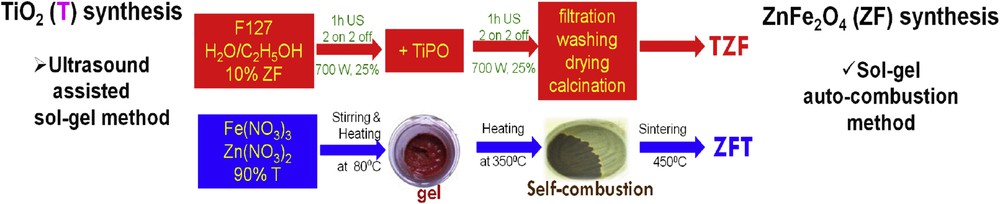
Flowchart of the nanocomposites' preparation.
2.5 Material characterization
The structural order of the samples was evaluated by recording the X-ray diffraction (XRD) patterns with a Bruker-AXS D8 Advance powder diffraction system equipped with a transmission-type goniometer, using Cu Kα radiation (λ = 1.5406 Å). The powder samples were scanned from 10 to 80° (2θ) using a scanning step of 0.02°/s.
The morphology and composition of the samples were studied by means of transmission electron microscopy (TEM) and energy dispersive X-ray (EDX) on a Hitachi HT7700 microscope equipped with a Bruker XFlash 6 EDS detector operated at 120 kV in high contrast mode. The microscopic samples were prepared by dispersing the powders in ethanol using an ultrasound bath and then placing a small drop on the TEM grid. Finally, the solvent was evaporated at 50 °C in vacuum for 24 h before the measurements.
The particle size distribution and average particle sizes were determined by small-angle X-ray scattering (SAXS). SAXS measurements were performed on a Bruker-Nanostar U instrument equipped with a 3-pinhole collimation optics. This system provides a precisely parallel X-ray beam with virtually no background and high intensity, leading to short measuring times and very high resolution. The scattering intensity was measured as a function of scattering vector q = (4π/λ)sinθ, where θ is half the scattering angle and λ is the X-ray wavelength (Cu Kα = 1.54 Å).
The textural properties of the powder were studied by nitrogen sorption on a Quantachrome Nova 2200 automated gas adsorption system using nitrogen adsorbate at −196 °C. Before analysis, all samples were outgassed for 2 h at 25 °C. The Brunauer–Emmett–Teller (BET) equation was used to calculate the specific surface area, whereas the total pore volume was estimated at P/P0 = 0.95 and the pore size distributions (PSDs) were evaluated from the desorption branch of the nitrogen isotherm using the Barrett–Joyner–Halenda equation.
To study the light absorption properties of the materials, the UV–vis DR (UV–vis diffuse reflectance) spectra were registered with a powder Shimadzu UV-2450 spectrophotometer, using MgO as a reference. As we previously showed, the Kubelka–Munk function (F(R) =(1 − R)2/2R = k/s = Ac/s), where R is the reflectance, k is the absorption coefficient, s is the scattering coefficient, c is the concentration of the absorbing species, and A is the absorbance gives the relationship between the absorption coefficient and the DR [20]. The Tauc plots obtained from DR spectra with the Kubelka–Munk relation provide information about the band gap energy, by plotting the direct and indirect transitions. The indirect band gap energy value (Eg) is obtained by extrapolating the linear part of the graphics to the abscissa.
2.6 Photocatalytic tests
The photocatalytic activity of the ZFT and TZF nanocomposites, and ZF and T pure components was evaluated by photodegradation of Rhodamine 6G under visible light irradiation. The photodegradation tests were performed into a cylindrical photoreactor equipped with a mercury medium pressure lamp TQ 150 Z1 with additional radiation intensity of 400–450 nm, positioned in the reactor center, and used for the visible light photoreaction. The measured photon flux value in the reactor at the experimental conditions was 190 mW/cm2. The lamp was surrounded by a circulating water jacket and thus the temperature reaction was kept constant. In a typical experiment, the reaction suspension was prepared by adding 0.250 g of photocatalyst into a 0.3 L Rhodamine 6G solution with an initial concentration of 50 mg/L. The as-obtained suspension was magnetically stirred, in the dark, for 30 min to attain the adsorption–desorption equilibrium, and then the solution was exposed to visible light. The stirring was maintained to keep the mixture in suspension during photodegradation experiments. At regular time intervals (0, 5, 10, 15, and 20 min), analytical samples were collected from the reaction mixture to investigate the variation in the dye concentration. The Rhodamine 6G concentration was monitored with a Shimadzu 2401 UV–vis spectrophotometer, by measuring the absorbance at 526 nm of the filtered solutions.
3 Results and discussion
3.1 Structural characterization
Several characterization techniques were used for the physicochemical characterization of the studied nanocomposites (ZFT and TZF). Also, the single-component materials (ZF and T) were fully characterized for comparison purposes.
XRD patterns of individual components and nanocomposite materials are compared in Fig. 2. Crystalline structures, characterized by sharp peaks, for all studied materials are observed. Careful analysis of the individual compound patterns (T and ZF) reveals that each of the observed peaks closely corresponds to the standard patterns for the titania and zinc spinel ferrite, respectively. Thereby, the exclusive presence of (1 0 1), (0 0 4), (2 0 0), (1 0 5), and (2 1 1) crystal planes in the T sample pattern indicates the formation of the pure anatase structure (according to JCPDS 84-1286) [20,21]. Similarly, in the ZF pattern only the presence of (2 2 0), (3 1 1), (4 0 0), (4 2 2), (5 1 1), and (4 4 0) diffraction planes characteristic for pure cubic zinc ferrite structure (according to JCPDS 22-1012) [7,22] is noticed. The XRD patterns of ZFT and TZF nanocomposites are practically identical whatever the adopted synthesis strategy and represent the sum of the patterns of the individual components, considering their respective proportion in the final materials (i.e., TiO2–ZnFe2O4 = 9:1). This could indicate that the synthesis of titania–spinel ferrite nanocomposites by a two-step procedure, whatever the starting compound was, hinders the dissolution of the Ti cations into spinel matrix, contrary to the literature reports dealing with the synthesis via one-pot protocols [17].

XRD patterns of nanocomposites (ZFT, TZF) and individual components (T, ZF).
Fig. 3a–d shows representative TEM micrographs of T, ZFT, TZF, and ZF samples, whereas Fig. 3e and f shows the EDX spectra identifying the cations in the nanocomposite particles. The TEM images reveal the formation of (quasi)spherical particles and homogeneous nanostructures. Moreover, for all studied materials, no phase segregation is observed and the presence of nanosized particles with a low degree of aggregation is noticed. In addition, the EDX analysis of the nanocomposites was performed on relatively small surfaces (around 0.1 μm2). The EDX spectra prove the presence of all the chemical elements on the studied surfaces.
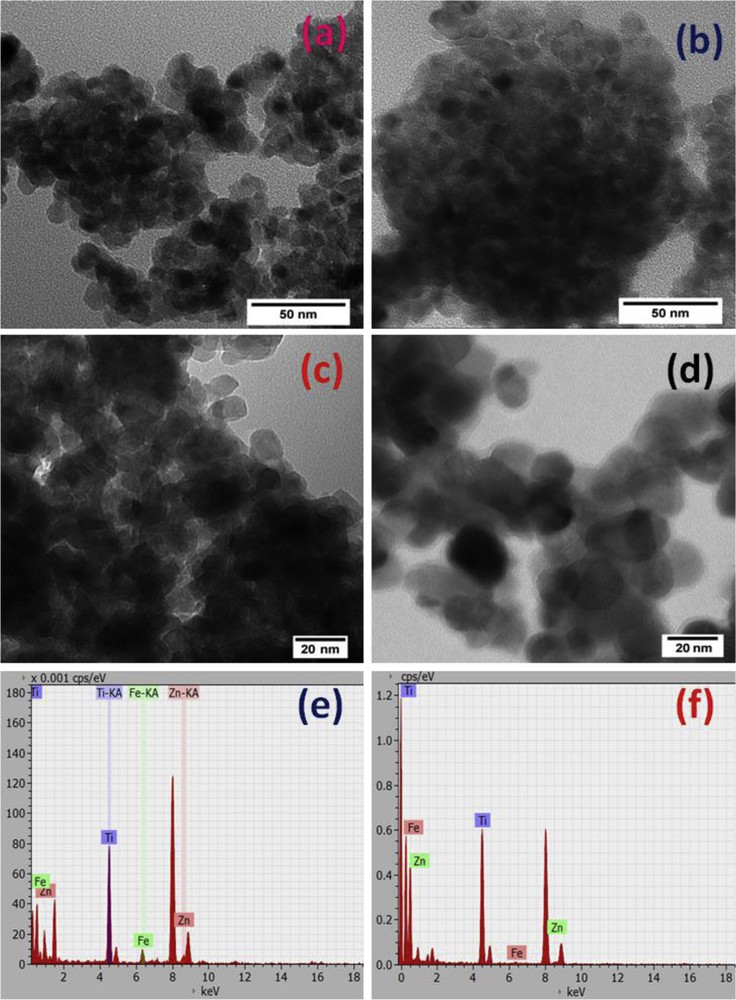
Representative TEM micrographs for nanocomposites and individual components: (a) T, (b) ZFT, (c) TZF, and (d) ZF; EDX spectra for nanocomposites: (e) ZFT and (f) TZF.
The SAXS analysis was used to determine the average particle size and particle size distribution. The main advantage over the electron microscopy techniques is the higher statistical quality for size distribution evaluation [23]. This is explained by the lack of particle aggregation in dispersion, which often occurs in the case of magnetic materials when preparing the sample for TEM analysis [23]. In Fig. 4a, the intensities of the scattering patterns (I, au) versus the scattering vector modulus q (Å−1) are plotted. Typical SAXS patterns are observed for pure titania [24] and zinc ferrite [25], respectively. As expected, the shape of the SAXS profile of the ZF sample is steeper compared to the T sample profile, indicating some aggregation of the spinel ferrite nanoparticles because of their magnetic properties [26]. Concerning the ZFT and TZF nanocomposite patterns, it is clear that the contributions of both ZF and T profiles are observed. Obviously, the starting component for the synthesis of nanocomposites strongly influences the corresponding SAXS pattern shape. Therefore, for the composite material obtained using presynthesized TiO2, the ZFT sample, the SAXS profile is slightly narrower compared with pure titania, but larger than those observed for TZF and ZF. Thus, doping titania with magnetic spinel ferrite leads to a relatively poor aggregation of the nanoparticles. Note that, the aggregation is more evident when titania is obtained in the presence of zinc ferrite.
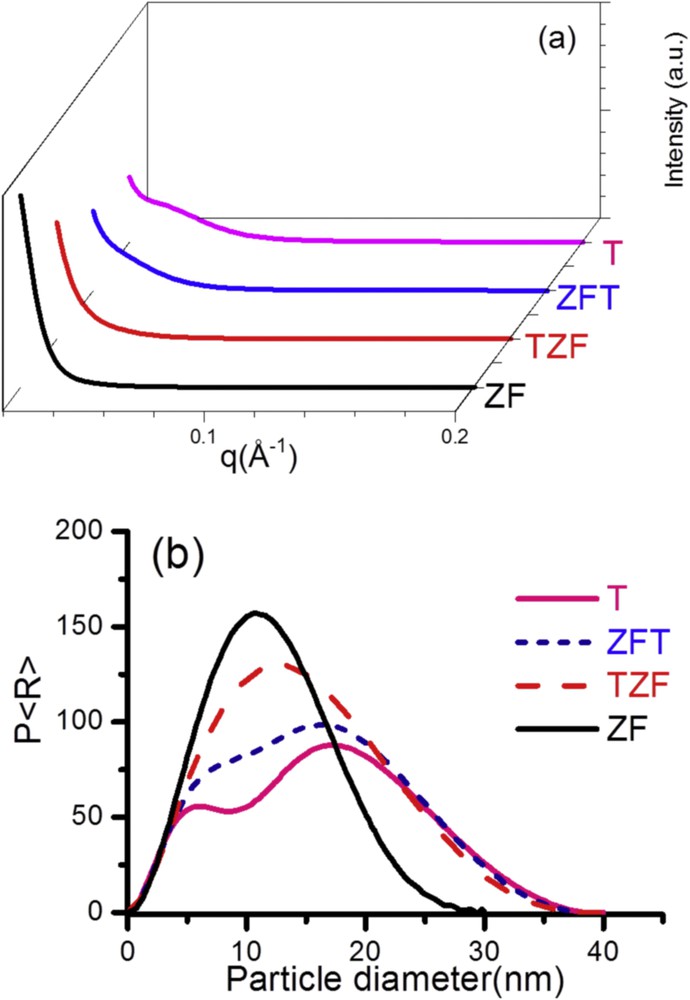
(a) SAXS patterns and (b) particle size distributions for nanocomposites (ZFT, TZF) and individual components (T, ZF).
The particle size distribution and the particle average size were extracted from SAXS data using ATSAS software package [27]. Thus, a comparison of the particle size distributions of the four studied materials is summarized in Fig. 4b, and the average particle diameters (D, nm) are listed in Table 1. As observed from the SAXS pattern, the particle size distribution profiles of the nanocomposites are sensitive to the adopted synthesis strategy. Therefore, the grain size distribution profile of the ZFT sample is very similar to that observed for pure titania, presenting maximum around 16 nm and an evident shoulder at about 7 nm. In contrast to this profile, the ZF sample and TZF nanocomposite synthesized in the presence of the spinel show only one maximum around 10 and 13 nm, respectively. The resulting particle average size (Table 1) is ranging from 9.2 nm, for ZF sample, to 13.1 nm, for titania. The studied nanocomposites show intermediate values between those observed for single components (12.5 nm for ZFT and 11.7 nm for TZF, respectively). Therefore, preparing titania in the presence of zinc ferrite leads to a slight increase in the particle size, contrary to the preparation of zinc ferrite in the presence of TiO2. The smaller size of the TZF materials compared with pure titania is surprising and could be explained by the grinding phenomena, which occur because of the high energy released during the zinc ferrite preparation by the autocombustion.
Average particle size, textural, optical, and photocatalytic properties of the nanocomposites (ZFT, TZF) and individual components (T, ZF).
| Technique | SAXS | N2 sorption isotherms | UV-DR | Photocatalytic efficiency | |||
| Sample | D (nm) | SBET (m2 g−1) | Vt (cm3 g−1) | dpore (nm) | Band gap (eV) | 5 min (%) | 10 min (%) |
| T | 13.06 | 109 | 0.208 | 3.88 | 3.20 | 30.80 | 52.52 |
| ZFT | 12.47 | 76 | 0.171 | 3.85 | 1.65 | 41.19 | 71.73 |
| TZF | 11.69 | 92 | 0.192 | 3.86 | 1.60 | 75.74 | 97.87 |
| ZF | 9.25 | 35 | 0.313 | 10.75 | 1.40 | 1.34 | 1.38 |
The nitrogen sorption experiments were performed to further detail the structure of the synthesized particles. Nitrogen sorption isotherms and PSDs for all studied samples are presented in Fig. 5, and the determined values for BET specific surface area (SBET), total pore volume (Vt), and mean pore diameter (dpore) are listed in Table 1. In good agreement with previous works, all materials revealed type IV isotherm, which is characteristic for mesoporous structures [12,17,20,25]. However, the type of the hysteresis loop varies with the chemical composition of materials. Therefore, the materials containing TiO2 (T, ZFT, and TZF, respectively) display H4 hysteresis loops, typical for mesoporous materials with slit-shaped pores [20]. In contrast, the pure zinc ferrite show H1 hysteresis loop associated with porous materials formed from aggregated particles [12,28]. These results are in reasonable agreement with SAXS observations.
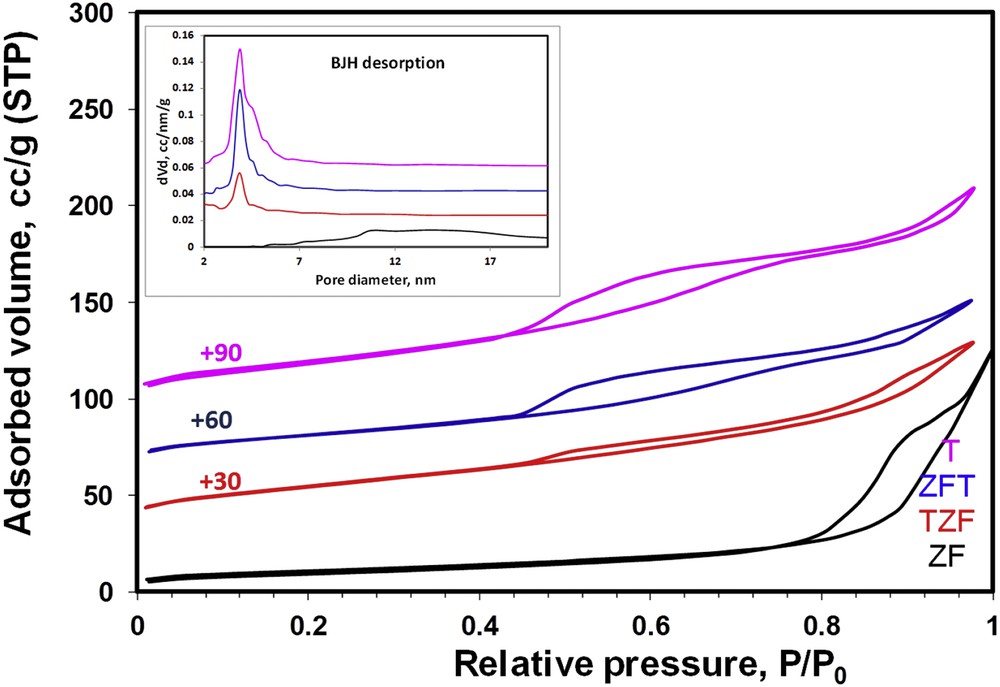
Nitrogen sorption isotherms and PSDs (insert) of nanocomposites (ZFT, TZF) and individual components (T, ZF). BJH, Barrett–Joyner–Halenda.
The calculated BET surface area (Table 1) of the pure titania is almost three times higher than the value observed for pure zinc ferrite (109 vs 35 m2 g−1). As expected, doping titania with 10% ferrite leads to a decrease in the specific surface area values. It is important to note that the BET value depends on the synthesis procedure. Thus, the specific surface area decrease is more severe (up to 76 m2 g−1) when the zinc ferrite is added to a presynthesized titania (ZFT sample) compared with 92 m2 g−1 obtained for preparing the TiO2 in the presence of the ferrite (TZF sample), whereas the mean pore diameter values decrease only slightly from 3.88 nm for the titania to 3.85 nm for ZFT and 3.86 nm for TZF. The total pore volume is ranging from 0.171 to 0.313 cm3 g−1 and increases with the mean pore diameter.
To find the optical gap, the Tauc plots were drawn based on computed UV–vis DR spectra using the Kubelka–Munk relation [20] (Fig. 6). For a better interpretation of the experimental data the resulted indirect band gap values are listed in Table 1. The band gap values obtained for T and ZF samples (3.2 and 1.4 eV, respectively) are in good agreement with the literature [12,20,29]. Doping the anatase form of TiO2 with zinc ferrite dramatically decreases the band gap value (1.6 eV for TZF and 1.65 eV for ZFT). The result is extremely useful for the use of the titania–zinc ferrite nanocomposites in photodegradation procedures of many harmful organic pollutants under visible light.
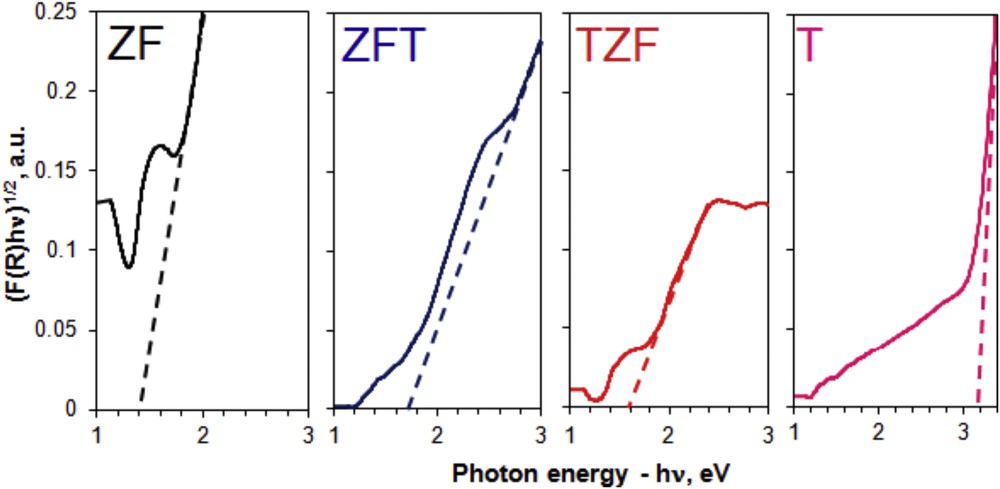
Tauc plots for indirect band gaps of nanocomposites (ZFT, TZF) and individual components (T, ZF).
3.2 Photocatalytic tests
The photocatalytic activities of the studied materials were examined by the photodegradation of Rhodamine 6G in an aqueous solution under visible light irradiation. Fig. 7 shows the variation in Rhodamine 6G concentration during photodegradation reaction in the presence of the studied catalysts, under visible light, as a function of time, whereas the respective photocatalytic efficiencies, at different reaction times (5 and 10 min, respectively), are listed in Table 1. On the one hand, no color removal owing to adsorption processes could be noticed for the pure zinc ferrite and the studied nanocomposites (ZF, TZF, and ZFT samples). In contrast, TiO2 seems to be able to degrade organic pollutant molecules but in relatively low amounts (about 10%). On the other hand, one can observe that pure titania is highly more active than the zinc ferrite. Therefore, the T photocatalyst completely degraded the organic dye after 20 min of reaction, whereas the ZF material started to degrade the pollutant only after 30 min (see Fig. 7 insert). Finally, doping the TiO2 with 10% of zinc ferrite undoubtedly improves the photocatalytic behavior under visible light, independently of the synthesis procedure, indicating a synergetic effect between the two components. Nevertheless, the preparation of the TiO2 in the presence of the doping compound (TZF sample) leads to superior performances, with a color removal efficiency of 97.87% after only 10 min of reaction. For comparison, the efficiencies of the ZFT and T materials are only 71.73 and 52.52% respectively, whereas the zinc ferrite alone is not active yet. These results are not surprising and are easily explained by better characteristics of the TZF sample compared with ZFT: narrower band gap, higher BET specific surface area, and smaller average particle size.
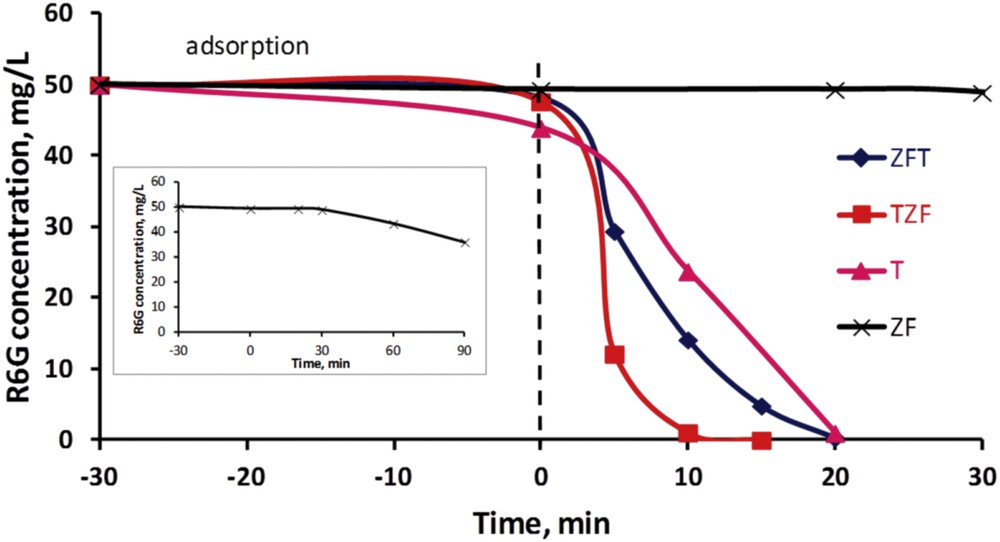
Color removal during photodegradation of Rhodamine 6G under visible light vs time in the presence of nanocomposites (ZFT, TZF) and individual components (T, ZF), and Rhodamine 6G concentration after 90 min of photodegradation in the presence of ZF (insert).
4 Conclusions
This article reports a study over the influence of the synthesis strategy on the structure, morphology, and photocatalytic properties of nanocomposites based on TiO2 doped with zinc ferrite.
From XRD patterns and TEM and EDX analysis the successful formation of ferrite–titania nanocomposites via two-step synthesis method was confirmed. SAXS results on the nanocomposites revealed that the average particle size and particle size distribution depend on the synthesis pathway. Titania band gap value is positively influenced by doping with spinel ferrite, recommending such nanocomposites as interesting photocatalysts for degradation of organic compounds under visible light. Whatever the synthesis strategy was adopted the photocatalytic performance of the TiO2 was improved by doping with zinc ferrite. Nevertheless, synthesizing the titania in the presence of a preobtained zinc ferrite leads to superior characteristics in terms of band gap value, specific surface area, and grain sizes, crucial for the enhancement of the photocatalytic performances.
Acknowledgments
This work was supported by a grant from the Romanian National Authority for Scientific Research and Innovation, CNCS – UEFISCDI, project number PN-II-RU-TE-2014-4-1266 and the Project No. 71 from the IUCN order no. 96/15.02.2016, theme no. 04-4-1121-2015/2017, respectively.