

1 Introduction
In recent years, there has been an increasing interest in the syntheses of functional metal complexes having catalytic [1,2] and magnetic [3,4] properties or biological activities [5,6]. These complexes can be formed by using various multidentate ligands. Although less attention has been paid to Ni(II) complexes, they have various applications such as antibacterial activity, CC and CS cross-coupling, double-bond functionalization, and CO2 reduction reaction [7,8]. Herein, we report synthesis of a novel Ni(II) complex, using histidine (2-amino-3-(1H-imidazol-4-yl) propanoic acid) as the chelating agent. Histidine is an α-amino acid with an imidazole functional group, first isolated by German physician Albrecht Kossel [9]. The conjugate acid (protonated form) of the imidazole side chain in histidine has a pKa of approximately 6.0. For pH less than 6, the imidazole ring is mostly protonated [10], and the imidazole ring bears two NH bonds and has a positive charge. The positive charge is equally distributed between the two nitrogen atoms and can be represented with two equally important resonant structures. The imidazole ring of histidine is aromatic at all pH values [11]. It can have π stacking interactions [12], complicated by the positive charge [13]. The title compound was synthesized using the solvothermal method [14]. Solvothermal processes, using low or medium temperatures, can be considered as alternatives to the high temperature methods based in particular on melt growth or vapor growth processes. Furthermore, theoretical calculation can be used for structural elucidation [15–17]. In the present work, we report the newly synthesized bis(histidinato)nickel(II) complex, followed by TD-DFT, quantum theory of atoms in molecules (QTAIM), and reduced density gradient calculations.
2 Experimental section
2.1 Materials
All chemicals were purchased from commercial sources and used as received.
Compound 1 was prepared from the mixture of NiCO3·xH2O (0.375 mmol), histidine (0.75 mmol), 4,4′-bipyridine (0.375 mmol), and methanol/H2O (2 mL with a ratio of 10:1). The suspension was stirred for 15 min and then transferred to a 23 mL Teflon-lined stainless steel autoclave followed by heating at 150 °C for 48 h. After slow cooling to room temperature, the product was filtered, washed with methanol, and dried in air. Elemental analysis calcd (%) for NiC12H16N6O4 + 1 H2O: C, 37.44%; H, 4.71%; N, 21.83%; O, 20.87%; found: C, 37.40%; H, 4.75%; N, 21.78%; O, 20.90%.
2.2 Crystal structure determination and refinement
The data were collected on Marresearch 345 dtb diffractometer using Mo Kα radiation (λ = 0.71073 Å) at 295 K. The structure was solved by direct methods using SHELXS-97 and the obtained model refined with SHELXL-97 [18]. All non-hydrogen atoms were refined anisotropically. Hydrogen atoms were added at ideal positions and refined using a riding model. The data were deposited in Cambridge Crystallographic Data Centre, with deposition number CCDC-979056. The Oak Ridge thermal ellipsoid plot (ORTEP) view of 1 and its selected crystallographic and experimental details are summarized in Fig. 1 and Table 1, respectively.
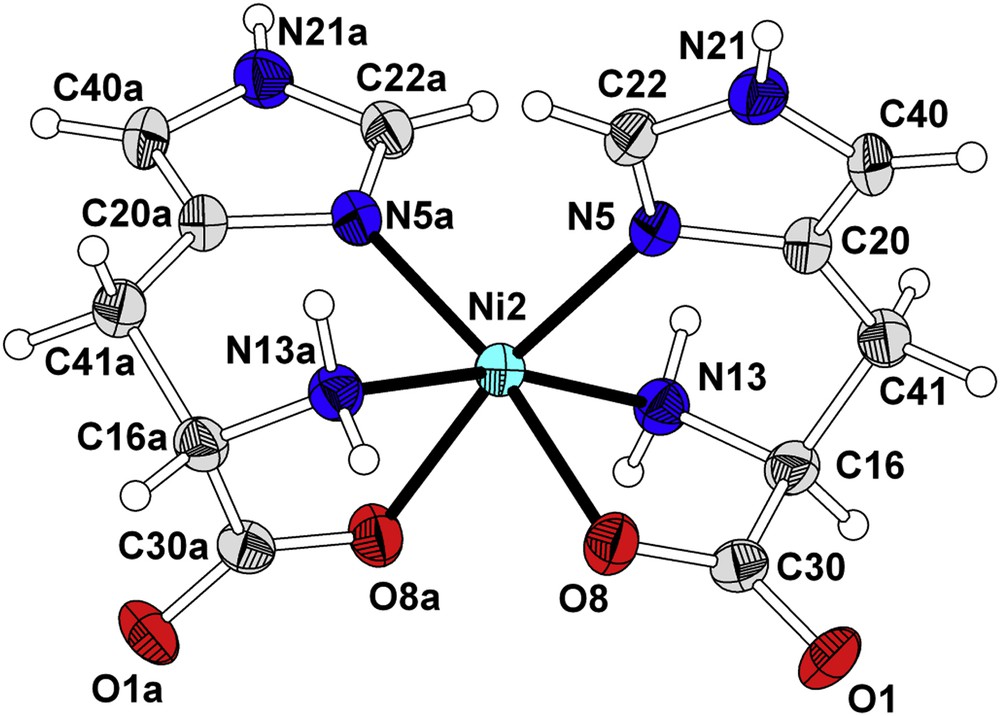
ORTEP diagram of 1. Thermal ellipsoids are drawn at the 50% probability level.
Crystal and structure refinement data for bis(histidinato)nickel(II) (1).
| Compound | 1 |
| Empirical formula | C12H16N6NiO4 |
| Molecular weight | 367.00 |
| Crystal system | Tetragonal |
| Space group | P43212 |
| Temperature (K) | 293(2) |
| a = b (Å) | 7.3157(10) |
| c (Å) | 28.870(6) |
| α = β = γ (°) | 90.00 |
| Cell volume (Å3) | 1545.1(4) |
| Z | 4 |
| ρ (g cm−3) | 1.578 |
| μ (mm−1) | 1.285 |
| Total reflections | 5255 |
| Unique reflections | 1465 |
| Observed reflections [F2 > 2σ(F2)] | 1292 |
| Data/restraints/parameters | 1465/0/121 |
| Goodness-of-fit on F2 | 1.068 |
| R [F2 > 2σ(F2)] (R1, wR2) | 0.0719, 0.1611 |
| R (all data) (R1, wR2) | 0.0830, 0.1735 |
2.3 Thermal gravimetric analysis
The thermal properties of 1 were studied by Thermogravimetric analysis/Differential thermal analysis (TGA/DTA) in the temperature range 30–600 °C (Fig. 2). It showed that the complex is stable until 355 °C and starts to decompose at about 371 °C. The thermogram exhibits two distinct weight losses at 141 and 390 °C. The first weight loss at 141 °C could be ascribed to the loss of surface water. The second weight loss at 390 °C indicates loss of histidine ligands and decomposition of the complex.
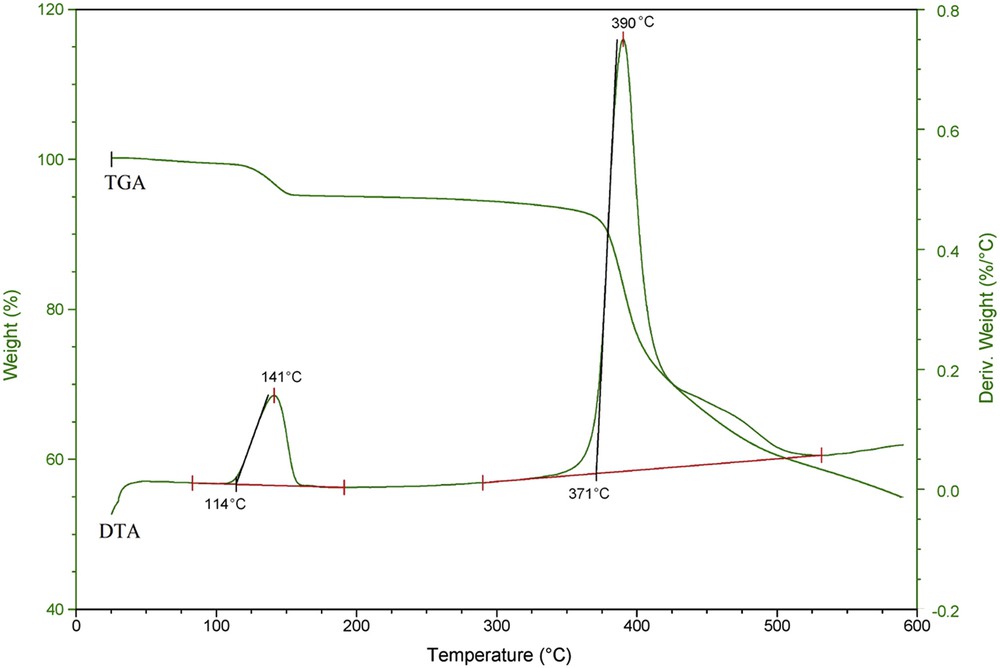
TGA/DTA characterization.
3 Computational details
To get insight into the electronic structure of 1, density functional calculations were carried out with the ORCA 3.0.3 program [19]. We used the PBE0 functional and the def2-TZVP (triple zeta valence polarized) basis sets to optimize the geometries in the gas phase and pyridine using the COnductor-like Screening MOdel (COSMO) solvation model [19]. Vibrational frequency calculations were carried on the optimized structures in solvent and gas phase, to confirm that both structures were minima. The electronic structure of the title compound was investigated by QTAIM and by reduced density gradient analysis using Multiwfn 3.7 program [20].
4 Results and discussion
4.1 Molecular structure
Geometry optimization was started from the single crystal X-ray experimental atomic positions and the optimized geometric parameters (bond distances and bond angles) are given in Table 2. All of the bond lengths are slightly overestimated compared with the experimental values. By comparing the bond lengths, maximum deviations of 0.052 and 0.010 Å for Ni2O8 were found for the optimized structure in the gas phase and pyridine, respectively. All bond lengths are in good agreement with their corresponding values from X-ray structural analysis, but the angles around central Ni(II) show rather high deviations. Maximum deviations of 11.35° and 6.08° for the O8aNi2O8 angle, 6.61° and 1.12° for N13aNi2N5, and 9.59° and 2.83° for N13aNi2N13 were obtained for the optimized structure in the gas phase and pyridine, respectively. Further investigations revealed that this deviation originated from two sets of weak and moderate O⋯H intramolecular and intermolecular interactions present in the gas and solid phases, respectively. The presence of two intramolecular NH⋯O weak interactions in the gas phase is responsible for increasing the N13aNi2N5 angle and decreasing the N13aNi2N13 angle (Fig. 3). These interactions do not exist in the solid phase because of the participation of respected oxygen atoms in a stronger intermolecular hydrogen bond with neighboring molecules. By optimization of the structure in pyridine solvent, the N13aNi2N5 and N13aNi2N13 angles get closer to the experimental values. However, the O8aNi2O8 angle still shows rather high deviations and we discuss the reasons for this discrepancy in the following sections.
Selected bond lengths and angles around central nickel atom in 1.
| Experimental | Optimized (gas) | Optimized (pyridine) | |
| Bonda (Å) | |||
| Ni2O8 | 2.060 | 2.026 | 2.070 |
| Ni2N5 | 2.099 | 2.151 | 2.109 |
| Ni2N13 | 2.095 | 2.115 | 2.104 |
| Angle (degree) | |||
| O8aNi2O8 | 83.97 | 95.32 | 90.05 |
| N13Ni2O8 | 80.76 | 79.89 | 79.34 |
| N5Ni2O8 | 87.28 | 86.17 | 87.63 |
| N13Ni2N5 | 86.32 | 87.09 | 87.68 |
| N13aNi2N5 | 103.17 | 107.79 | 104.29 |
| N13aNi2N13 | 165.24 | 155.65 | 162.41 |
a Because of P43212 space group contrary bonds are equivalent.

The presence of two intramolecular weak interactions in the gas phase, which do not exist in solid phase.
4.2 Hirshfeld surfaces
To gain further insight into the intermolecular interactions of molecular crystals, Hirshfeld surface [21–23] and the related two-dimensional (2D)-fingerprint plot [24–26] were calculated using the Crystal Explorer program [27]. Hirshfeld surface analysis reveals that the dominant interactions in the solid phase are two sets of bifurcated intermolecular NH⋯O and CH⋯O bonds between imidazole ring from four of the neighboring molecules and carboxyl groups of 1 (Fig. 4). The related data of these hydrogen bonds are summarized in Table 3. The presence of these hydrogen bonds has two effects on the solid phase geometry: the intramolecular NH⋯O weak interactions disappear and the O8aNi2O8 angle becomes 83.97°.
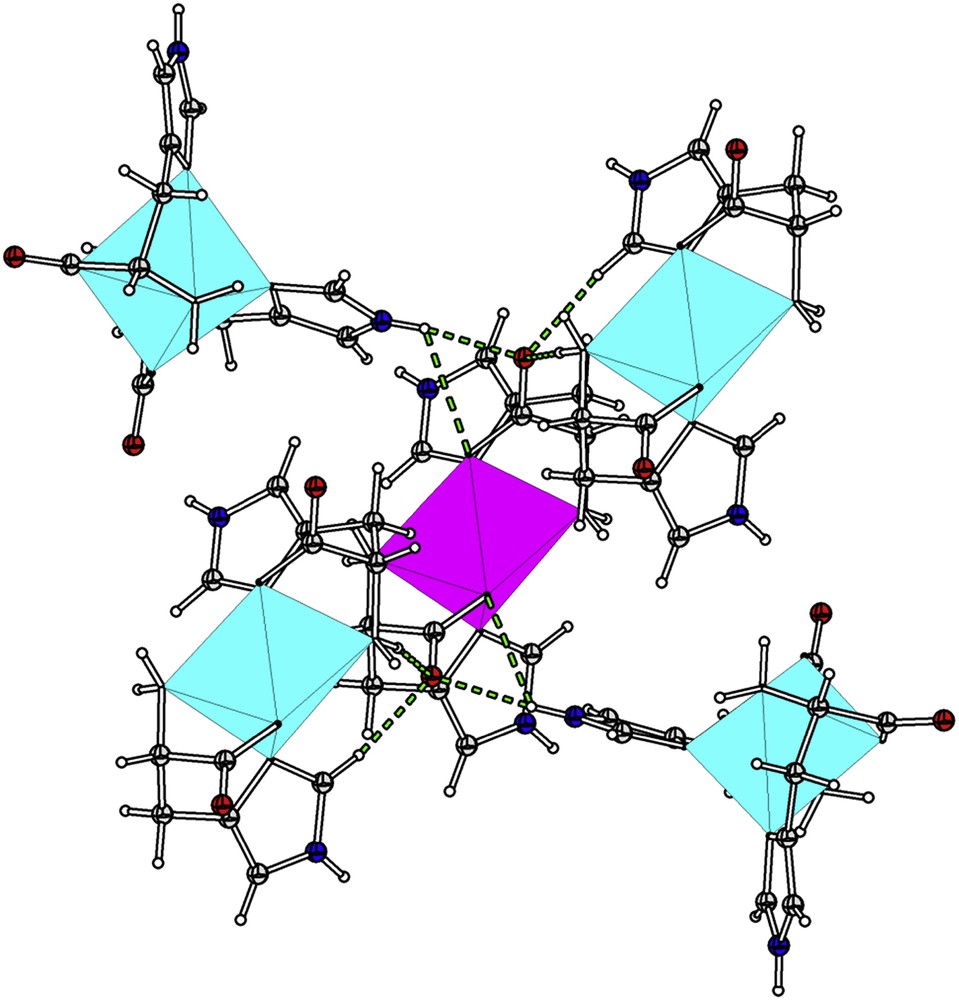
The presence of two sets of bifurcated intermolecular NH⋯O and CH⋯O bonds between imidazole ring from four of the neighboring molecules and carboxyl groups of 1.
Hydrogen bonds specifications in the molecular crystal.
| H⋯A (Å) | D⋯A (Å) | D–H⋯A (degree) | |
| N21bH⋯O1 | 1.994 | 2.845 | 169.50 |
| N21bH⋯O8 | 2.596 | 3.062 | 115.09 |
| N13bH⋯O1 | 2.284 | 3.171 | 167.41 |
| C22cH⋯O1 | 2.125 | 3.043 | 169.14 |
The Hirshfeld surfaces were mapped with dnorm for 1 and the corresponding fingerprint plots are shown in Fig. 5. The dominant interaction in the molecular crystal is O⋯H and can be seen in the Hirshfeld surface as bright red areas. Two-dimensional fingerprint plots complement these surfaces, quantitatively summarizing the nature and type of intermolecular contacts experienced by molecules in the crystal. The O⋯H/H⋯O intermolecular interactions appear as distinct spikes in the 2D plot. The fingerprint plots can highlight atom pair close contacts and enable one to separate different interaction types, which overlap in the full fingerprint. The sum of O⋯H/H⋯O interactions comprises 36.5% of the Hirshfeld surfaces. Furthermore, Hirshfeld surfaces show no sign of the presence of the intramolecular NH⋯O weak interactions in the solid phase, although it is present in the gas phase.
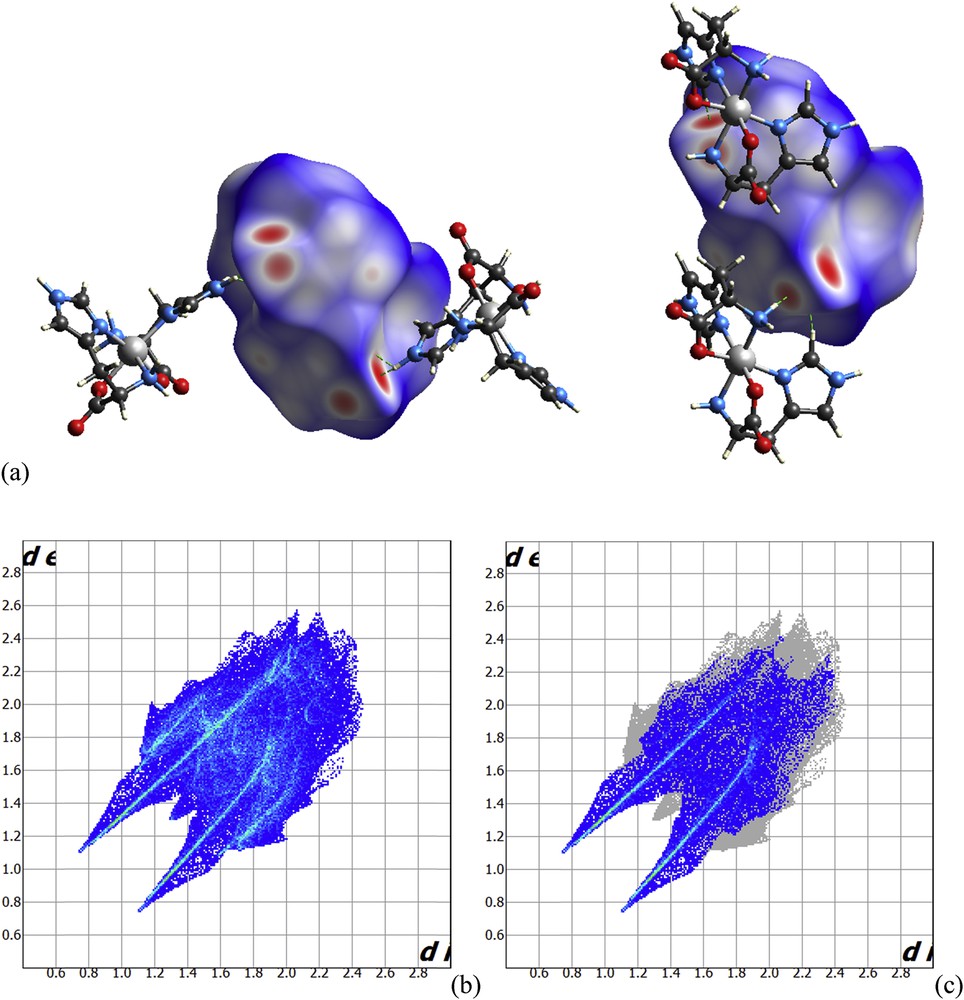
Hirshfeld surfaces mapped with dnorm for 1. (a) Fingerprint plots, (b) hole, and (c) O⋯H/H⋯O highlighted.
4.3 QTAIM and reduced density gradient
The QTAIM approach proposed by Bader is the most refined method for the analysis of the topology of the electron density, which is repeatedly used for revealing and enlightening the bonding situation between the atoms [28,29]. Here, we used this method to gain insight into binding characteristics and to confirm the presence of NH⋯O weak interactions in the gas phase structure. The data are shown in Table 4. Although QTAIM shows no critical point for the intramolecular NH⋯O weak interactions in the gas phase, the delocalization index for this bond in the gas phase shows some degree of electron sharing for a weak interaction between hydrogen and nitrogen. The delocalization index values in the gas phase are twice those in the solvent (Table 5), which confirms the presence of a weak interaction in the gas phase. Recently, it has been suggested that for weak intramolecular hydrogen bonds, the QTAIM analysis may show no bond critical points [30], and in these cases one might use the reduced density gradient analysis [31]. This analysis confirmed the presence of intramolecular NH⋯O weak interactions in the gas phase. Gradient isosurfaces for the NH⋯O weak interaction are shown in Fig. 6. The isosurface represents the weak interaction area clearly, although this interaction is categorized as weak. Repeating this analysis on the solvent-optimized structure revealed that such interaction is not present in solvent.
Bond critical point electron densities (ρ), their Laplacian (∇2ρ), and ellipticities (ɛ).
| ρ | ∇2ρ | ɛ | |
| Bond(pyridine solvent) | |||
| Ni2O8 | 0.063 | 0.309 | 0.015 |
| Ni2N13 | 0.070 | 0.294 | 0.072 |
| Ni2N5 | 0.066 | 0.303 | 0.037 |
| O8C30 | 0.362 | −0.554 | 0.091 |
| C30C16 | 0.251 | −0.647 | 0.096 |
| C16N13 | 0.255 | −0.627 | 0.029 |
| C16C41 | 0.245 | −0.610 | 0.025 |
| C30O1 | 0.392 | −0.406 | 0.104 |
| C41C20 | 0.259 | −0.687 | 0.058 |
| C20N5 | 0.311 | −0.907 | 0.169 |
| C20C40 | 0.331 | −0.965 | 0.359 |
| C22N5 | 0.360 | −1.117 | 0.290 |
| C22N21 | 0.329 | −0.885 | 0.263 |
| C40N21 | 0.305 | −0.756 | 0.199 |
| Bond(gas phase) | |||
| Ni2O8 | 0.071 | 0.346 | 0.005 |
| Ni2N13 | 0.069 | 0.288 | 0.090 |
| Ni2N5 | 0.061 | 0.283 | 0.050 |
| O8C30 | 0.356 | −0.577 | 0.101 |
| C30C16 | 0.244 | −0.610 | 0.095 |
| C16N13 | 0.254 | −0.623 | 0.030 |
| C16C41 | 0.246 | −0.616 | 0.031 |
| C30O1 | 0.406 | −0.311 | 0.130 |
| C41C20 | 0.259 | −0.689 | 0.050 |
| C20N5 | 0.311 | −0.912 | 0.158 |
| C20C40 | 0.331 | −0.971 | 0.358 |
| C22N5 | 0.365 | −1.200 | 0.302 |
| C22N21 | 0.323 | −0.854 | 0.264 |
| C40N21 | 0.301 | −0.725 | 0.209 |
Calculated delocalization index for intermolecular hydrogen bonds.
| Bond | δ(A⋯B)Gas phase | δ(A⋯B)Pyridine |
| N13aH⋯O8 | 0.0217 | 0.0117 |
| N13H⋯O8a | 0.0217 | 0.0117 |
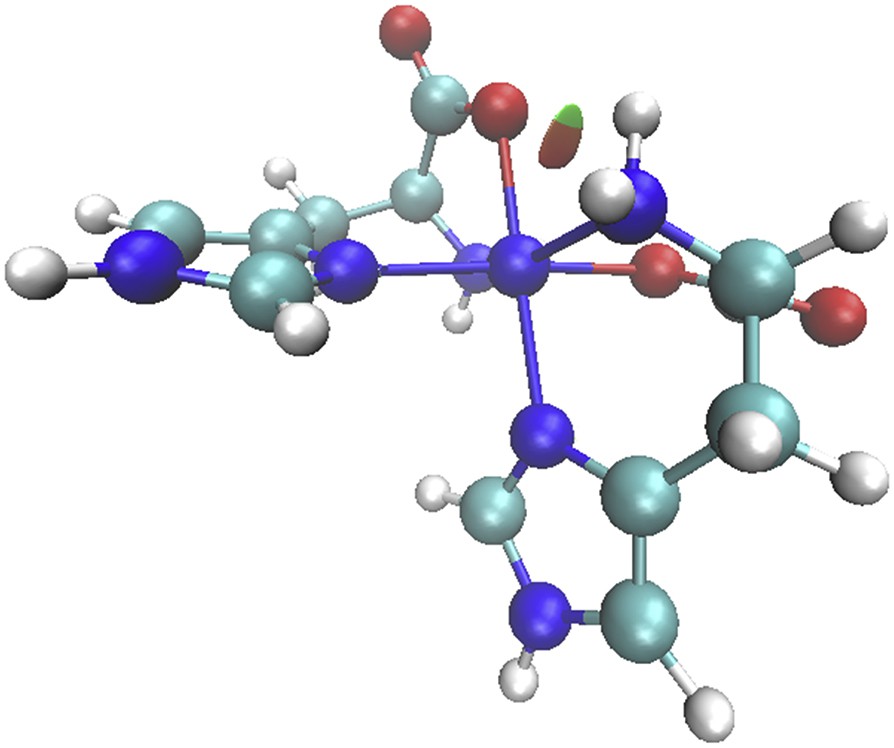
Gradient isosurfaces (s = 0.35) showing weak intramolecular interaction present in the gas phase.
4.4 Spectroscopic studies
Because of insolubility of the titled compound in common solvents, solid state ultraviolet–visible (UV–vis) spectrum was recorded in the 200–700 nm range, and the electronic absorption spectrum was calculated using the gas phase and pyridine optimized geometries with TD-DFT method. We used the B3P86 functional and the def2-TZVP basis sets with C2 symmetry. The same calculations were carried out using the solid-state geometry without optimization (see Fig. 7).
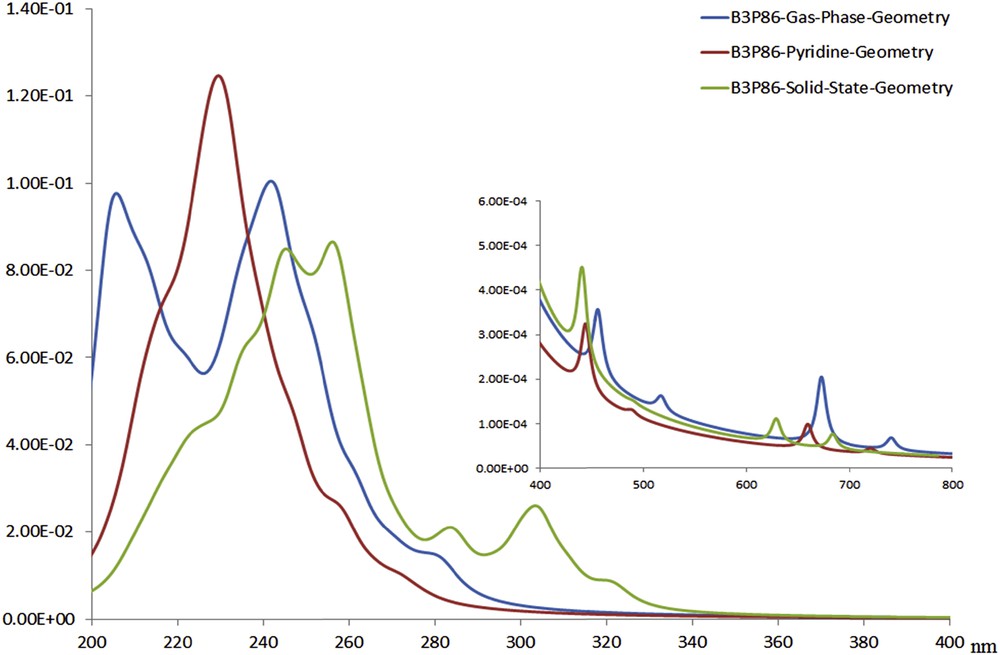
Calculated electronic absorption spectra using the gas phase, pyridine, and solid-state geometries with TD-DFT method using B3P86 functional.
The calculated electronic absorption spectra of 1 in the solid and gas phases and pyridine together with solid state UV–vis spectrum reveal that different distortions from octahedral geometry in the gas phase, pyridine, and the solid phase for 1 result in different electronic absorption spectrum in each phase. Calculation of electronic absorption spectra using solid-state geometry without optimization results in a spectrum, which is in good agreement with experimental data (Fig. 8). Repeating the same calculations with PBE0 functional gives similar result as B3P86.
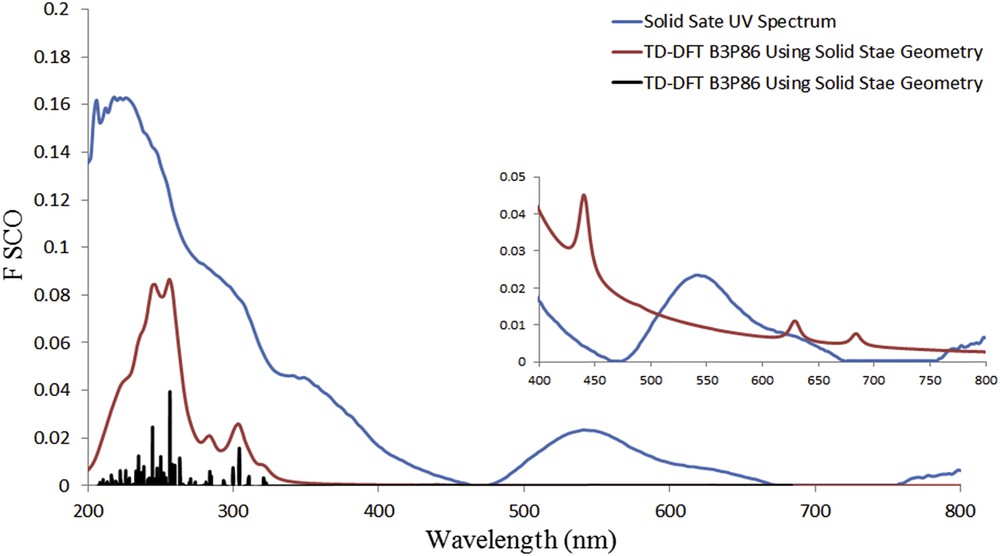
Solid-state UV–vis spectrum and calculated spectrum using B386 applying def2-TZVP basis set 200–800 nm.
Electronic absorption spectrum of 1 in solid state (Fig. 8) shows several bands roughly around 240, 290, 350, and 540 nm. By investigating the percentage weights of the molecular orbitals involved in electronic excitations, we found that in the band around 500–600 nm, there are contributions from three types of electronic excitations, that is, metal-to-ligand charge transfer, intraligand transitions, and metal d–d transitions. Furthermore, TD-DFT calculation results suggest that band around 500–580 mainly related to the transitions from HOMO-3 and HOMO-4 to LUMO, the band around 350 mainly related to the transitions from HOMO-12 and HOMO-11 to LUMO+1, and the band around 240 and 290 mainly related to the transition from HOMO and HOMO-1 to LUMO+2. The free histidine ligand has no absorption band at wavelength longer than 245 nm [32], which is consistent with our TD-DFT calculations on free ligand.
4.5 Frontier molecular orbitals
The frontier molecular orbitals (HOMO and LUMO) can determine molecular reactivity and its photophysical properties. The isodensity plots for the HOMOs and LUMOs orbitals are shown in Fig. 9. It can be seen that HOMO is mainly localized on the metal atom and on the 2-amino-propanoic acid part of the histidine ligand, whereas the LUMO is most on the imidazole ring and to a lesser extent on the metal. Because the first electron transfer occurs from the HOMO to LUMO, it can be inferred that the first low energy electronic transition is combined ligand to ligand charge transfer (LLCT) from organic moiety and d–d metal electron transition. By using HOMO and LUMO energy values for the molecule, electronegativity and chemical hardness and softness were estimated using well-known relations [33–36] and are reported in Table 6 along with the dipole moment of 1.
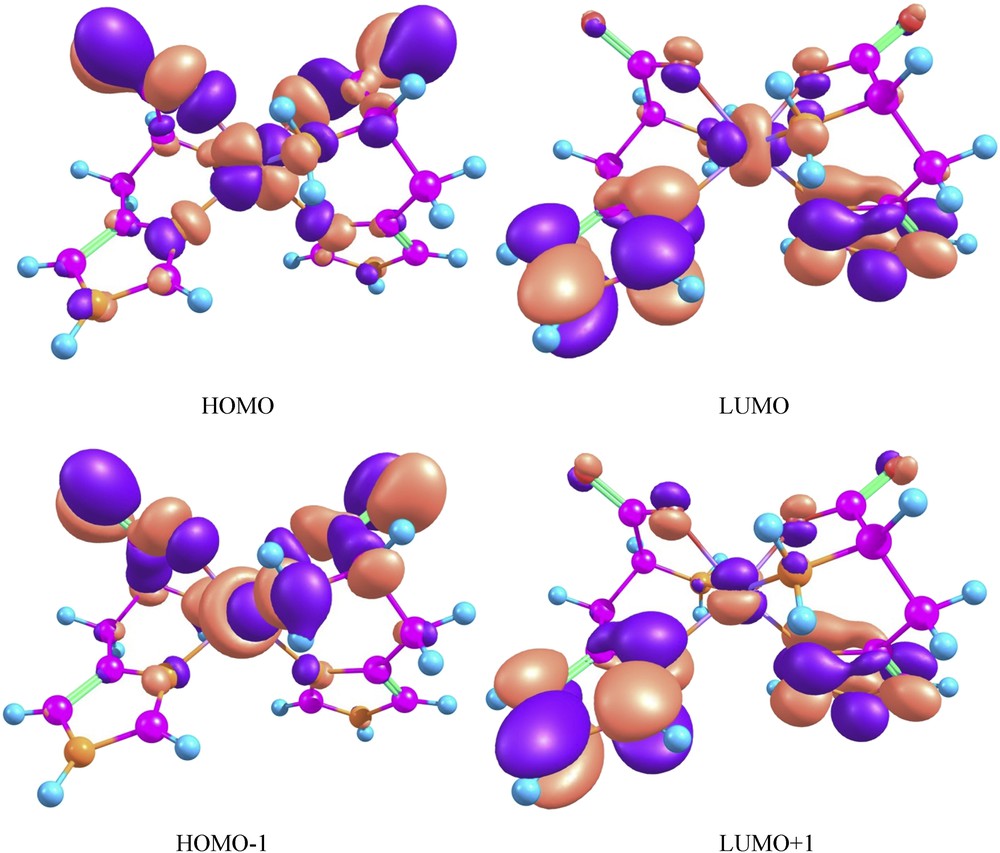
The isodensity plots for HOMOs and LUMOs.
Orbital energies, chemical hardness, chemical softness, electronegativity, and dipole moment of 1.
| PBE0/def2-TZVP | Gas phase (ɛ = 1) | Pyridine (ɛ = 12.5) | Water (ɛ = 80.40) |
| EHOMO (eV) | −4.85 | −5.26 | −5.30 |
| ELUMO (eV) | −0.70 | −0.22 | −0.15 |
| ΔEHOMO–LUMO | 4.14 | 5.04 | 5.14 |
| Chemical hardness (η) | 2.07 | 2.52 | 2.57 |
| Chemical softness (S) | 0.24 | 0.20 | 0.19 |
| Electronegativity (χ) | 2.78 | 2.74 | 2.73 |
| Dipole moment (Debye) | 16.0 | 23.3 | 24.6 |
5 Conclusions
A new bis(histidinato)nickel(II) has been synthesized, using solvothermal crystal growth. The resulting complex has distorted octahedral geometry. The title compound shows different octahedral distortions in the gas, liquid, and solid phases using geometry optimization in the gas phase and pyridine together with Hirshfeld surface and reduced density gradient analyses. This can be related to the presence of two weak intramolecular NH⋯O weak interactions in the gas phase and two sets of rather strong intermolecular NH⋯O and CH⋯O interactions in the solid phase. Although intramolecular NH⋯O weak interactions in the gas phase are not confirmed by QTAIM analysis, the reduced density gradient and delocalization indices approve this weak interaction. Furthermore, TD-DFT calculations suggest that these different distortions result in different electronic absorption spectrum in each phase.
Acknowledgments
The authors appreciate the University of Tehran for financial support.