

1 Introduction
Activated carbon is a versatile material with large surface area, adequate pore size distribution, good thermal stability, and various functional groups at the surface [1]. In the last decade, activated carbon received considerable attention due to its attractive characteristics that promote powerful utilization for a variety of applications such as adsorption [2], energy storage [3], electrochemical application (super capacitor) [4] and catalysis [5]. The preparation of activated carbon from cheap and readily available agricultural by-products (date stone [6], rice hulls [7], olive stone [8], grape seeds [9], cassava peel [10], etc.) has lured attention from economic and environmental aspects. Activated carbon can be prepared from carbonaceous precursors by different activation methods [11]. Basically they can be activated by chemical and physical methods. Typically, when performed by chemical methods, the raw material is mixed with active agents such as (H3PO4 [12] ZnCl2 [13] and KOH [14]) followed by heat treatment at temperatures between 400 °C and 900 °C, carbonization and activation being performed simultaneously. On the other hand, the physical procedure implies the pyrolysis of the raw material under N2 at a higher temperature (800–1000 °C), followed by activation under gas flow like CO2, water vapor or a mixture of them.
The palm tree, a plant cultivated in Tunisia, is rich in by-products but it is currently poorly valued. Interestingly, the date stone, leaves, wood and petioles may serve as precursors for the preparation of activated carbon. In the present study, we focused on the preparation of activated carbons from date palm petioles using physical activation with CO2 at different temperatures. The materials obtained were characterized by different techniques such as nitrogen sorption, scanning electron microscopy and thermal analysis to gain insights on the surface properties.
2 Experimental procedures
2.1 Raw materials and treatment
Palm wastes, namely date palm petioles (Fig. 1), were obtained from a date palm oasis in Gabès, Tunisia. Petioles were washed with distilled water to remove dust and other hydrophilic impurities, and then dried at room temperature. After being dried, they were cut into small pieces.

Visual aspect of a raw date palm petiole.
2.2 Activated carbon preparation
Pyrolysis and physical activation were carried out in a horizontal tube furnace. In a typical experiment, a palm petiole sample (30 g) was placed in a furnace under N2 flow (100 mL·min−1). The thermal program was as follows: heating from room temperature to 1000 °C at a 1 °C·min−1 rate including a first plateau at 300 °C for 4 h, then a second one at 700 °C for 2 h and a final maintenance at 1000 °C for 2 h. The cooling process was not controlled and therefore directed by the oven inertia.
The obtained chars were then activated under CO2 flow (100 mL·min−1) at different temperatures: 750 °C, 850 °C and 950 °C for 30 min at a heating rate of 5 °C·min−1.
The different samples are referred as raw date palm petiole (PP), carbonized palm petiole (CPP) and activated palm petiole (APP). Samples nomenclature also includes the activation temperature; for example APP750 refers to the carbonized palm petiole activated at 750 °C.
2.3 Samples characterizations
2.3.1 Yield and burn-off
The pyrolysis yield was defined as: . Burn-off is defined as the weight difference between the precursor biomass and the activated carbon. The following relationship was used: % burn-off = 100−[(mafter activation)/mprecursor) × 100].
2.3.2 Nitrogen sorption analysis
The specific surface area was determined by nitrogen sorption measurements in a Micromeritics ASAP 2010 analyzer. The total pore volume, Vtotal, was obtained from the amount of gas adsorbed at a relative pressure p/p0 of 0.99. The collected data were subjected to the Brunauer, Emmett, and Teller (BET) treatment [15]. The microporous volume (Vmicro) and the microporous specific surface area (Smicro) were obtained by the application of the t-plot method [16] to the nitrogen adsorption data. The pore size distribution of the materials was assessed by the density functional theory (DFT) [17].
2.3.3 Thermogravimetric analysis (TGA)
The weight loss studies of the materials were performed in a Netzsch STA 409 thermobalance under high purity argon flow (60 mL·min−1). The TGA data were obtained at a heating rate of 5 °C·min−1 and the temperature ranged from 30 to 1000 °C.
2.3.4 Microscopy analysis
The morphologies of PP, CPP and APP samples were observed by scanning electron microscopy (SEM) using a Hitachi TM-1000 microscope. To run the analysis, pieces of samples (sections of about 0.5 cm2) were cut from the corresponding monoliths and then mounted on a carbon tab, which ensured a good conductivity. A thin layer of gold-palladium was sputtered on the sample fragment prior to analysis. Micrographs were taken at several different magnifications between ×500 and ×10,000.
2.3.5 Skeletal density
The skeletal density (ρs) of the materials was determined using a Micromeritics Accupyc II 1340 helium pycnometer.
2.3.6 Elemental analysis
The C, H, N, S and O elemental analyses were carried out at ISM (CESAMO) using a Thermo Fisher Flash 2000 analyzer ensuring a precision of ±0.3%.
2.3.7 Mercury intrusion porosimetry analysis
The experimental open porosity Φexp, pore size distribution and skeletal density of each sample were determined by mercury intrusion porosimetry in a Micromeritics Autopore IV 9500 porosimeter with the following parameters: contact angle = 130°, mercury surface tension = 485 mN·m−1, maximum intrusion pressure = 124 MPa.
2.3.8 Conductivity measurement
Conductivity measurements were obtained through the four-point van der Paw technique, using direct current. A 2000 Keithley multimeter (Keithley Instruments Inc., Solon, OH, USA) was used for conductivity (resistance) measurements while employing a Keithley 2220 precision current source apparatus. The samples were chiseled using a diamond saw. Disks bearing radius of 2.5 mm and a 3 mm thickness were generated. For the sake of standard deviation, three disks of each sample were prepared.
2.3.9 Raman spectroscopy
Raman spectra were recorded at 297 K on a Xplora confocal micro-Raman spectrometer (Horiba Jobin-Yvon), in back scattering geometry at 2.33 eV laser energy (532 nm) with a typical spectral resolution of 1.7 cm−1 (lens ×50). We managed to irradiate below an incident power of 1 mW in order to avoid sample damaging.
3 Results and discussion
3.1 Characterization of raw palm petiole (PP)
The visual aspect of the raw palm petiole (PP) sample is shown in Fig. 2a.
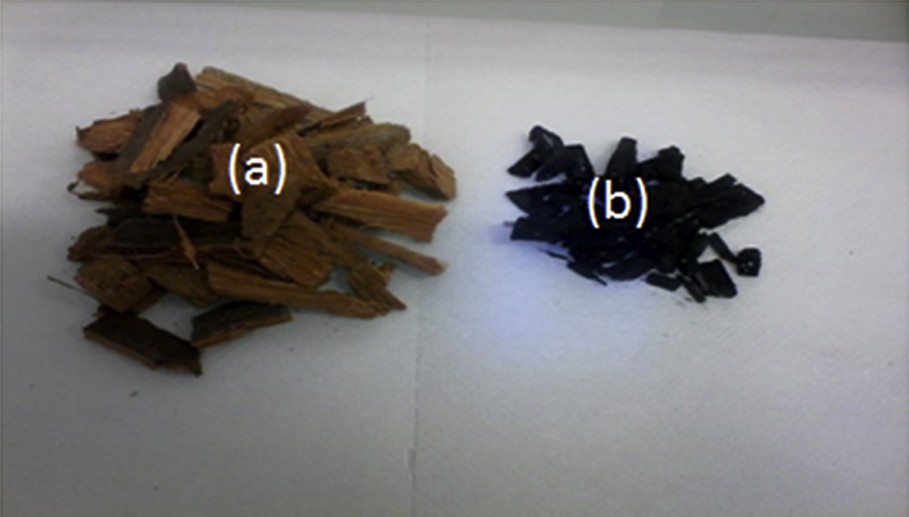
Visual aspect of PP (a) and CPP (b) samples.
The skeletal density of PP was estimated by helium pycnometry at ρs = 1.54 ± 0.08 g·cm−3, a value comparable to that of other lignocellulosic materials [18].
The TG analysis of raw palm petiole PP is represented in Fig. 3. The weight loss occurred in a temperature range of 30–1000 °C. Three stages of evolution were observed during the pyrolysis of the sample: dehydration, decomposition of the material and carbonization. The TG curve shows a first weight loss (11%) until (about) 180 °C due to loss of water. The second weight loss (44%), occurring between 180 °C and 370 °C, corresponds to the decomposition of cellulose and also the elimination of volatile matters and tars. The third stage arising between 370 °C and 705 °C, where up to 15% of weight loss was observed, is due to the decomposition of lignin [19]. Above 705 °C, the weight of the sample became constant indicating that the basic structure of the char has been formed. The total weight loss was about 71%.
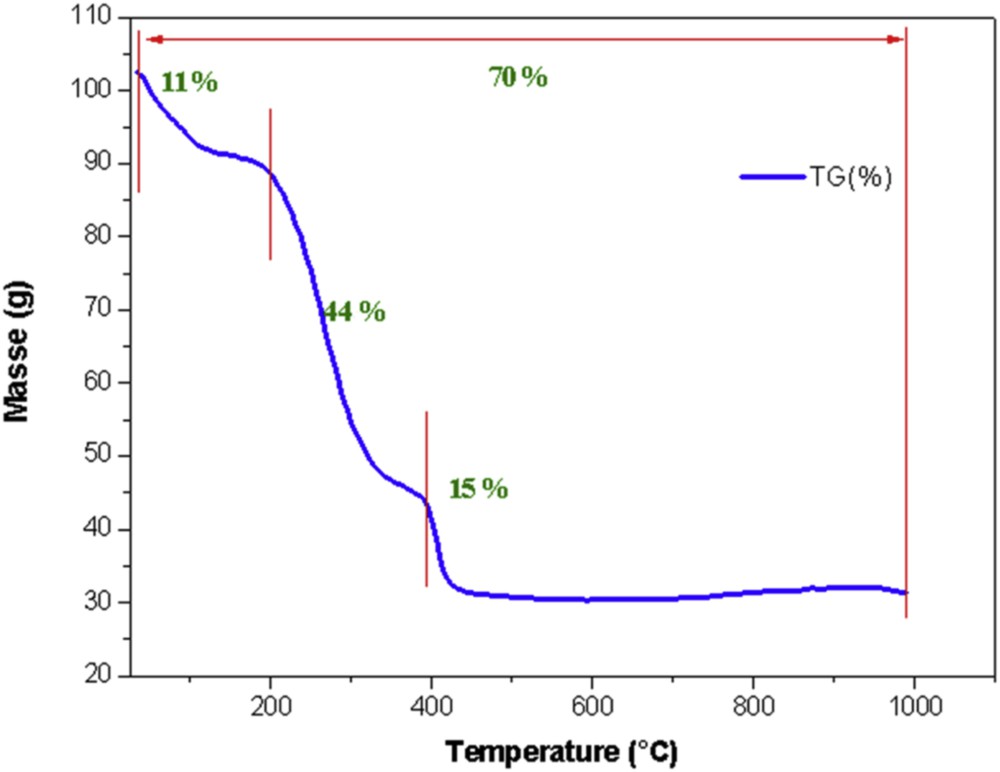
Thermogravimetry plot of raw palm petiole PP.
3.2 Characterization of carbonized (CPP) and activated (APP) materials
3.2.1 Yield and burn-off determination
The yield of the pyrolysis sample (PP) and the burn-off of activated samples (APP750 and APP850) are reported in Table 1.
Yield and burn-off.
| Sample | Yield (% w) | Burn-off (% w) |
| CPP | 31.6 | |
| APP750 | 42.3 | |
| APP850 | 78.6 | |
| APP950 | 58.6 |
The increase of the burn-off with activation temperature is an indication of the corresponding increase of mesoporosity and microporosity volumes of the different samples.
3.2.2 Elemental analysis
The elemental analyses of the different samples are reported in Table 2. The PP sample contains essentially C and O with less N. The presence of S may be due to the effects of industrial pollution from the sulfuric acid factories close to the oasis. Data reported indicate a strong increase in C/H and C/O mass ratios during the pyrolysis step, suggesting that a polymerization process occurs, hence increasing the aromatic degree of the material. The pyrolysis and activation lead to an increase in the carbon percentage in contrast to hydrogen and oxygen contents. The sulfur contents remain significant. The pyrolysis stage under neutral atmosphere allows obtaining a carbonaceous product by the volatilization of hydrogen, oxygen and nitrogen traces [20].
Elemental analyses of the materials.
| Sample | C (% w) | H (% w) | N (% w) | O (% w) | S (% w) | C/H | C/O |
| PP | 36.16 | 4.63 | 0.34 | 41.87 | 2.38 | 7.80 | 0.86 |
| CPP | 59.27 | 1.60 | 0.62 | 16.76 | 2.79 | 37.04 | 3.53 |
| APP750 | 62.94 | 1.01 | 0.56 | 12.27 | 4.18 | 62.31 | 5.12 |
| APP850 | 63.42 | 1.06 | 0.75 | 12.59 | 4.24 | 59.83 | 5.04 |
| APP950 | 53.67 | 0.96 | 0.26 | 13.39 | 5.83 | 55.90 | 4.01 |
3.2.3 Microscopy analysis
The samples PP, CPP, APP750, APP850 and APP950 are shown in Fig. 4. Raw palm petiole PP (Fig. 4a) has a natural porous structure that appears to be maintained after pyrolysis as observed in Fig. 4b. After activation, samples APP750 (Fig. 4c), APP850 (Fig. 4d), and APP950 (Fig. 4e) have a similar porous morphology. This indicates that the range of temperature used in this study did not produce significant differences in porous morphology [21].
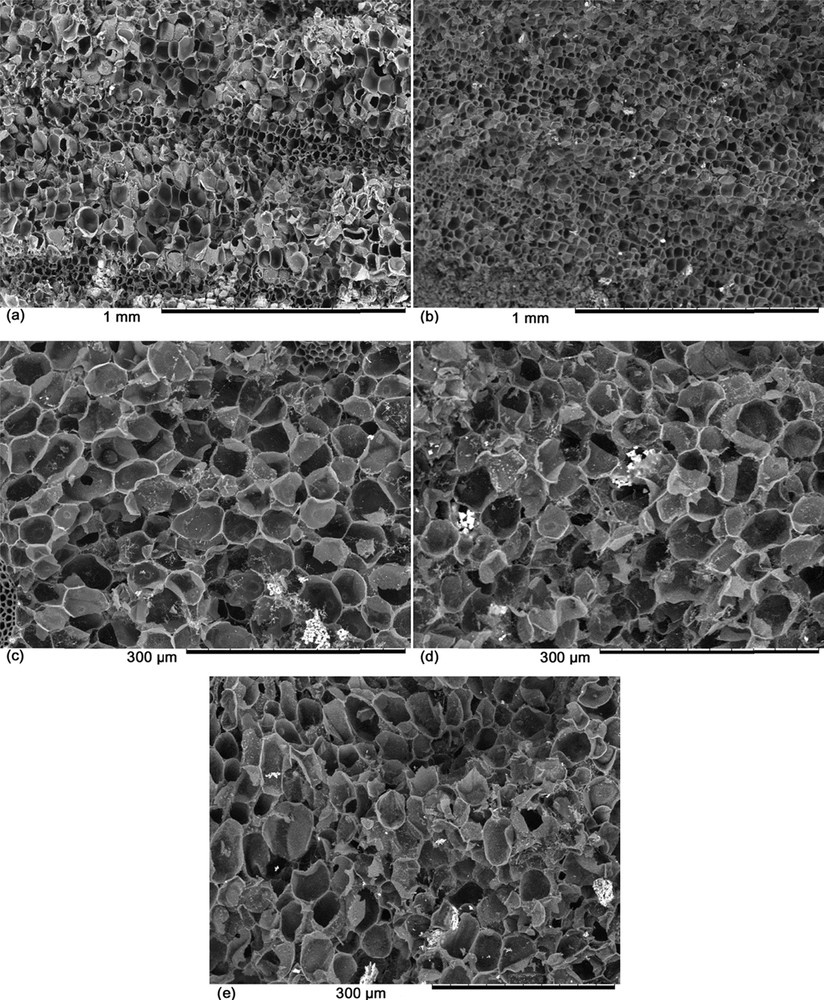
SEM micrographs of PP (a), CPP (b), APP750 (c), APP850 (d), APP950 (e).
3.2.4 Raman spectroscopy
The Raman spectra of APP850 and APP950 are reported in Fig. 5.
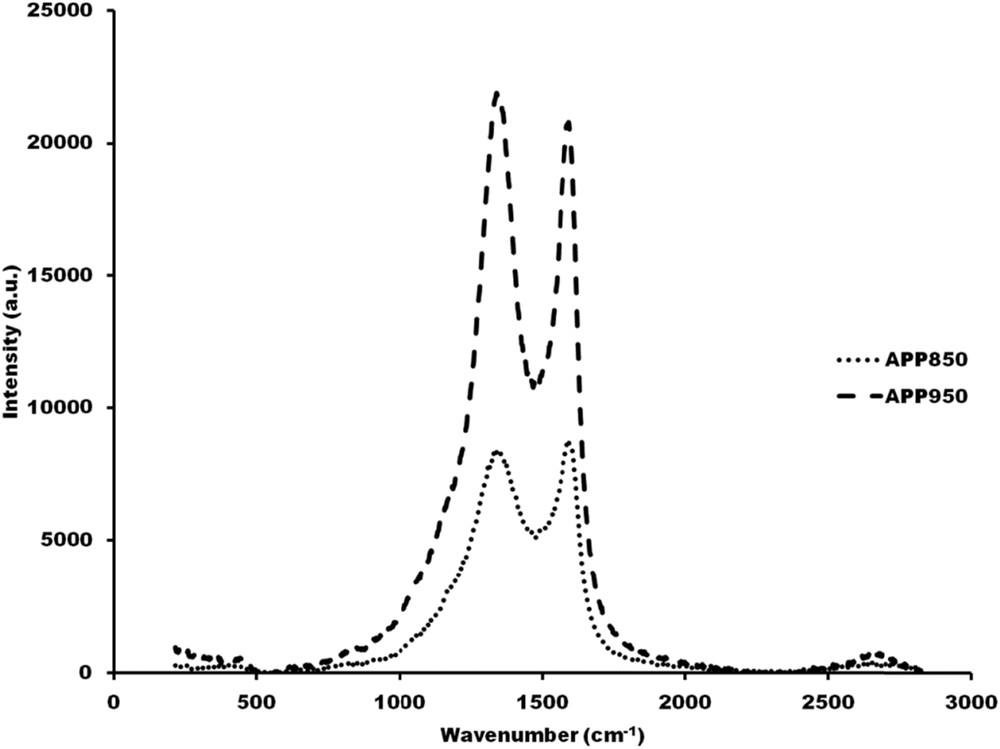
Raman spectra of carbonaceous samples pyrolysed at various temperatures. (···) APP850, (---) APP950.
From the Raman spectra, two main bands can be seen in the region of 1000–1750 cm−1. The band centered at 1337 cm−1 that corresponds to vibrations of tetrahedral (sp3) carbon atoms, known as D-band, and another band centered at 1584 cm−1 that corresponds to two dimensional in-plane motion of strongly coupled sp2 carbons (E2g symmetry) in the honeycomb network of the graphite lattice [22], labeled thus G-band. It can be observed that the intensity of the disorder parameter ID/(ID + IG) decreases from 51.2% for APP850 to 49.4% for APP950. Overall, this scenario shows that date palm petioles used in this work as a carbonaceous source are not favoring the enhancement of graphitic crystalline form over amorphous sp3 one when increasing the temperature from 850 °C up to 900 °C.
3.2.5 Porous volumes and specific surface area determination
The experimental open porosity Φexp (%) of the different samples was determined by mercury intrusion porosimetry. The obtained values are: 87%; 90%; 90% and 91% for CPP, APP750, APP850 and APP950, respectively. We noted a slight increase in the experimental porosity after activation. The maximum porosity was obtained for the temperature 950 °C. The skeletal density of the carbonized material CPP was found to be ρs = 1.76 ± 0.08 g·cm−3, and those of the activated carbons ρs = 1.88 ± 0.07 g·cm−3, for all samples. These values are consistent with that of amorphous carbons [23]. The average macropore diameters of the activated samples are in the range of 50–75 μm, similar with those of the native palm petiole. The porous structure of the palm petiole appears to be maintained after pyrolysis and activation.
The nitrogen adsorption/desorption isotherms at 77 K of samples CPP, APP750, APP850 and APP950 are reported in Fig. 6. The isotherm profiles are type I. As classified by IUPAC, type-I isotherms are obtained with microporous materials [24]. As can be seen from Fig. 4, for all samples CPP, APP750, APP850 and APP950, the main uptake occurs at low relative pressure (less than 0.1) showing the formation of microporous materials. The hysteresis loops owing to capillary condensation in mesopores are not very distinct, indicating that the samples possess only a limited mesoporosity.
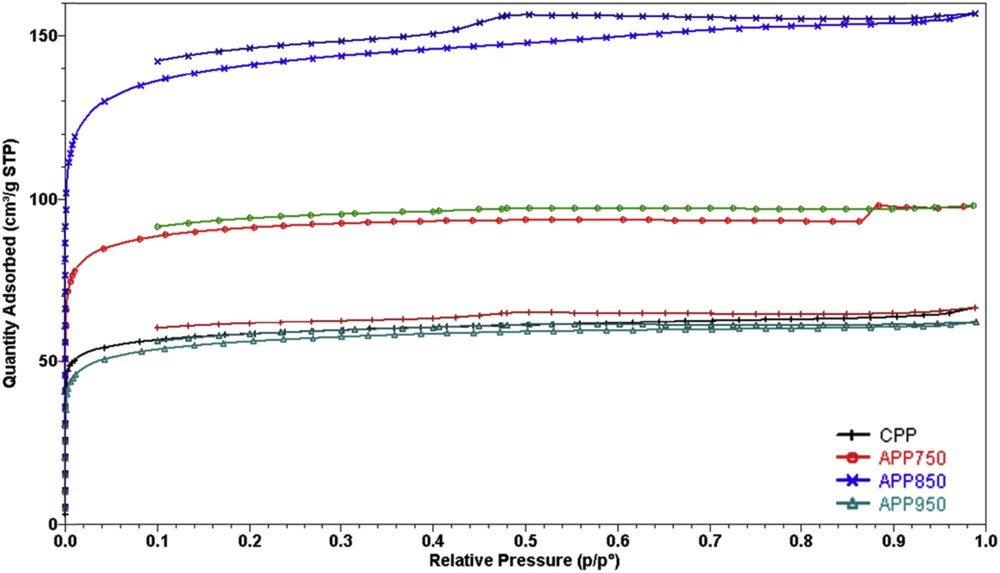
N2 sorption isotherms of pyrolyzed (CPP) and activated (APP750, APP850, APP950) samples.
Then, different pore volumes and specific surface area were determined from the data collected from the isotherms using specific methods (Table 2). The specific surface area SBET [15] of some samples activated are higher than those of non activated palm petiole (SBET = 353 and 546 m2·g−1 for APP750 and APP850, respectively). In the case of the sample activated at 950 °C (APP950), the specific surface area SBET decreased after activation and achieved a value comparable to that of non activated materials (SBET = 214 and 225 m2·g−1 for APP950 and CPP, respectively). This behavior is also observed for the total pore volume which increased from 0.15 to 0.24 cm3·g−1 as the activation temperature was raised from 750 °C to 850 °C and then decreased when the activation temperature reached 950 °C (0.09 cm3·g−1). This may be attributed to the decomposition of the material at high temperature under an oxidizing atmosphere. The t-plot method allows the determination of pore volumes and specific surface areas of micropores (pores of diameter less than 2 nm) [16]. As expected from the isotherms shape (Fig. 5), the entire sample series exhibits high micropore specific surface area values Smicro (Table 3). The micropore volume and specific surface area for APP850 are higher than for the other samples. In view of the results obtained, in this study 850 °C was regarded as the optimum activation temperature.
Nitrogen sorption results of pyrolyzed and activated carbons.
| Sample | BET method | t-plot method | ||
| SBET (m2·g−1) | Vtotal (cm3·g−1) | Smicro (m2·g−1) | Vmicro (cm3·g−1) | |
| CPP | 225 | 0.10 | 219 | 0.09 |
| APP750 | 353 | 0.15 | 351 | 0.14 |
| APP850 | 546 | 0.24 | 540 | 0.23 |
| APP950 | 214 | 0.10 | 210 | 0.09 |
The pore size distribution of the pyrolyzed and activated samples have been obtained by DFT calculations [17], considering slit-shaped pores. As observed in Fig. 7, all the samples show a pore size range of 0.6–1.2 nm with multiple peaks and a predominant maximum ≤0.7 nm, indicating the presence of micropores, while the mesopore contribution is negligible which is consistent with the previous observations.
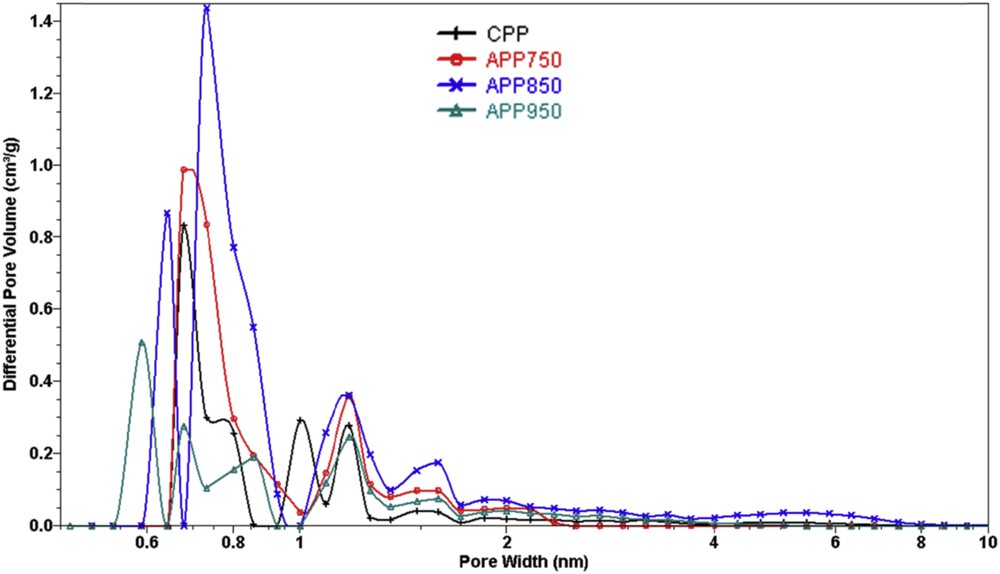
DFT pore size distribution of the pyrolyzed (CPP) and activated (APP) carbons.
3.2.6 Electrical properties
Electronic transport measurements have been performed on the date petiole activated at 850 °C (APP850). The electric conductivity is as follows: σ = 12 S·m−1 ± 0.5 S·m−1 This conductivity value is lower than those already reported for macroporous carbons prepared from lignocellulosic raw sources such as kraft black liquor [18].
4 Conclusions
Preparation of activated carbons from a new source of raw material: date palm petioles, proved to be very effective. This work shows that date palm petioles can be used as a precursor to produce activated carbons by pyrolysis followed by physical activation with CO2. Porosity analysis showed that a temperature of activation 850 °C during 30 min under CO2 flow can be regarded as optimum treatment. The activated carbons thus obtained are essentially microporous, with a BET specific surface area of 546 m2·g−1.