

1 Introduction
Proton transfers are fundamental processes in physical, chemical, and biological systems [1–4]. For example, proton transfers in DNA and related systems [2,5], proton-coupled electron transfer processes [6,7], and multiple proton transfers [8] were studied. On the other hand, the influence of π-electron delocalization on the interaction of hydrogen bonds was also analyzed and reported [9]. In other study, the resonance-assisted hydrogen bond systems were described by Gilli et al. [10] in which π-electron delocalization enhances the strength of hydrogen bonding. Also, the intramolecular proton transfer for benzoxazole and benzothiazole derivatives in different conditions has been reported [11,12]. In addition, the solvent effects on the proton transfer process of some compounds were investigated [13,14]. For example, water molecules could be activated as catalyzers accepting and releasing protons in the proton transfer process of adenine–uracil base pair [13]. Therefore, the study of the solvent effect is essential in proton transfer processes.
3,6-Diimino-1,4-cyclohexadiene-1,4-diamine (DCD) is an organic compound that has two intramolecular hydrogen bonds between the amino and imino groups for proton transfer (Fig. 1a). So far, extensive researches have been focused on the proton transfer of DCD and its derivatives [15–20]. For example, Holloway et al. [15] for the first time investigated the proton transfer process of DCD at semiempirical and ab initio levels of calculation. In addition, Limbach et al. [16] had previously analyzed kinetic and deuterium isotope effects of DCD and their derivatives. Also, the intramolecular hydrogen atom migration of DCD by ultraviolet radiation has been studied [17]. In other study, the proton transfer in azophenine, which is DCD derivation, was studied by Rumpel et al. [18,19] who suggested a stepwise single hydrogen atom transfer. In the previous studies, we reported the effect of the heteroatoms (B, N, Si, and P) on the proton transfer of DCD at the density functional theory (DFT) (B3LYP) level of theory (Fig. 1b) [20,21]. In addition, the extensive studies have been dedicated to 2,5-diamino-1,4-benzoquinone and its derivatives because these compounds significantly show physicochemical and biomedical properties [22–25]. Hence, the researches in this field are essential and remarkable. With this background, to further our understanding of the process, herein, we have investigated the process of intramolecular proton transfer of 2,5-diamino-1,4-benzoquinone (A) and 3,6-diaminopyrazine-2,5-dione (B) at the DFT (B3LYP) level of theory (Fig. 1c). Many investigations of hydrogen bonding have been performed by semiempirical methods [26] and ab initio methods [27,28]. On the other hand, the previous studies [29,30] showed that the DFT is becoming an alternative to the ab initio method because it is sufficiently accurate and applicable to many systems. DFT methods are attractive because they include the effects of electron correlation in their model. Moreover, molecular properties calculated with the DFT methods are in excellent agreement with the available experimental data for the systems containing the hydrogen bonding [31,32]. Thus, we used this method to analyze the proton transfer process of compounds A and B.
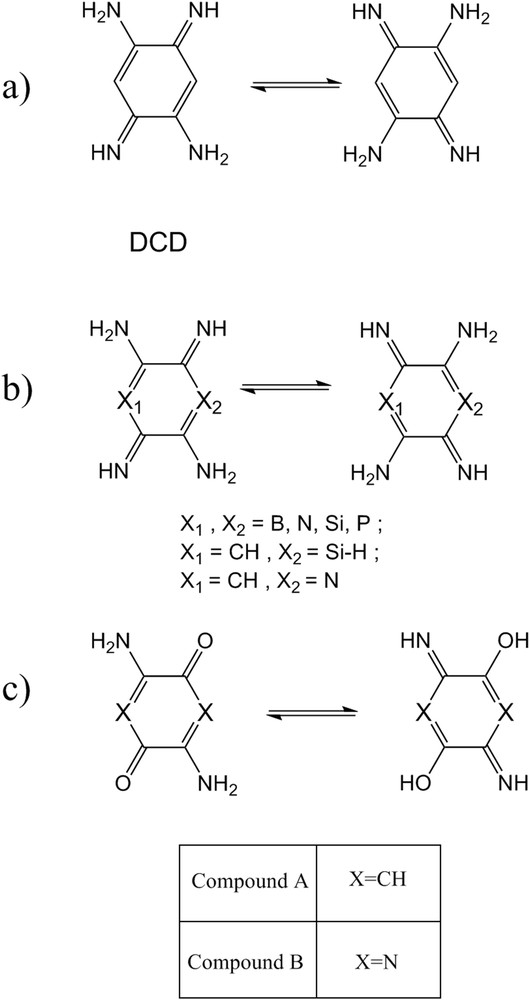
(a) The proton transfer process of 3,6-Diimino-1,4-cyclohexadiene-1,4-diamine (DCD). (b) The DCD structure with the different heteroatoms. (c) The proton transfer process of compounds A and B.
The term “aromaticity” is very useful in the rationalization of the structure, stability, and reactivity of many molecules. In particular, the degree of aromaticity in heteroaromatic compounds is important because it helps to understand the reactivity and other properties of those. In this study, we aimed to study aromaticity of compounds A and B using the nucleus-independent chemical shift (NICS) and harmonic oscillator model of aromaticity (HOMA) methods [33]. Studies have demonstrated that both methods are useful indicators of aromaticity that usually correlate well with the other energetic, structural, and magnetic criteria.
2 Methods
The optimizations of all geometries have been carried out using DFT because of its excellent compromise between computational time and description of electronic correlation. One hybrid functional of the DFT method, which consists of Becke's three parameters exact exchange functional (B3) [34] combined with the nonlocal gradient corrected correlation functional of Lee–Yang–Parr (LYP) [35], denoted as B3LYP, has been used. The B3LYP calculations with the split valence aug-cc-pvtz basis set were used [35,36]. The harmonic vibrational frequency calculations were performed for all optimized species at the B3LYP/aug-cc-pvtz level to characterize the optimized stationary or saddle points and to evaluate the corresponding zero-point vibrational energies. The solvent effects have been performed using the polarizable continuum model [37,38] with water as a solvent at a temperature of 298.15 K. The solvation-free energies (ΔGsol) were calculated as the difference in optimized energies of compounds A and B in gas and water phases. NICS values were obtained by calculating absolute NMR shielding at ring center (NICS (0)) and at 1.0 Å above the ring center (NICS (1)) at the B3LYP/aug-cc-pvtz level of theory using the gauge-independent atomic orbital method [26,39,40]. All calculations were performed using Gaussian 98 program package [41].
3 Results and discussion
3.1 Energy calculations
The proton transfer pathways of the compounds A and B are shown in Fig. 2. As can be seen, two mechanisms for the proton transfer are feasible, stepwise (TS1) and concerted (TS2), because these compounds have two intramolecular hydrogen bonds between the amino and carbonyl groups. In stepwise mechanism, the resonance structures of GS1 can transfer an amine hydrogen atom to the carbonyl oxygen atom through TS1a. After the first transfer, the produced intermediate (Int) structures can transfer the second proton by passing through TS1b that results in the GS2 structure. In fact, the stepwise mechanism proceeds via two transition states (TS1a and TS1b) and one intermediate (Int). In addition, the concerted (TS2) mechanism involves the simultaneous transfer of both protons in a single step (Fig. 2). The total energies of the structures at the DFT level of theory are listed in Table 1. Also, the energy diagram of the zero-point corrected energy for both mechanisms of the compounds A and B at the B3LYP/aug-cc-pvtz level of theory are presented in Fig. 3. According to Fig. 3a, the calculated relative energies of TS1a, TS1b, and TS2 in the gas phase obtained for the compound A were 17.11, 25.18, and 27.56 kcal/mol, respectively. The corresponding values for compound B were 18.73, 29.27, and 31.83 kcal/mol, respectively (Fig. 3b). These results show that the stepwise mechanism for both compounds is more favorable than the concerted mechanism because the stepwise mechanism has a lower energy barrier than that of the concerted mechanism. In addition, the GS2 structure of the compounds A and B (about 17.74 and 21.51 kcal/mol, respectively) has the higher energy than the GS1 structure. It indicates that the enol structure (GS2) of both compounds is unstable as compared with their GS1 structure (keto form). Also, the energy of Int structure is more than that of TS1a but less than that of TS1b for both compounds, which implies these results are significant. This topic can be related to the establishing enol forms in the Int and TS1b structures for the first and second proton transfer, respectively. In other words, these transformations cause the conversion of both carbonyls to enol forms, which results in the increase in energy and instability. In addition, the calculations of vibrational frequencies showed that GS1, Int, and GS2 structures exhibit zero imaginary frequency, whereas TS1 and TS2 structures indicated one and two imaginary frequencies, respectively, for both compounds, which proves all the optimized species. Overall, the compound B requires more energy barrier than compound A for the proton transfer process. It can be related to the resonance paths of the compounds A (NCCCO) and B (NCNCO). As can be observed, the similarity of the atoms into the ring for the compound A is more than that for compound B. This causes better resonance and improves the proton transfer process in compound A, which results in a decrease in energy for all structures as compared with compound B.
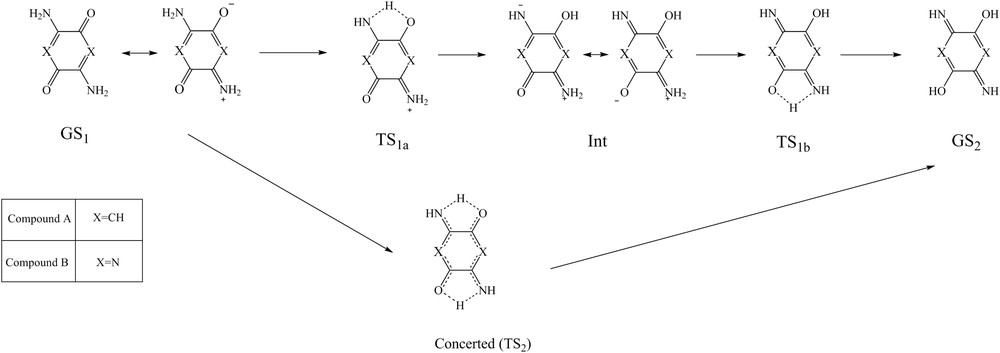
The stepwise and concerted mechanisms of the proton transfer of the compounds A and B.
Total energy (hartree), relative energy (kcal/mol), zero-point vibrational energy (kcal/mol), and the free energies of solvation for intramolecular proton transfer of compounds A and B in gas and water phases.
| Compound | Phase | Methods | GS1 | TS1a | Int | TS1b | TS2 | GS2 |
| A | Gas | B3LYP/aug-cc-pvtz | −492.39626 | −492.36550 | −492.36519 | −492.35305 | −492.34518 | −492.36917 |
| ZPVE | 74.78009 | 72.58571 | 74.89149 | 72.84567 | 70.28699 | 75.52325 | ||
| Erel | 0 | 17.11 | 19.61 | 25.18 | 27.56 | 17.74 | ||
| Water | B3LYP/aug-cc-pvtz | −492.41720 | −492.38376 | −492.38756 | −492.36699 | −492.35789 | −492.38157 | |
| ZPVE | 74.31201 | 71.86922 | 74.39646 | 72.18761 | 69.59101 | 74.92270 | ||
| Erel | 0 | 18.53 | 18.68 | 29.38 | 32.50 | 22.97 | ||
| ΔGsol | −13.88 | −12.61 | −14.66 | −9.5 | −8.80 | −8.44 | ||
| B | Gas | B3LYP/aug-cc-pvtz | −524.51268 | −524.47912 | −424.48004 | −524.46249 | −524.45444 | −524.47899 |
| ZPVE | 60.70834 | 58.37696 | 60.64462 | 58.48538 | 55.98887 | 61.07584 | ||
| Erel | 0 | 18.73 | 20.42 | 29.27 | 31.83 | 21.51 | ||
| Water | B3LYP/aug-cc-pvtz | −524.54445 | −524.50759 | −524.51179 | −524.48511 | −524.47670 | −524.49944 | |
| ZPVE | 60.12853 | 57.62917 | 60.11168 | 58.39916 | 55.28492 | 60.99056 | ||
| Erel | 0 | 20.63 | 20.48 | 35.5 | 37.67 | 29.10 | ||
| ΔGsol | −20.90 | −17.85 | −20.46 | −17.22 | −14.82 | −12.43 |
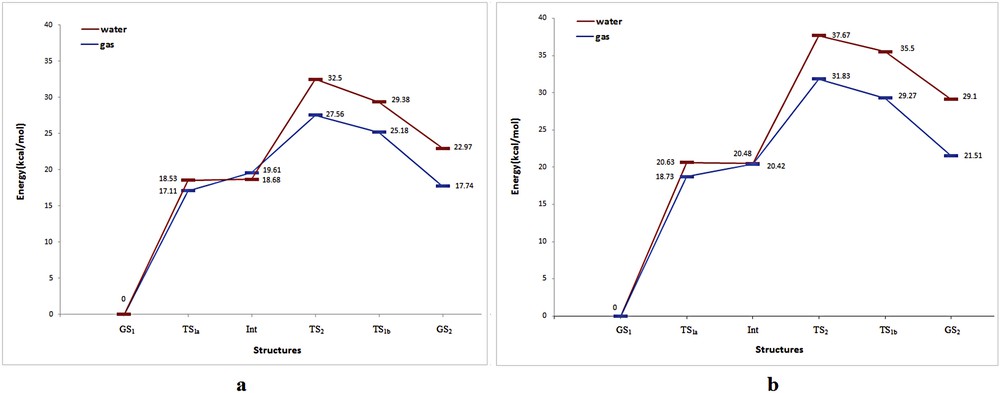
The diagram of the relative energy of the proton transfer process of the compounds A (a) and B (b) in gas and water phases at the B3LYP/aug-cc-pvtz level of theory.
The solvent effect in the proton transfer process of both compounds is also studied at the B3LYP/aug-cc-pvtz level using the polarizable continuum model, and water as a solvent is selected. The results are presented in Table 1. It is found that the structures and the relative energies of the stationary points are in excellent agreement with their gas phases. As can be seen in Fig. 3, except for the Int structure, the relative energies of the other structures are significantly increased for both compounds as compared with gas phases of those. On the basis of this, the energy differences between the structures in the water and gas phases for compounds A and B were estimated to be about 1.42–5.23 and 1.9–7.59 kcal/mol, respectively (Fig. 3). These increases in energy can be related to the hydrogen bond of water molecules with carbonyl group and the transferring hydrogen atoms that prevent proton transfer as compared with gas phase. Hence, these results show that water molecules considerably increase the relative energy of transition states for both compounds. On the other hand, the difference in relative energy of the Int structure in the water and gas phases was calculated as about −0.93 kcal/mol for compound A whereas it was approximately constant (20.48–20.42 kcal/mol) for compound B (Fig. 3). This shows that the ionic and polar nature of the Int structure causes the better solvation of the Int with water molecules (as compared with other structures). The free energy of solvation (ΔGsol) is an important parameter in acquisition of a perception into the chemical behavior and reactivity of materials [42]. The data in Table 1 show that the most negative ΔGsol values are the GS1 and Int structures for both compounds. The ΔGsol values of other structures become less negative. This indicates that the transition states and GS2 structures are hardly solvated by water molecules because of intramolecular hydrogen bonds. In other words, intramolecular hydrogen bonds between carbonyl and amine groups avoid the solvation of them by water molecules that follows the increase in free energy.
3.2 Structural parameters
The optimized geometrical structures of the proton transfer process of the compounds A and B are shown in Figs. 4 and 5, respectively. The GS1 structure, which has two intramolecular hydrogen bonds between the amino and carbonyl groups, is planar. Also, other structures were planar. The calculated bond lengths of compound A are listed in Table 2, where the numbering of atoms is given in Fig. 4. In compound A, the bond lengths of the C1C2 and C4C5 for all structures (1.494–1.548 Å) suggest single-bond character, whereas those of C2C3 and C5C6 (1.348–1.428 Å) and C1C6 and C3C4 (1.363–1.442 Å) are shorter than the single CC bond length. Also, the C1N7 and C4N10 bonds (1.284–1.338 Å) and C2O8 and C5O9 (1.229–1.332 Å) are shorter than the CN and CO single bonds, respectively. Fig. 5 shows the optimized structures of the compound B. In addition, the calculated bond lengths for compound B are listed in Table 3, where the numbering of atoms is given in Fig. 5. In the compound B, the lengths of the C1C2 and C4C5 bonds for all structures showed the single-bond character (1.507–1.560), whereas those of C2N3, N3C4, C5N6, and C1N6 bonds (1.283–1.379) are shorter than the single CN. In addition, the C1N7 and C4N10 bonds (1.274–1.326 Å) and C2O8 and C5O9 (1.216–1.318 Å) are shorter than the CN and CO single bonds. These comparisons suggest that the π-conjugation systems in both compounds are separated into two parts. In addition, all structures in proton transfer pathways of both compounds were planar. Bond and dihedral angles of compounds A and B are presented in Supplementary data.
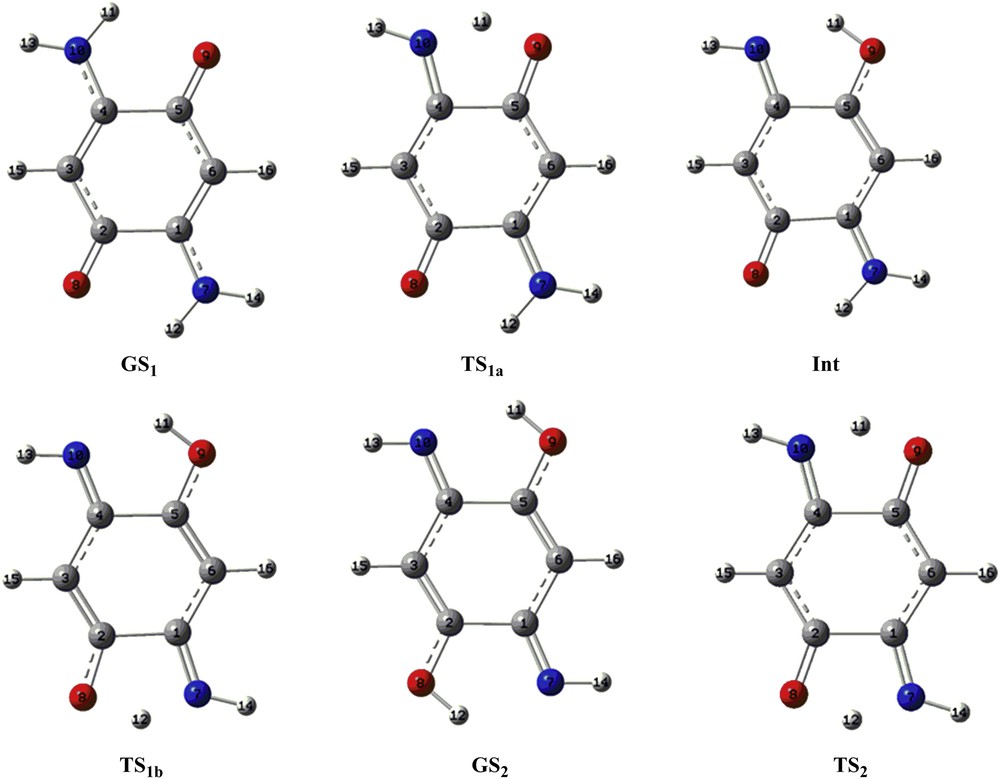
The optimized geometrical structures of the proton transfer process of the compound A at the B3LYP/aug-cc-pvtz level of theory.
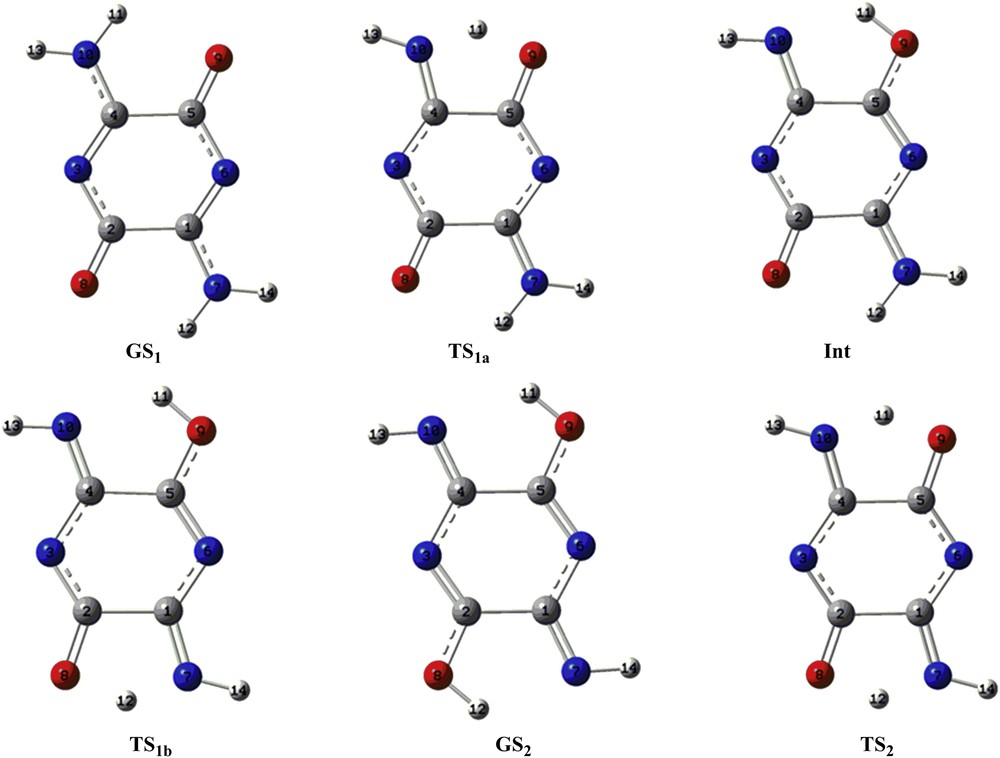
The optimized geometrical structures of the proton transfer process of the compound B at the B3LYP/aug-cc-pvtz level of theory.
Optimized bond lengths (Å) in the compound A.
| Length | GS1 | TS1a | Int | TS1b | TS2 | GS2 |
| C1C2 | 1.527 | 1.548 | 1.538 | 1.522 | 1.539 | 1.494 |
| C2C3 | 1.428 | 1.410 | 1.393 | 1.363 | 1.376 | 1.348 |
| C3C4 | 1.363 | 1.379 | 1.406 | 1.429 | 1.400 | 1.442 |
| C4C5 | 1.527 | 1.530 | 1.510 | 1.511 | 1.539 | 1.494 |
| C5C6 | 1.428 | 1.390 | 1.368 | 1.358 | 1.376 | 1.348 |
| C1C6 | 1.363 | 1.382 | 1.399 | 1.415 | 1.400 | 1.442 |
| C1N7 | 1.338 | 1.322 | 1.311 | 1.291 | 1.298 | 1.284 |
| C4N10 | 1.338 | 1.311 | 1.300 | 1.289 | 1.298 | 1.284 |
| C2O8 | 1.229 | 1.235 | 1.246 | 1.286 | 1.273 | 1.332 |
| C5O9 | 1.229 | 1.262 | 1.305 | 1.319 | 1.273 | 1.332 |
| N7H12 | 1.009 | 1.015 | 1.021 | 1.243 | 1.243 | – |
| N10H11 | 1.009 | 1.243 | – | – | 1.243 | – |
| O9H11 | – | 1.243 | 1.009 | 0.992 | 1.243 | 0.982 |
| O8H12 | – | – | – | 1.243 | 1.243 | 0.982 |
Optimized bond lengths (Å) in the compound B.
| Length | GS1 | TS1a | Int | TS1b | TS2 | GS2 |
| C1C2 | 1.540 | 1.560 | 1.548 | 1.531 | 1.549 | 1.507 |
| C2N3 | 1.362 | 1.349 | 1.332 | 1.301 | 1.317 | 1.283 |
| N3C4 | 1.304 | 1.318 | 1.343 | 1.367 | 1.339 | 1.379 |
| C4C5 | 1.540 | 1.536 | 1.515 | 1.523 | 1.549 | 1.507 |
| C5N6 | 1.362 | 1.327 | 1.307 | 1.298 | 1.317 | 1.283 |
| C1N6 | 1.304 | 1.325 | 1.338 | 1.351 | 1.339 | 1.379 |
| C1N7 | 1.326 | 1.312 | 1.304 | 1.283 | 1.289 | 1.274 |
| C4N10 | 1.326 | 1.300 | 1.289 | 1.278 | 1.289 | 1.274 |
| C2O8 | 1.216 | 1.221 | 1.229 | 1.270 | 1.259 | 1.318 |
| C5O9 | 1.216 | 1.251 | 1.294 | 1.304 | 1.259 | 1.318 |
| N7H12 | 1.008 | 1.012 | 1.015 | 1.243 | 1.243 | – |
| N10H11 | 1.008 | 1.243 | – | – | 1.243 | – |
| O9H11 | – | 1.243 | 1.003 | 0.991 | 1.243 | 0.982 |
| O8H12 | – | – | – | 1.243 | 1.243 | 0.982 |
3.3 Charge calculations
Mulliken charge populations on all atoms for both compounds are shown in Tables 4 and 5. The data indicate that the charge on the labile hydrogen and nitrogen increase distinctively in the transition state. In other words, the proton transfer causes the separation of charge for both compounds. According to Table 4, in the compound A, charge analysis shows that the net atomic charge of the H atom, which is transferred, increases during the process from 0.065 for GS1 to 0.324 for TS1a and from 0.106 for Int to 0.343 for TS1b. In addition, the charge population of both the H11 and H12 is obtained as 0.352 for TS2 structure. Because of an increase in the bond polarity, the reaction shows a certain degree of proton transfer character. The net negative charge of the N10 atom is −0.459 for GS1 and −0.579 for TS1a; N7 atom is −0.459 for GS1 and −0.541 for TS1b; O9 atom is −0.971 for GS1 and −0.836 for TS1a; and O8 atom is −1.014 for Int and −0.888 for TS1b. The net negative charges of these nitrogen atoms are increased and those of the oxygen atoms are decreased during the proton transfer process. On the basis of this, it can be seen that most of the negative charges are localized on nitrogen and oxygen atoms and most of the positive charges are populated on hydrogen atoms attached to nitrogen atoms. In fact, the greatest value of the positive charges in TS structures was distributed on the transferred hydrogen, whereas that for the negative charges was placed on the oxygen and nitrogen atoms.
Charge changes in the process of proton transfer of compound A.
| Atom | GS1 | TS1a | Int | TS1b | TS2 | GS2 |
| C1 | 0.753 | 0.657 | 0.767 | 0.523 | 0.401 | 0.803 |
| C2 | 1.074 | 1.068 | 1.002 | 0.986 | 0.963 | 0.954 |
| C3 | −0.786 | −0.687 | −0.709 | −0.626 | −0.631 | −0.842 |
| C4 | 0.753 | 0.498 | 0.683 | 0.604 | 0.401 | 0.803 |
| C5 | 1.074 | 0.932 | 1.013 | 0.924 | 0.963 | 0.954 |
| C6 | −0.786 | −0.704 | −0.837 | −0.775 | −0.631 | −0.842 |
| N7 | −0.459 | −0.429 | −0.416 | −0.541 | −0.553 | −0.798 |
| N10 | −0.459 | −0.579 | −0.785 | −0.795 | −0.553 | −0.798 |
| O8 | −0.971 | −0.993 | −1.014 | −0.888 | −0.865 | −0.719 |
| O9 | −0.971 | −0.836 | −0.723 | −0.727 | −0.865 | −0.719 |
| H11 | 0.065 | 0.324 | 0.259 | 0.264 | 0.352 | 0.234 |
| H12 | 0.065 | 0.092 | 0.106 | 0.343 | 0.352 | 0.234 |
Charge changes in the process of proton transfer of compound B.
| Atom | GS1 | TS1a | Int | TS1b | TS2 | GS2 |
| C1 | 0.480 | 0.479 | 0.516 | 0.421 | 0.380 | 0.540 |
| C2 | 0.550 | 0.563 | 0.509 | 0.388 | 0.428 | 0.474 |
| N3 | −0.268 | −0.260 | −0.233 | −0.205 | −0.243 | −0.267 |
| C4 | 0.480 | 0.432 | 0.566 | 0.534 | 0.380 | 0.540 |
| C5 | 0.550 | 0.398 | 0.449 | 0.465 | 0.428 | 0.474 |
| N6 | −0.268 | −0.264 | −0.301 | −0.282 | −0.243 | −0.267 |
| N7 | −0.194 | −0.207 | −0.217 | −0.386 | −0.381 | −0.576 |
| N10 | −0.194 | −0.394 | −0.563 | −0.563 | −0.381 | −0.576 |
| O8 | −0.705 | −0.700 | −0.728 | −0.621 | −0.613 | −0.506 |
| O9 | −0.705 | −0.608 | −0.521 | −0.505 | −0.613 | −0.506 |
| H11 | 0.092 | 0.357 | 0.286 | 0.277 | 0.382 | 0.266 |
| H12 | 0.092 | 0.107 | 0.115 | 0.361 | 0.382 | 0.266 |
In the compound B, as shown in Table 5, the charge population of H11 is 0.092 (GS1), 0.357 (TS1a), and 0.382 (TS2) and that of H12 is 0.115 (Int), 0.361 (TS1b), and 0.382 (TS2). These indicate that the charge on H11 and H12 increases during the proton transfer (GS1 → TS), which induces proton transfer character. In the transition states, the charge population on the N10 is −0.394 (TS1a) and −0.381 (TS2) and that on the N7 is −0.386 (TS1b) and −0.381 (TS2), whereas this value for N10 and N7 was −0.194 in the GS1 structure. These results show that the net charges of the nitrogen atoms are increased along the process. In addition, the values for O9 from −0.705 (GS1) to −0.608 (TS1a) and those for O8 from −0.728 (Int) to −0.621 (TS1b) are decreased. These results show that electrons are redistributed after the proton transfer.
3.4 Aromaticity
3.4.1 NICS index
NICS criterion was offered by Schleyer et al. [43] as a magnetic index of aromaticity. This method is based on the fact that the negative value of the absolute shielding was observed at a ring center or at some other interesting points of the system, usually above the ring center. On the basis of this, aromatic systems are introduced with large negative NICS values (diatropic ring current). In fact, these negative NICS values are the best descriptors of electron delocalization. In addition, NICS values close to zero and positive are known as nonaromatic and antiaromatic (paratropic ring current) species, respectively. NICS is usually computed at ring centers (NICS (0)) and 1 Å above the molecular plane (NICS (1)). NICS (1) essentially reflects π effects and it is a better indicator of the ring current than NICS (0), because the effects of the local σ-bonding contributions are diminished at 1 Å above the ring plane [43–46]. In other words, the NICS (1) values are the better descriptors of aromaticity than NICS (0) because they consider the π-electron effects. The NICS values obtained using the gauge-independent atomic orbital procedure at the B3LYP/aug-cc-pvtz level are given in Table 6.
Calculated values of aromaticity indexes at the B3LYP/aug-cc-pvtz level for the proton transfer process of compounds A and B.
| Structures | Compound A | Compound B | ||||
| NICS (0) | NICS (1) | HOMA | NICS (0) | NICS (1) | HOMA | |
| GS1 | 6.78 | 2.15 | −0.15 | 7.82 | 0.55 | −0.30 |
| TS1a | 7.09 | 2.55 | −0.22 | 7.98 | 0.72 | −0.38 |
| Int | 5.90 | 2.00 | −0.03 | 6.70 | −0.01 | −0.14 |
| TS1b | 5.03 | 1.24 | −0.043 | 6.79 | 0.07 | −0.11 |
| TS2 | 6.77 | 2.28 | −0.22 | 8.09 | 0.82 | −0.38 |
| GS2 | 3.02 | 0.05 | 0.00 | 5.41 | −0.583 | −0.02 |
As can be seen in Table 6, the NICS (0) values obtained for both compounds are about 3.02–8.09. This indicates that all structures present antiaromatic properties in particular for compound B. Indeed, this topic causes the bond fixation and the decrease in electron delocalization in the reaction pathways, which results in an increase in the energy barrier of proton transfer for compound B. On the other hand, the obtained NICS (1) values are significantly less than NICS (0) values. These values are calculated about −0.583 to 2.55 for both compounds. In addition, the difference in NICS values (NICS (0) and NICS (1)) in the compound A is less. Furthermore, the values show that in most of the structures, the ring has antiaromatic properties, which cause bond fixation in the ring and avoids involvement in resonance, whereas NICS (1) values of GS2 and Int structures of the compound B slightly show aromatic properties. Overall, both compounds show antiaromaticity to nonaromaticity properties during the proton transfer process.
3.4.2 HOMA index
HOMA index is based on bond lengths, which is a geometrical indicator for interpreting aromaticity. The HOMA index was defined as [47,48]
3.5 Infrared spectra analysis
The infrared spectra of the compounds A and B are provided in Figs. 6 and 7, respectively, to study molecular structure evolution during the proton transfer process. Fig. 6 shows the IR spectra of GS1, TS1a, Int, TS1b, TS2, and GS2 structures for compound A. Site-specific information, such as the NH, OH, and CO vibrational modes are assigned in Fig. 6; these figures stand for the six statuses of dynamics of IR spectra. No imaginary frequencies were observed for GS1, Int, and GS2 structures for both compounds that correspond to energy minima. In GS1 spectrum, the absorption peaks of NH2 groups appeared at 3705 cm−1 (asymmetry stretching), 3549 (symmetry stretching), and 1582 cm−1 (scissoring mode), whereas these values for TS1a at 3680, 3481, and 1549 cm−1, respectively, are observable. It shows that NH2 peaks are red shifted because of the resonance of atoms in the proton transfer process (GS1 → TS1a). Also, the new peaks at 3627 and 2102 cm−1 of the TS1a spectrum can be assigned to the NH group and the transferring hydrogen, respectively, as compared with GS1 spectrum. In addition, the CO peak in the TS1a was significantly weaker than that in the GS1, which can be attributed to disappearing one CO group in the proton transfer process. Also, the only imaginary frequency at −1239.12 cm−1 points to the formation of H11O9, which confirmed the existence of a transition state. In Int spectrum, the NH, NH2 vibrational mode is red shifted as compared to that of TS1a spectrum. Also, the CO group is red shifted from 1706 to 1691 cm−1, which can be assigned to the resonance pathway of NCCCO in the process that follows weakness of CO bond. In addition, the peak of H11 at 2102 cm−1 disappeared and the remarkable peaks at 3041 and 1612 cm−1 appeared, which can be assigned to OH and CN stretching mode, respectively. Compared with the OH vibrational mode of the Int structure, this mode for TS1b (3316 cm−1) is blue shifted. In addition, comparing the OH (3316 cm−1) and CN (1619 cm−1) vibrational modes at the TS1b with those of OH (3481 cm−1) and CN (1646 cm−1) at the GS2, these modes at the GS2 are blue shifted. In addition, the peak at 2114 cm−1 can be assigned to transferring H12. For TS2, the intensity of later peak is significantly stronger than that of TS1a and TS1b structures because of the transfer of two protons. Hence, two imaginary frequencies at −1416.44 and −1068.79 cm−1 for TS2 and single imaginary frequency at −1249.29 cm−1 for TS1b are observed for the proton transfer process. Hence, the changes in the frequencies of OH, NH, and CO modes in the proton transfer process reflect the influence of the resonance in this process. For compound B, infrared spectra analysis results were alike to compound A (Fig. 7). In summary, the vibrational modes of the amino groups in the proton transfer process from GS1 to TS1b are red shifted. On the other hand, the CO peak intensity was significantly decreased. It can be related to convert the CO groups (1710–1760 cm−1) to the enol ones (3147–3504 cm−1) in the proton transfer process. In addition, CO peak for the Int is red shifted as compared with that of the GS1 and TS1a spectra. Overall, these red shifts can be related to the resonance pathways for proton transfer. In other words, the resonance process causes decrease in frequency of functional groups or increase in wavelengths of these groups. The novel peaks at 2100–2120 cm−1 for the TS1a, TS1b, and TS2 structures can be assigned to transferring hydrogen atoms (similar to compound A). On the basis of the geometric structure of the compound B, a transition state is found with the only imaginary frequency at −1243.89 cm−1 for TS1a and −1266.39 cm−1 for TS1b. In addition, two imaginary frequencies located at −1406.25 and −1093.79 cm−1 for TS2 appear in the infrared spectrum results, which point to the formation of the enol structures (GS2).
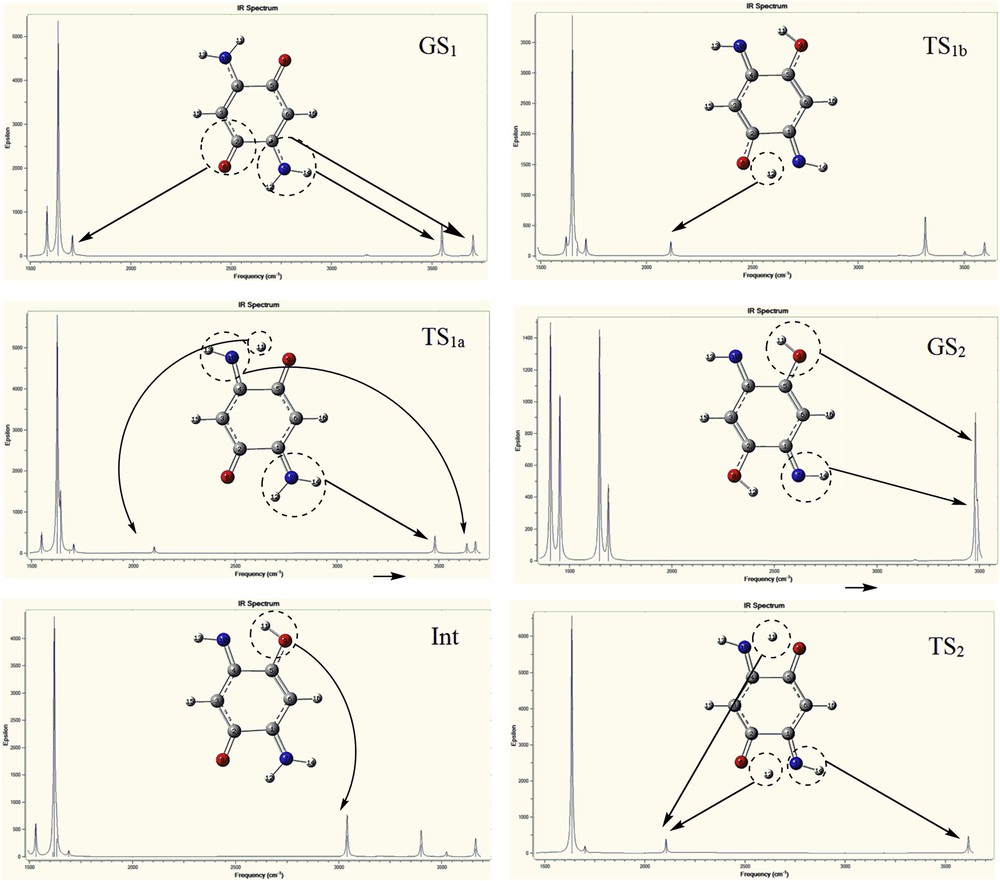
The calculated IR spectra at the B3LYP/aug-cc-pvtz level of theory for compound A.
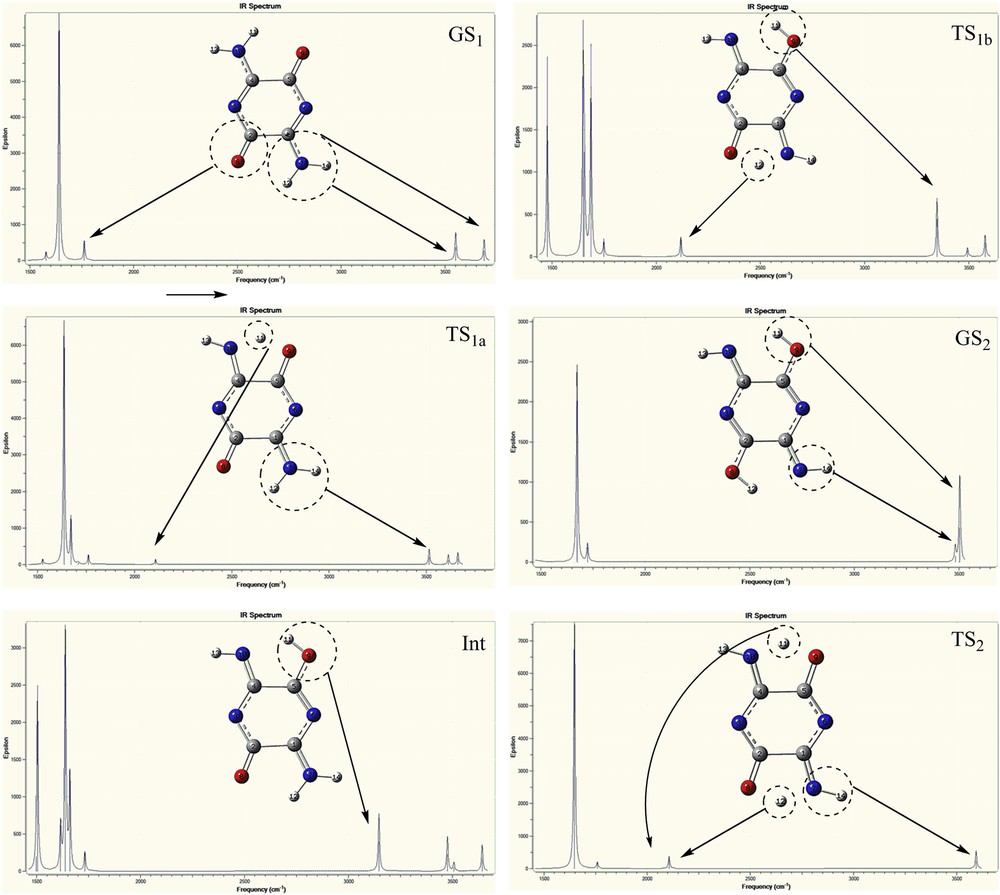
The calculated IR spectra at the B3LYP/aug-cc-pvtz level of theory for compound B.
4 Conclusions
The results obtained for proton transfer of the compounds A and B showed that stepwise mechanism is preferred over concerted mechanism in both compounds. Also, because of the similarity of bond lengths in compound A, the energy barrier for proton transfer was lower than that of compound B. The solvent effect in the process of proton transfer displayed that energy barrier increases because of the influence of intramolecular hydrogen bond. In addition, NICS and HOMA results indicated that the compounds A and B are antiaromatic to nonaromatic in the current of the proton transfer process.
Acknowledgments
The authors thank Dr. Farhoush Kiani for helpful discussions. Also, the financial and encouragement support provided by Research vice Presidency of Ayatollah Amoli branch, Islamic Azad University, is acknowledged.