

1 Introduction
The majority of the industries, paper, textile, leather, printing, food, cosmetics, plastics, and rubber, uses dyes to color their ultimate product [1]. Dye pollution from industrial effluents disturbs human health and ecological equilibrium. Annually, about 50% of 800,000 tons of synthetic dye products are azo dyes [2]. Tartrazine is an azo dye present in drugs [3], cosmetics, and food additives [4]. This substance is considered to be highly toxic for humans as it acts as hyperactivity and causes asthma, migraines, urticaria, angioedema, thyroid cancer, lupus, eczema, and other behavioral problems [5]. Therefore, it is necessary to treat the wastewater containing tartrazine before its discharge.
Several technologies have been reported for dye removal as coagulation, chemical oxidation, membrane separation, electrochemical process, and adsorption [6]. Adsorption is the most convenient and effective technique used to remove dyestuff [7]. Synthesized or natural materials have been used for the treatment of the wastewater by adsorbing the dyes. Activated carbon is a well-known adsorbent for dye removal from wastewater, but its high cost has restricted its use [8]. Among natural material clays, such as bentonite, sepiolite, kaolinite, diatomite, and fuller's earth, minerals occupy an important place due to their low costs.
Bentonite is characterized by one Al octahedral sheet sandwiched between two Si tetrahedral sheets. The isomorphous substitution of Mg2+ for Al3+ in the octahedral layer and Al3+ for Si4+ in the tetrahedral layer results in a net negative surface charge on the bentonite. This charge imbalance is offset by exchangeable cations (typically Ca2+ and Na+) at the bentonite surface, which ensures its good performance in adsorbing cationic contaminants by cationic exchange. These inorganic cations can be substituted for a cationic surfactant or hydroxyl-metal producing materials such as organobentonite and pillared bentonite [9].
Organobentonite is principally synthesized by intercalating surfactant molecules of various sizes and types into the interlayer space of bentonite by displacing naturally occurring exchangeable cations [10]. The organointercalated-modified bentonite, which changes the surface properties from hydrophilic to hydrophobic, proves to be an effective adsorbent for organic pollutants, such as dyes [11], trichlorophenol [12], bisphenol [13], and other environmental pollutants. Gomri et al. [14] demonstrated that the removal efficiency of Acid Blue 80 by two kinds of organobentonites was high, and the adsorption capacity was influenced by the surfactant alkyl chain length. The longer the alkyl chain surfactant, the higher the adsorption capacity it had. Recently, Yah et al. [15] have studied the capacity of a bentonite modified with cetyltrimethylammonium bromide to adsorb and remove four acid dyes from aqueous solutions. The removal ratios of all the acid dyes by the cetyltrimethylammonium bromide exceeded 88% under the experimental conditions.
In the present study, a raw bentonite (RB) was purified by NaCl and converted into a modified organobentonite using octadecyltrimethylammonium bromide (ODTMAB). The aim of this article was to examine the effectiveness of organobentonites in the removal of tartrazine from aqueous solutions. The adsorption capacity of the organobentonites for tartrazine was evaluated by investigating the effect of solution pH, contact time, and initial tartrazine concentration on adsorption properties. The adsorption kinetics, isotherms, and mechanism of tartrazine onto adsorbent materials were also studied.
2 Materials and methods
2.1 Materials
The starting material was a bentonite extracted from the Roussel site in Maghnia supplied by ENOF Company (Algeria). The cation exchange capacity (CEC) was 90 mequiv/100 g. The chemical composition of the bentonite was 69.4% SiO2, 1.1% MgO, 14.7% Al2O3, 0.8% K2O, 0.3% CaO, 1.2% F2O3, 0.5% Na2O, 0.2% TiO2, 0.05% As, and 11% loss of ignition [16].
The surfactant, obtained from Sigma-Aldrich, used for this study was ODTMAB (C21H46NBr; FW, 392.52). Tartrazine is an anionic dye, also known as Acid Yellow 23, with molecular weight 534.4 and molecular formula C16H9N4Na3O9S2. It was also purchased from Sigma–Aldrich. The molecular structure of tartrazine is shown in Fig. 1.
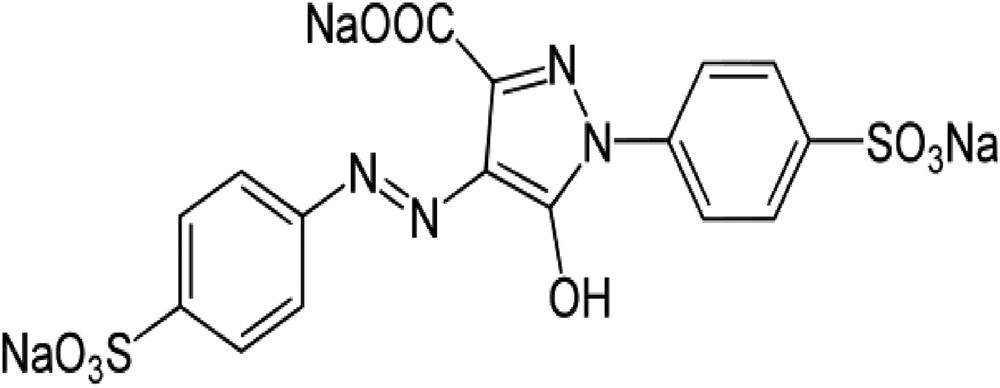
Chemical structure of tartrazine.
2.2 Preparation of the adsorbents
Ten grams of RB was washed with distilled water several times, purified by sedimentation, and then dried at 105 °C. The dried RB was converted to Na-bentonite (NaB) by treating three times with 100 mL of 0.1 M NaCl solution at room temperature for 24 h [9]. The obtained NaB was washed with distilled water thoroughly and then an AgNO3 test was carried out. The NaB was then dried at 105 °C and sieved to 2 μm. Two grams of NaB was initially dispersed in 100 mL distilled water using a magnetic stirrer for 24 h. A stoichiometric amount of the surfactant was added to NaB suspension and then stirred for 1 h at 70 °C. The CEC of NaB was 90 mequiv/100 g, which represents the potential loading of the bentonite with the cationic surfactant. For instance, 1.0 CEC correlates with the addition of 90.0 mequiv of cation per 100 g of NaB bentonite intercalated into the NaB. During the synthesis, a range of surfactant loadings, which would correlate with CEC values from 1.0 to 4.0 CEC, were prepared and labeled as 1CEC-NaB, 2CEC-NaB, 3CEC-NaB, and 4CEC-NaB. The mixtures were stirred and centrifuged at 10,000 rpm. All the organobentonites were washed to eliminate free bromide anions (as determined by AgNO3), filtered under vacuum, and dried at room temperature. The samples were ground and then sieved.
2.3 Characterization techniques
The point of zero charge (pHpzc) was determined according to the method described by Benhouria et al. [17]. Initial pH values (pHi) of 50 cm3 H2O solution were adjusted in the pH range of 2–11 using 0.01 M HCl or NaOH. Then, 0.05 g of adsorbent was added to each sample. The dispersions were stirred for 24 h at ambient temperature and the final solution pHs (pHf) were noted. The difference between the pHi and pHf values (ΔpH = pHi − pHf) was plotted against pHi, the point of intersection of the resulting curve with abscissa, at which ΔpH = 0, provided the pHpzc (figure not shown).
Fourier transform infrared (FTIR) spectroscopy analysis of the adsorbents was carried out in KBr pellets in the range of 400–4000 cm−1, with 4 cm−1 resolution using an SHIMADZU FTIR 8400 spectrometer.
The organobentonites were characterized by X-ray diffraction (XRD) analyses using a Bruker D8 advance diffractometer operating at 30 mA and 40 kV with Cu Kα radiation (λ = 0.15418 nm). Radial scans were recorded in the reflection scanning mode at an angle 2θ = 2°–80°. Bragg's law, defined as nλ = 2d sin 2θ, was used to compute the crystallographic dhkl for the examined clay samples.
Thermogravimetric analysis (TGA) of NaB and the organobentonites was performed using a TGA Q5000 V3.13 Build 261 (TA Instruments) at a heating rate of 10 °C/min from 25 to 800 °C in nitrogen gas.
The specific surface area of the bentonite samples was analyzed using the BET method. The determination of the surface area was based on isotherms of adsorption and desorption of nitrogen at 77 ± 0.9 K using an ASAP 2010 V5.03A. The samples were degassed at 200 °C for 2 h before BET analysis.
2.4 Adsorption experiments
The effect of pHi on tartrazine adsorption was evaluated using 10 mL of the dye solution and 10 mg of the adsorbent. The pHi was varied from 2 to 11 by adding a few drops of HCl and NaOH (0.1 mol/L).
To study the effect of contact time on the removal of tartrazine, batch experiments were conducted at 22 ± 1 °C and a solution pH = 7.23. For each experimental run, 10 mL of a tartrazine solution with initial concentration 200 mg/L, containing an adsorbent dose 10 mg, was agitated in a rotary shaker at a constant speed.
The isotherm adsorption experiments were evaluated at different initial concentrations of tartrazine ranging from 10 to 600 mg/L at an initial solution pH = 7.23. The amounts of tartrazine adsorbed onto the adsorbent, at equilibrium qe (mg/g) and at any time qt (mg/g), were calculated using the following relationship:
| (1) |
3 Results and discussion
3.1 Characterization of the adsorbents
XRD is one of the essential techniques to probe the structural geometry of organobentonites. The XRD patterns of RB, NaB, and organobentonites prepared with different surfactant loadings are shown in Fig. 2. The peaks at 2θ equal to 5°, 20°, 35°, and 62°, corresponding to the reflections hkl, (001), (110), (200), and (060), respectively, are characteristics of the NaB. In the NaB spectrum, the disappearance of some peaks related to impurities like quartz (Q) at 2θ = 26.7° and cristobalite (C) at 2θ = 21.5° is observed [18]. The basal spacing d001 of NaB (12.7 Å) is smaller than that of RB (14.9 Å), confirming the intercalation of Na+ cations into bentonite interlayer space. According to the literature [19], the basal spacing (d001) of organobentonites increases as the surfactant concentration does. The organobentonites prepared with 1CEC, 2CEC, 3CEC, and 4CEC show d001 values of 24.1, 38.2, 38.0, and 39.1 Å, respectively. The increase in the basal spacing of the prepared materials reflected an increasing amount of ODTMA into bentonite interlayer space [14]. It is well known that when the CEC is higher than that of the bentonite, that is, 1.5 to 4 CEC, a paraffin complex (>22) is obtained at higher excess of ODTMAB (Fig. 2).
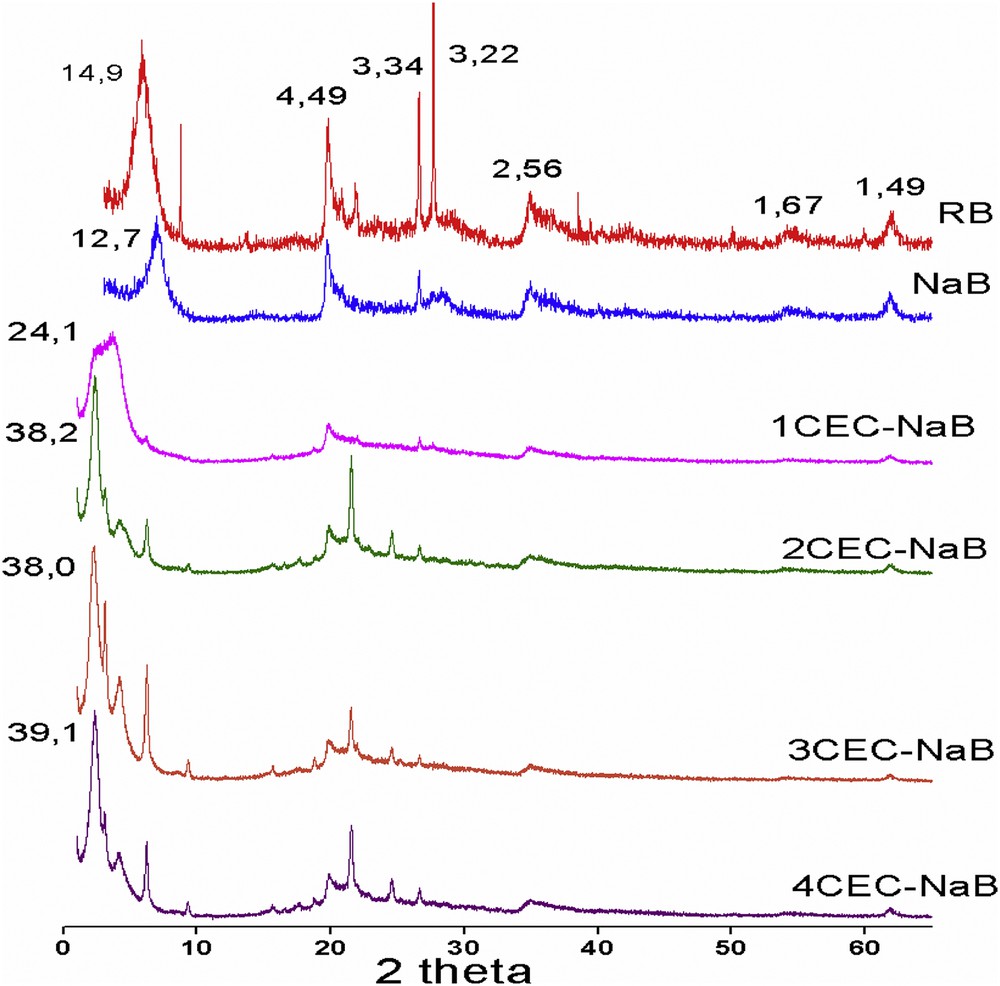
XRD patterns of RB, NaB, and organobentonites.
The FTIR spectra of RB, NaB, and organobentonites with different surfactant loadings (1–4.0 CEC) are shown in Fig. 3. Compared to that of NaB, the infrared spectra of organobentonites exhibit the characteristic peaks of NaB with two additional peaks in the range ∼2920 and ∼2850 cm−1, which are attributed to the CH2 antisymmetric stretching vibration (υas CH2) and symmetric stretching vibration (υsCH2) of intercalated surfactant with bentonite [20]. The bands at 3621 and 3413 cm−1 and the small sharp band at 1639 cm−1 from adsorbed water in the NaB, attributed to OH stretching and HOH bending vibrations, respectively, decrease in intensity as the surfactant loading increases in the organobentonites, indicating the removal of water molecules and the change in the hydrophobicity of the bentonite [19,21]. The band at 987 cm−1 assigned to SiO stretching vibration of NaB shifted toward higher frequency, at 999 cm−1 for organobentonite, as a result of increasing the interlayer space, which is in full agreement with XRD analysis. Xi et al. [22] suggested that the significant changes in SiO stretching frequency originated from the interaction between the surfactant molecules and siloxane (SiO) surface; the increase in stretching frequency of the SiO indicates an increased interaction between the positively charged hydrophilic heads of the surfactant and the negatively charged layers of bentonites. Also, as the loading of surfactant increases from 1.0 CEC to 4.0 CEC, υas (CH2) shifts from 2920 to 2916 cm−1 and υs (CH2) shifts from 2850 to 2840 cm−1. A band shift to lower wavenumbers is sensitive to the highly ordered all-trans conformations [22].
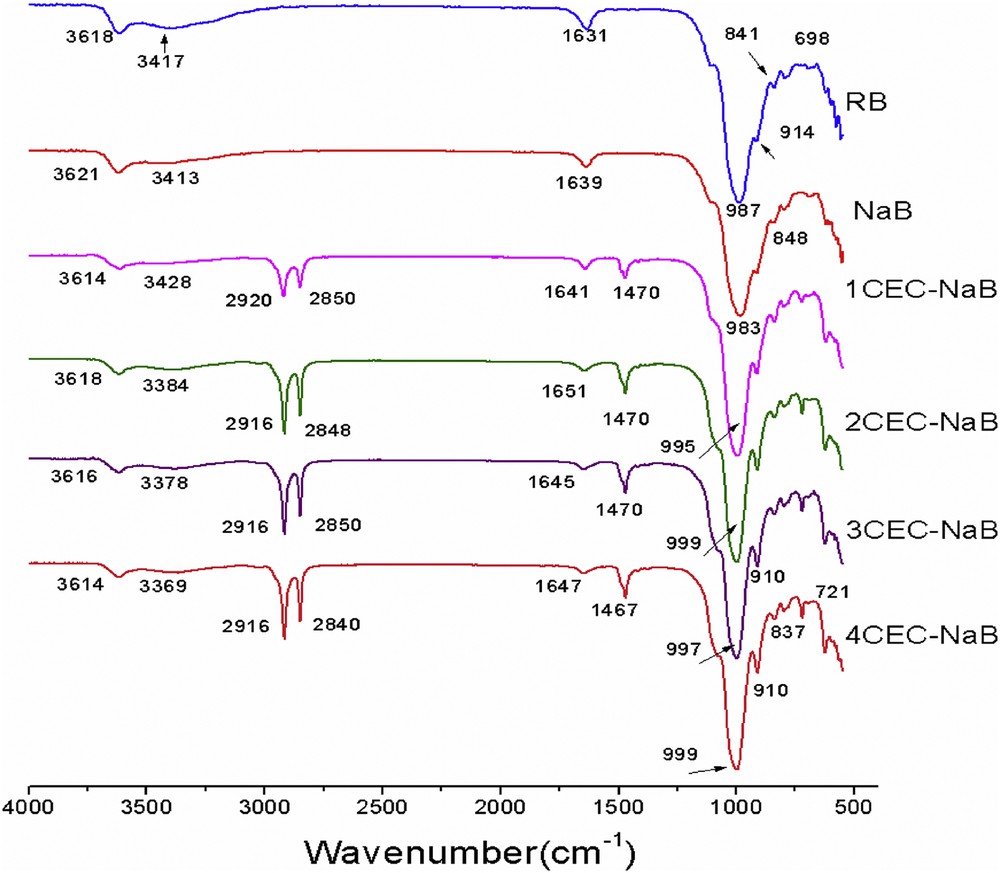
FTIR spectra of RB, NaB, and organobentonites.
The TGA and derivative thermal analysis (DTA) curves of NaB and organobentonites are shown in Fig. 4. The DTA curve of NaB (Fig. 4b) displays two peaks at 42 and 629 °C. The first corresponds to the loss of surface adsorbed water (free water) [23]. The second corresponds to dehydroxylation of the structural OH units in the bentonite mineral [24]. For the organobentonites, the exchange of ODTMA ions led to a single peak with a maximum at 261 °C, attributed to the decomposition of the surfactant [25]. The two peaks at 56 and 668 °C correspond to the loss of adsorbed water (hydrated water) and the structural hydroxyls, respectively [23]. The inset (Fig. 4a) of the TGA represents the percentage of the sample lost mass as a function of temperature. The first loss percentages for dehydration of adsorbed water were 5.7%, 3.3%, 2.4%, 2.9%, and 2.8% for NaB, 1CEC-NaB, 2CEC-NaB, 3CEC-NaB, and 4CEC-NaB, respectively. The experimental mass loss percentages of the surfactants were 20.9%, 33.3%, 37.2%, and 36.1% for 1CEC-NaB, 2CEC-NaB, 3CEC-NaB, and 4CEC-NaB, respectively. The decrease in the mass percentage of organobentonites in the temperature range 100–200 °C is mainly due to the partial replacement of hydrated cations Na+ by the surfactant. The structural hydroxyl loss percentages for NaB, 1CEC-NaB, 2CEC-NaB, 3CEC-NaB, and 4CEC-NaB were 3.0%, 4.5%, 3.9%, 3.7%, and 3.6%.
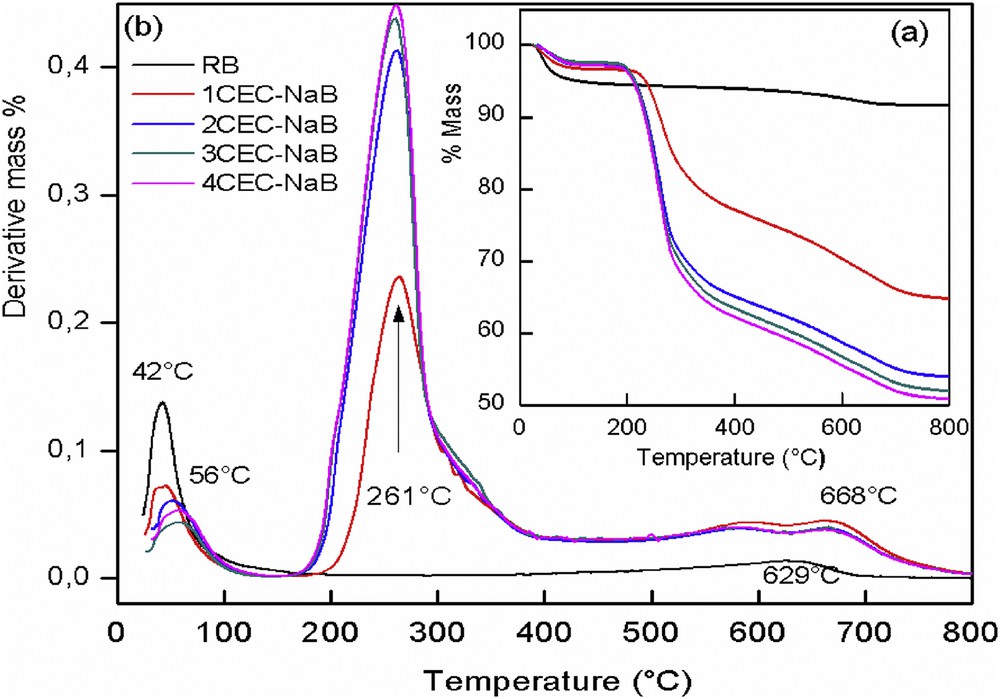
TGA (a) and DTA (b) results of the RB and the organobentonites.
The nitrogen adsorption–desorption results at −196 °C for the RB, NaB, and 1CEC-NaB samples are shown in Fig. 5. It can be seen that these isotherms are of type II of the Brunauer et al. [26] classification. After the exchange with the surfactant, the capacity of the organobentonites to adsorb nitrogen decreases with the increasing surfactant concentration. The results also show that the specific surface area and pore volume decrease from 87 to 9 m2/g and from 0.109 to 0.058 cm3/g for NaB and 1CEC-NaB, respectively, indicating that the surfactant with a large molecular size shares a part of interlayer space, resulting in inaccessibility of the internal surface to nitrogen molecules owing to the blocked pores [14].
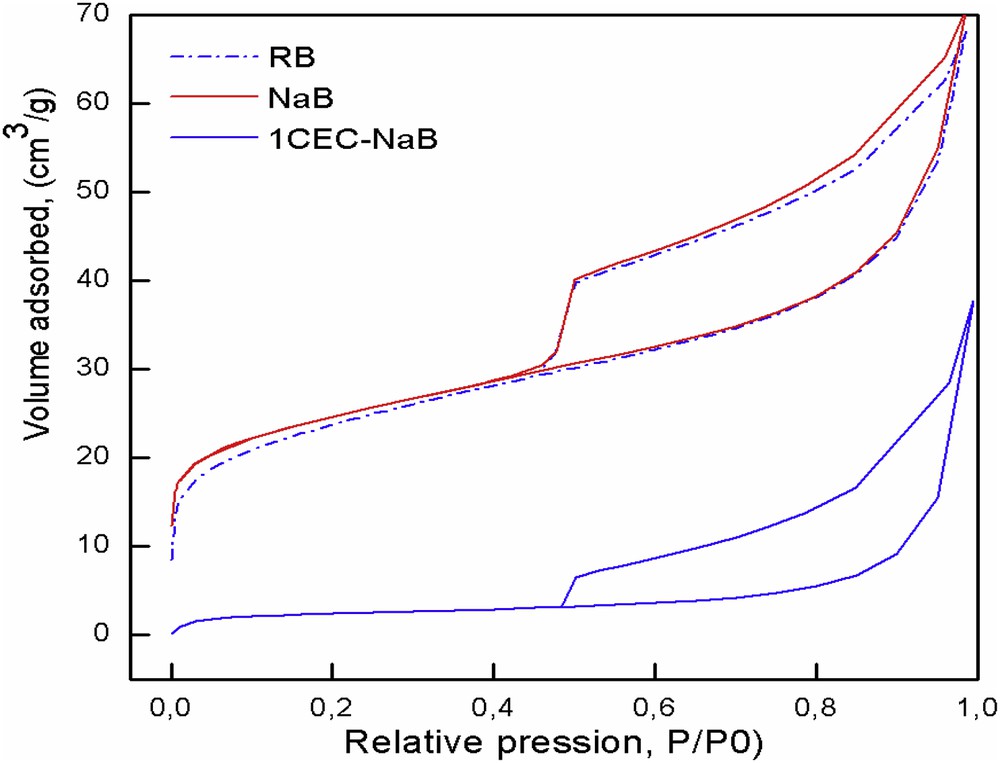
N2 adsorption–desorption isotherms of RB, NaB, and 1CEC-NaB.
3.2 Dye adsorption results
3.2.1 Effect of initial pH
The pH of the solution is a key factor as it controls both the surface chemistry of the adsorbent and solubility of dyes. Fig. 6 shows the amount of tartrazine adsorbed versus initial pH of tartrazine solutions. When the pH was increased, the adsorbed amount of tartrazine decreased for the four adsorbents. It was found that the maximum adsorption of tartrazine was achieved in acidic medium at pH 2. Similar results have been reported by Dotto et al. [27], Mittal et al. [3], Goscianska and Pietrzak [28], and Vargas et al. [29]. The pKa values of different attractor groups representing the tartrazine molecule (sulfonic acid group (SO3−–), carboxylate group (COO−–), and azo group (–NN) were 2.0, 5.0, and 10.86, respectively [30]. Thus, for pH solution >pKa, tartrazine molecules exist in an anionic form, and for pH solution <pKa, tartrazine molecules exist in a cationic form [28]. The pHpzc of organobentonites was found to be 6.8. At pH <pHpzc, the surface is positively charged () and favors the uptake of anionic tartrazine dye, and at pH >pHpzc, the surface is negatively charged ) [31]. At pH 2, the organobentonites would have more positively charged sites. Therefore, adsorption occurs between the positively charged surface and the anionic form of tartrazine . When the pH increases, the number of negative sites increases and the surface becomes negatively charged. Hence, the repulsion of anionic tartrazine dye with negative charges can be promoted, thus the adsorption capacity decreases with increasing pH of tartrazine solutions. As the pH of natural wastewater is usually in the range of 6–9, adjustment of its pH is not needed in view of practical applications.
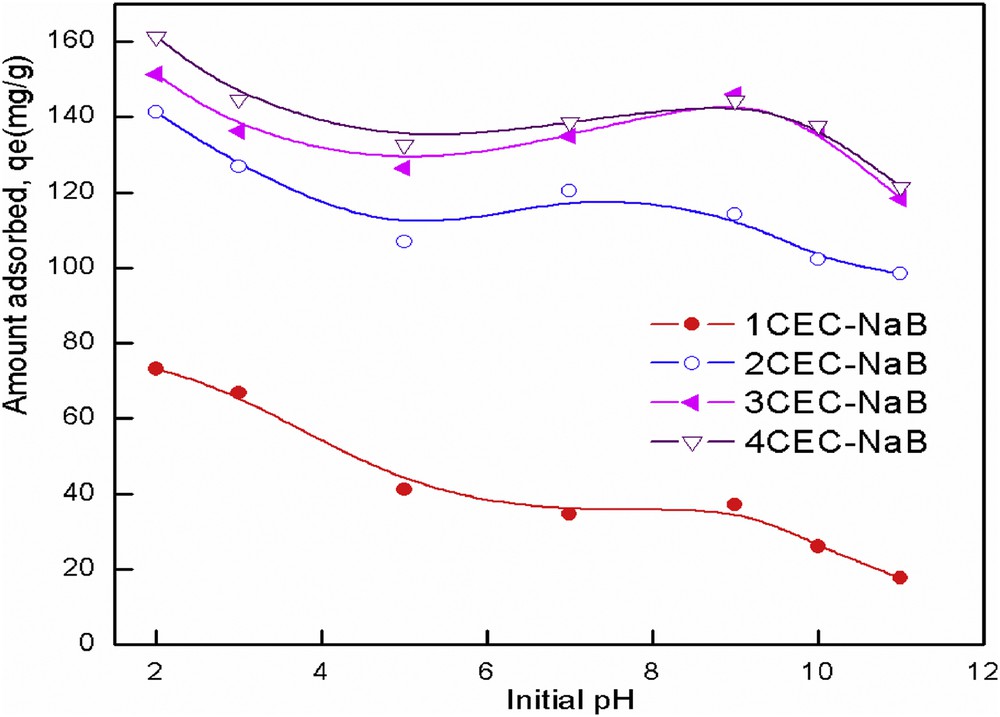
Effect of initial pH on tartrazine removal from solution by organobentonites.
3.2.2 Study of adsorption kinetics
The kinetic study was performed to predict the adsorption rate, which is very important in modeling and designing the process. The experiments of kinetics were carried out at the natural pH of the solution (pH = 7.23), an initial dye concentration of 200 mg/L, and at 295 K. The effect of stirring time on the adsorption of tartrazine on the organobentonites is shown in Fig. 7. The results showed that the adsorption of tartrazine onto organobentonites was a relatively fast process, indicating a high affinity between the tartrazine molecules and the organophilic surface of bentonite. The high efficiency in the uptake at an initial stage is due to the accessibility of adsorption sites of the adsorbent [32]. After a fast uptake, a transitional phase took place in which a slow removal rate occurred before reaching a constant value [33]. The time required to reach equilibrium was found to be 180 min. Hence, 180 min as a contact time was selected for all subsequent experiments.
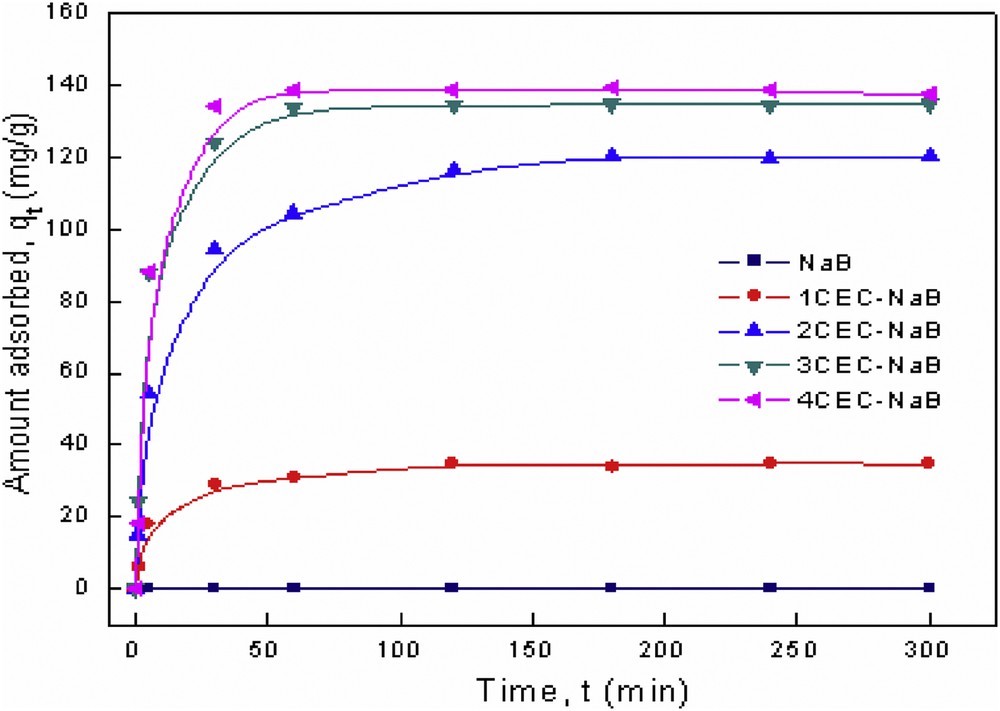
Kinetic adsorption data for tartrazine onto organobentonites.
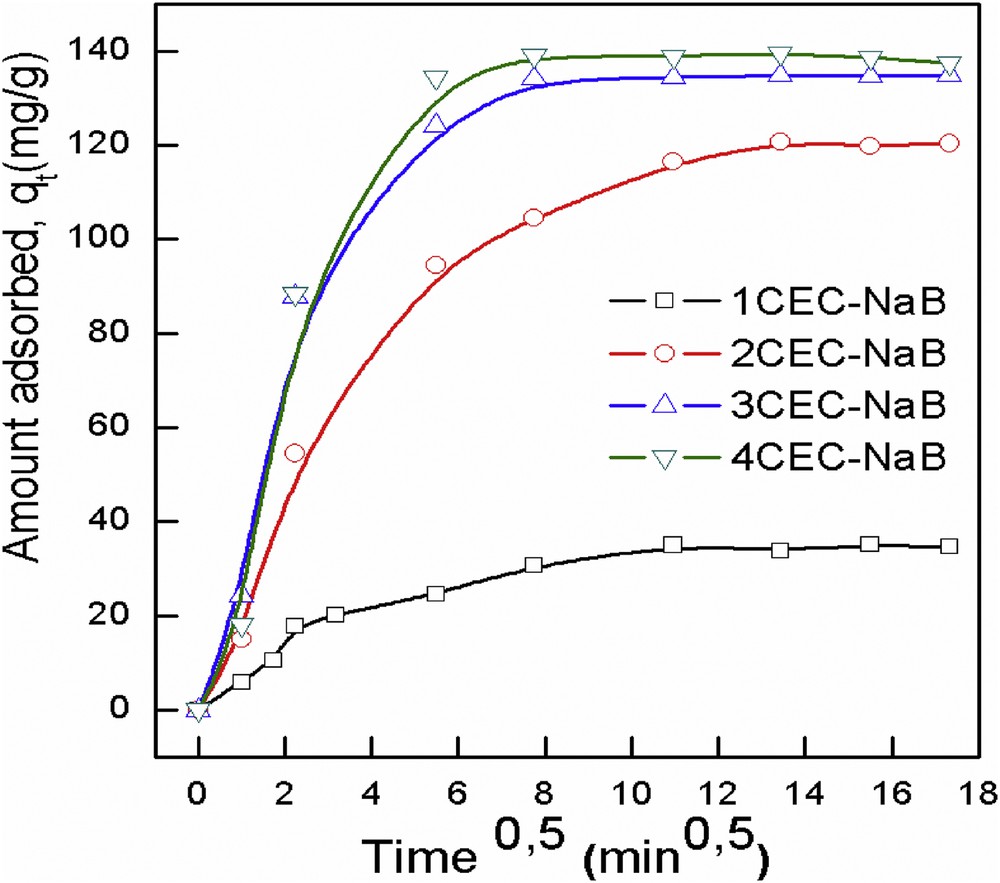
The time-dependent adsorption data (Fig. 7) up to the equilibrium point of the reaction are analyzed by the following equations, namely, the pseudo-first-order equation (Eq. (2)) [34], pseudo-second-order equation (Eq. (3)) [35], and the Elovich equation (Eq. (4)) [36], using the linear method of analysis:
| (2) |
| (3) |
| (4) |
The related parameters and correlation coefficients (see Table 1) can be obtained by the regression of the experimental data. Although the values of qe1 failed to predict the qexp values, the qe2 values are pretty close to those of qexp, indicating that the adsorption process of tartrazine onto the adsorbents fitted the pseudo-second-order kinetic model. Also, the correlation coefficients obtained from the pseudo-second-order equation (R2 = 0.999) were greater than those obtained from both the pseudo-first-order equation (R2 = 0.909–0.975) and the Elovich equation (R2 = 0.811–0.968). Thus, the pseudo-second-order kinetic model is well suitable to model the adsorption curves of tartrazine onto organobentonites. The goodness of fit of the pseudo-second-order kinetics confirms that a chemical adsorption, rather than a physical one, controls the adsorption rate of tartrazine. Similar results have been obtained with adsorption of tartrazine onto strongly basic polystyrene anion exchange resins [5] and activated carbon from alligator weed [37].
Kinetic parameters for the adsorption of tartrazine onto organobentonites.
| Models | Parameters | Initial concentration | |||
| 1CEC-NaB | 2CEC-NaB | 3CEC-NaB | 4CEC-NaB | ||
| First-order kinetic model | k1(103) | 14 | 19 | 81 | 113 |
| qe1cal | 20.3 | 71.5 | 105.6 | 120.3 | |
| R2 | 0.922 | 0.962 | 0.909 | 0.975 | |
| Second-order kinetic model | k2(103) | 3.8 | 1.0 | 2.7 | 2.9 |
| qe2cal | 35.7 | 123.9 | 137.0 | 139.9 | |
| R2 | 0.999 | 0.999 | 0.999 | 0.999 | |
| Elovich | β | 5.3 | 18.8 | 18.1 | 19.4 |
| α | 0.71 | 0.17 | 0.66 | 0.44 | |
| R2 | 0.966 | 0.968 | 0.846 | 0.811 | |
| Intraparticle diffusion | k3 | 1.82 | 6.58 | 6.61 | 6.91 |
| C | 9.6 | 29.0 | 47.0 | 47.2 | |
| R2 | 0.779 | 0.766 | 0.599 | 0.574 | |
| Experimental data | qexp | 35.1 | 120.6 | 134.2 | 138.6 |
3.3 Diffusion kinetics
The diffusion mechanism between adsorbent and adsorbate is not well elucidated by the aforementioned models. However, Weber and Morris [38] described the intraparticle diffusion mechanism between the solutes and particles, which can be formulated as follows:
| (5) |
Intraparticle diffusion kinetic plots of adsorption of tartrazine onto organobentonites.
3.4 Adsorption isotherms
An adsorption isotherm defines the relationship between the adsorbed amount of adsorbate and the remained adsorbate concentration in solution. The isotherms of the adsorption of tartrazine by organobentonites are shown in Fig. 9. The plots indicate a high affinity of the dye for organobentonite surfaces, particularly at low dye concentrations. Isotherms are characteristics of a typical L-type adsorption reaction that represents a system where the adsorbate is strongly attracted (generally by ion–ion exchange interactions) by the adsorbent, which reached a saturation value represented by a plateau of the isotherm [40]. It is noted that the adsorbed amount of tartrazine significantly increased with increasing the concentration of the surfactant, although these samples have a smaller surface area and a smaller pore volume than those of the unmodified bentonite. In this study, the Langmuir and Freundlich isotherm equations were used to model the experimental data. The Langmuir model [41] explains the monolayer adsorption process that occurs on the homogeneous adsorbent surface, whereas the Freundlich isotherm [42] presumes that the multilinearity of the adsorption process occurs on a heterogeneous surface. The linear form of Langmuir (Eq. 6) and Freundlich (Eq. (7)) isotherm models can be described by the following equations, respectively:
| (6) |
| (7) |
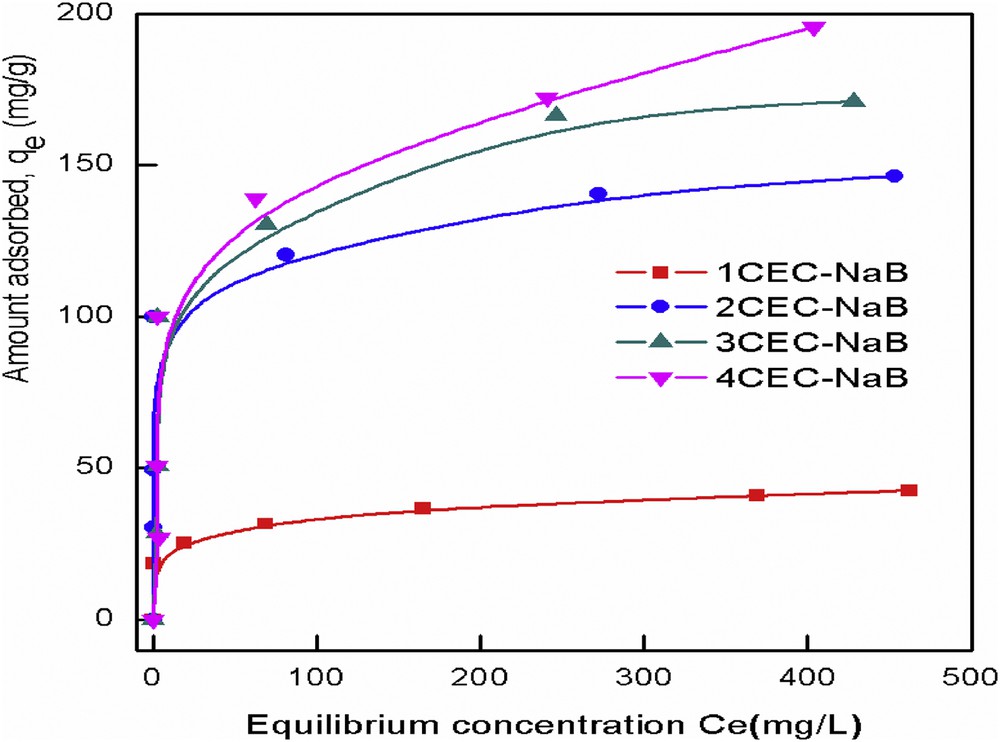
Equilibrium isotherms for adsorption of tartrazine onto organobentonites.
Isotherm constants for the removal of tartrazine onto organobentonites.
| Adsorbent | Langmuir | Freundlich | ||||
| qm | KL | R2 | KF | 1/n | R2 | |
| 1CEC-NaB | 43.2 | 0.039 | 0.996 | 21.3 | 0.104 | 0.936 |
| 2CEC-NaB | 145.8 | 0.232 | 0.998 | 72.6 | 0.116 | 0.982 |
| 3CEC-NaB | 175.8 | 0.074 | 0.998 | 29.5 | 0.312 | 0.917 |
| 4CEC-NaB | 201.0 | 0.0449 | 0.993 | 26.9 | 0.363 | 0.884 |
3.5 Comparison of adsorption capacity of organobentonites with other available adsorbents
In this study, the adsorption capacity of organobentonites was compared to other adsorbents as reported in Table 3. The adsorption capacity investigated in this work is higher than those provided by several adsorbents. However, the difference observed is that 4CEC-NaB exhibits much higher adsorption capacity for removal of tartrazine as compared to other reported adsorbents, mainly attributed to functional groups, pHpzc, surface area, and porosity of each sorbent. The adsorption of tartrazine on all of the adsorbents named in Table 3 was studied using acidic medium at pH range 2–4.5. According to Xu et al. [46], the textile wastewater, for instance, is generally at a pH of 8.0. An inconvenience of these adsorbents is, therefore, the adjustment of pH of the dye wastewater from alkaline pH to acid pH, giving the increase to added processing costs. Furthermore, the acidification procedure would raise the salinity, which is a new grave environmental problem. On the other hand, because of the high adsorption of tartrazine in alkaline media, organobentonites could be used directly for tartrazine wastewater treatment without adding supplementary cost and environmental issues.
Comparison of the adsorption capacity of organobentonites with various adsorbents.
| Adsorbents | Maximum adsorption capacity (mg/g) | References |
| Bottom ash | 12.6 | [3] |
| Deoiled soya | 24.6 | [3] |
| Hen feather | 64.1 | [43] |
| Chitin | 30 | [27] |
| Chitosan | 350 | [27] |
| Amberlite IRA-900 | 49.9 | [5] |
| Amberlite IRA-910 | 50.0 | [5] |
| Activated carbon of Lantana Camara | 90.9 | [31] |
| Polyaniline nanolayer composite | 2.47 | [44] |
| Cross-linked chitosan coated bentonite | 294.1 | [45] |
| 5Ag/CNTs | 84.04 | [28] |
| 4CEC-NaB | 201.0 | This study |
| 3CEC-NaB | 175.2 | This study |
| 2CEC-NaB | 145.8 | This study |
| 1CEC-NaB | 43.2 | This study |
3.6 Suggested mechanism
The limited adsorption of tartrazine by the unmodified NaB was greatly improved by converting the NaB to organobentonites with organic surfactant molecules. It is clearly seen that the modified NaB acts as effective adsorbent leading to the increase in the total organic carbon contents, which contributed to the increased hydrophobic lateral interaction. An increase in d-spacing values, that is, 24.1, 38.2, 38.0, and 39.1 Å, is observed with increasing ODTMA loadings, that is, 1CEC, 2CEC, 3CEC and 4CEC, respectively. It is well known that when the amount modification is higher than the CEC of the bentonite, that is, 1–4 CEC, a paraffin complex with d-spacing >22 Å would be formed [21]. According to this model, it seems that intercalated surfactants between the bentonite layers have a paraffin complex. It could be supposed that tartrazine may be adsorbed by anionic exchange with bromide ion from the ODTMAB molecule that was fixed into the interlayer of bentonite. In the modification process, ODTMA+ is first anchored in the interlayer of bentonite by cationic exchange. When the modification amount exceeded 1CEC, ODTMA molecule was adsorbed. The van der Waals hydrophobic interactions are suggested to operate in such cases and lead to bilayer of interdigitated alkyl chains. The bond for bromide ion could be an active site for dye adsorption. When the anionic exchange occurred, the counter-ion bromide was desorbed and replaced by the anionic dye [47].
4 Conclusions
In this study, textural and structural modifications of bentonite with ODTMA molecules were studied. The adsorption results of tartrazine on the unmodified and modified bentonite indicate that the chemical modification improves the adsorption capacity of the Na-bentonite. Organic modifications using ODTMA molecules induce a real pillaring in the bentonite interlayer space. The latter increases from 12.3 to 39.1 Å when the surfactant loading increases. Simultaneously, an important reduction in the specific surface area is obtained. However, the organobentonites exhibit high tartrazine adsorption capacities, which could be ascribed to a specific interaction between the alkyltrimethylammonium bromide molecules and tartrazine adsorbate. The result of the kinetic study showed that the adsorption capacity of the tartrazine onto the organobentonites was increased with contact time and surfactant concentration. The pseudo-second-order kinetic model depicted satisfactory the adsorption kinetics. Langmuir isotherm was found to be the best fit model for the adsorption of tartrazine. These results showed that the prepared organobentonites are excellent adsorbents for the removal of tartrazine from aqueous solutions without adjusting the pH of the dye wastewater.
Acknowledgments
S.S. (PhD student) acknowledges the technical support provided to this work by the “Institut de Chimie et des Procédés pour l'Energie, l'Environnement et la Santé, ICPEES ex LMSPC-UMR 7515 CNRS/Université de Strasbourg.” Special thanks are due to Dr. François Garin for his technical support.