

1 Introduction
Heterogeneous photocatalysis on semiconductors is known as a viable advanced oxidation process for the degradation of priority organic pollutants from air and water. Among many candidates for photocatalysts, TiO2 is almost the only material suitable for industrial use at present and also probably in the future [1].
In a typical photocatalytic process, a chemical reaction is induced when a semiconductor, which acts as a photocatalyst, is irradiated with photons of energy higher than or equal to its band gap energy (Eg) to produce photoelectrons and photoholes. Then, the reactants could be photoadsorbed at surface photoadsorption centers and further react with either photoelectrons (reduction) or photoholes (oxidations). These electrons transfer across the interface, which are at the center of TiO2 photocatalytic processes, decompose the pollutant through oxidation and reduction reactions [1].
Mixed-phase photocatalysts containing both anatase and rutile crystallites have been reported to display enhanced photoactivity relative to the single-phase titania. The reason for this is still not fully elucidated although some speculative explanations have been proposed. An improved charge carrier separation, possibly through the trapping of electrons in rutile and the consequent reduction in electron–hole recombination, is usually invoked to explain this behavior [2–4]. Surface trapping of holes together with lattice trapping of electrons has been also reported [4,5].
Degussa (Evonik), Aeroxide TiO2 P25, is a mixed-phase titania photocatalyst and is widely used because of its relatively high photocatalytic activity for a wide range of photocatalytic reactions. Its high photocatalytic activity is often attributed to a synergistic effect between its component phases, anatase and rutile [4,6,7]. This assumption, however, is a controversial topic, which is not yet fully elucidated [8,9].
To check the synergistic effect of an anatase–rutile mixture, such as Degussa P25, these crystalline phases were separated – following the methods adapted from the literature, thoroughly characterized, and tested in the photocatalytic oxidation of 4-chlorophenol (4-CP) from aqueous solution [8,10,11].
Chlorophenols are a particular group of priority toxic pollutants, because most of them are toxic and hardly biodegradable, and are difficult to remove from the environment [12]. 4-CP is a representative model of priority organic pollutants because it may be produced as a byproduct of the chlorination of the organic material or within the disinfection stage for drinking water production. It can accumulate in living organisms and result in negative effects including carcinogenicity and acute toxicity [12–14].
As a continuation of our previous work, in the present study, we sought to check whether a particular separation method designed to remove a specific crystalline phase (anatase or rutile) influences the properties of the other phase from the mixture or not. More precisely, we studied how the HF dissolution method designed to selectively remove the anatase affected the physicochemical and photocatalytic properties of rutile. In a similar way, the changes in the anatase properties were studied, after the H2O2/NH4OH treatment, initially used to remove rutile from the mixture.
After the application of the specific separation methods, commercial photocatalysts were thoroughly characterized and tested in the photocatalytic oxidation of 4-CP from aqueous solution.
2 Material and methods
2.1 Materials
Three TiO2 samples, from Sigma–Aldrich, were used in this study: anatase (denoted as An, Product No. 232033), rutile (denoted as Ru, Product No. 204757), and Degussa (Evronik) P25 (denoted as P25, Product No. 718467). The model pollutant 4-CP used to test the photocatalytic activity of TiO2 powders was also supplied by Sigma–Aldrich.
2.2 Treatment of crystalline phases
Selective dissolution of anatase and rutile was achieved by using the methods described in a previous article [8]. Briefly, the selective dissolution of anatase was accomplished by treatment with a 10% HF solution [10]. Rutile TiO2 was dissolved adopting a modified method, using a mixture of hydrogen peroxide (30%) and ammonium hydroxide (2.5%) solutions [11]. The commercial TiO2 samples used as starting materials and the samples issued from the selective dissolution treatments are summarized in Table 1, together with their names.
Summary of the TiO2 samples used in this study.
| Initial samples | Treatments | Treated samples |
| P25 | Treatment 1 (HF) | Ru (P25) |
| Treatment 2 (NH4OHH2O2) | An (P25) | |
| An | Treatment 1 (HF) | – |
| Treatment 2 (NH4OHH2O2) | An (3 h), An (6 h), An (12 h)a | |
| Ru | Treatment 1 (HF) | Ru (6 h), Ru (12 h), Ru (24 h)b |
| Treatment 2 (NH4OHH2O2) | – |
a Treatment for 3, 6, and 12 h.
b Treatment for 6, 12, and 24 h.
The main characteristics of Ru (P25) and An (P25), which are already discussed in detail in another study, are summarized in Table 2 [8].
Summary of the physicochemical characterization data for An (P25) and Ru (P25).
| Sample | DpXRDa, nm | SBETb, m2/g | DpTEMc, nm | Egd, eV | Raman lines, cm−1 |
| An (P25) | 41.5 | 64.2 | 30–40 | 3.43 | 143.9; 196.9; 395.9; 517.2 |
| Ru (P25) | 65 | 39.8 | 60 | 3.17 | 448; 611.5 |
a Crystallite size from XRD (Scherrer equation).
b Specific surface area from N2 adsorption isotherm (BET).
c Particle diameter from TEM images.
d Band gap from DR UV–vis spectra.
2.3 Characterization of the photochemical materials
All materials were completely characterized to obtain information on the composition, structure, morphology, and their optical properties. The samples were characterized by X-ray analysis using a Siemens D5005 diffractometer. The recording was done on the 2θ = 6–80° range, using a step of 0.02° (2θ) and a counting time of 23 s per step. Nitrogen adsorption measurements were carried out at −196 °C with an automatic Micromeritics ASAP 2000 instrument. The morphology of the powders was determined on a JEOL 2100 instrument, operated at 200 kV with a LaB6 source and equipped with a Gatan Ultra scan camera. The ultraviolet–visible (UV–vis) spectra and the bang gap values were obtained using a Shimadzu UV-2450 spectrophotometer, equipped with an integrating sphere (ISR-2200). Raman spectra (Stokes spectra) were obtained at room temperature using an HR UV 800 confocal scanning spectrometer (Horiba Jobin Yvon) equipped with a Peltier-cooled charge coupled device (1152 × 298 pixels) used for detection. The Raman scattering is excited using a 514.52 nm excitation wavelength supplied by an external, air-cooled, Ar+ laser (Melles Griot) through an Olympus high-stability BXFM microscope coupled confocally.
2.4 Photocatalytic tests
The photocatalytic activity of TiO2 powders was tested in the oxidation of 4-CP from water. For this purpose, a reactor equipped with a 9 W UV-A immersion lamp (with a spectral response between 350 and 400 nm and a maximum at 366 nm), air bubbling, and magnetic stirrer was used. The initial light flux, as determined by chemical actinometry using potassium ferrioxalate, was 1.25 × 10⁻⁴ E min−1. The TiO2 powder (200 mg L−1) was dispersed in 500 mL aqueous solution containing 4-CP (20 mg L−1) and stirred for 2 h under dark. Then, the UV lamp was turned on and the reaction was performed for 2 h. The 4-CP concentrations were analyzed by a 4-aminoantypirine standard method using a JASCO V-530 spectrophotometer.
3 Results and discussion
3.1 Physicochemical characterization of TiO2 photocatalysts
The X-ray diffraction (XRD) patterns recorded at high angle values for several selected samples are presented in Fig. 1. The commercial anatase (An) and rutile (Ru) samples showed well-defined, narrow, and intense specific diffraction peaks located at 25.4°, 37.8°, 48.0°, and 54.5° 2θ for anatase and at 27°, 36° and 55° 2θ for rutile. Although the XRD patterns for both An and Ru samples displayed peaks of the other crystalline polymorph, these were in negligible quantity, that is, less than 1% [8]. Degussa P25—a mixture of 78% anatase, 14% rutile, and 8% amorphous TiO2 [4,8]—presented less intense and broad peaks, for both anatase and rutile phases. This is because of the smaller size of the particles coexisting in Degussa P25 as compared with “pure” An and Ru samples. As anticipated, the low intensity “impurity” peaks completely disappeared after selective dissolution treatments. No other changes could be detected in the XRD patterns of the An- and Ru-treated samples. This fact confirmed the preservation of the crystalline structure of (1) An, after the treatment for the selective dissolution of rutile and (2) Ru, after the treatment for the selective dissolution of anatase. For P25 and An, no significant change in the size of the crystallites (Table 2) was observed. The values estimated from the corrected full width at half maximum of the reflections using the Scherrer equation were similar for treated and initial samples (the Scherrer formula is not applicable for the large Ru crystals).
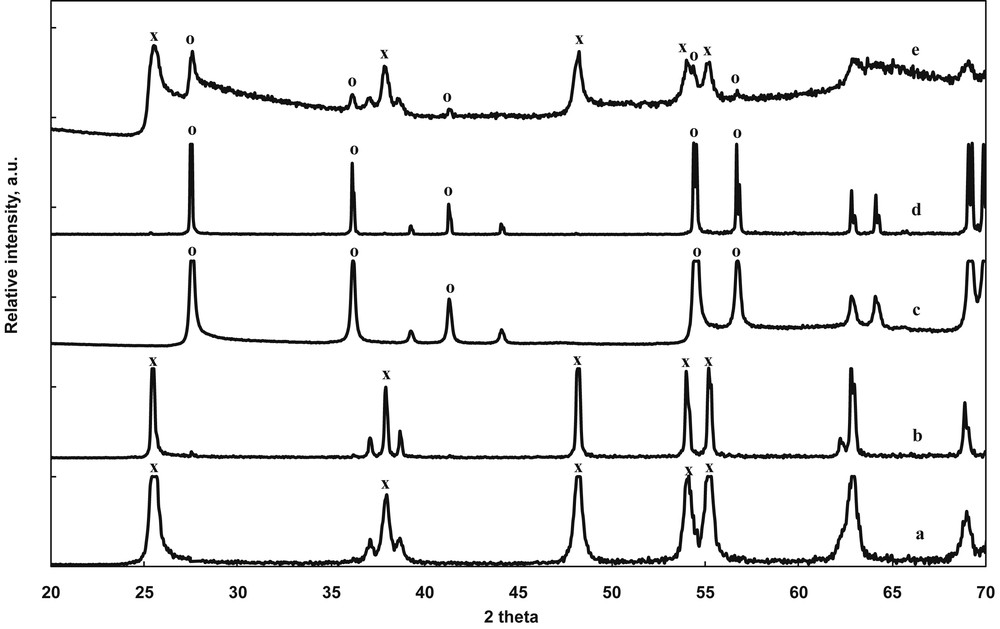
XRD patterns for TiO2 photocatalysts after selective dissolution treatments: (a) An (P25), (b) An (12 h), (c) Ru (P25), (d) Ru (24 h), and (e) P25. x, Anatase; o, rutile.
All samples displayed nitrogen adsorption–desorption isotherms of type II (Fig. 2), with a narrow hysteresis at high partial pressures, specific to nonporous materials. Thus, the surface areas are mainly external and correlated with the size of the particles. The narrow hysteresis indicates the presence of intercrystalline mesoporosity. Surface areas (SBET) determined using the Brunauer–Emmett–Teller (BET) method are presented in Tables 2 and 3. A slight increase in the SBET values with increasing treatment time was observed for both anatase (from 11.9 to 15.2 m2/g) and rutile (from 3.4 to 4.3 m2/g) phases.
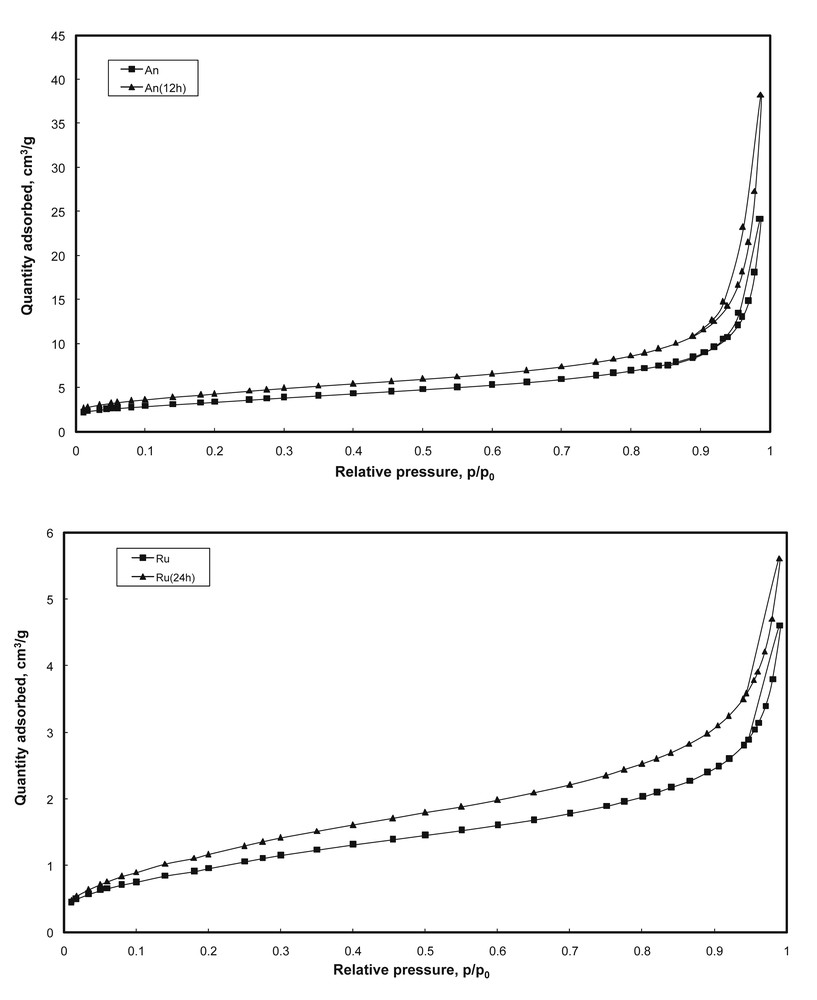
Nitrogen adsorption–desorption isotherms after selective dissolution treatments.
Specific surface areas of the photocatalysts derived from An and Ru.
| Photocatalyst | SBET, m2/g |
| An | 11.9 |
| An (3 h) | 12.0 |
| An (6 h) | 12.4 |
| An (12 h) | 15.2 |
| Ru | 3.5 |
| Ru (6 h) | 3.3 |
| Ru (12 h) | 3.5 |
| Ru (24 h) | 4.3 |
Transmission electron microscopy (TEM) was used to further inspect the particle size, crystallinity, and morphology of the samples. TEM bright field images of different TiO2 powders (An, Ru, An (12 h), Ru (24 h)) are displayed in Fig. 3. It can be clearly observed that An shows mainly spherical-shaped and nonaggregated particles, whereas rutile consists in particles of both spherical and rod shapes. Furthermore, it can be estimated that particle size in the An material is 100–300 nm for most of the particles (Fig. 3a), whereas the particle size in the Ru material is about 0.3–1.5 μm (Fig. 3c).
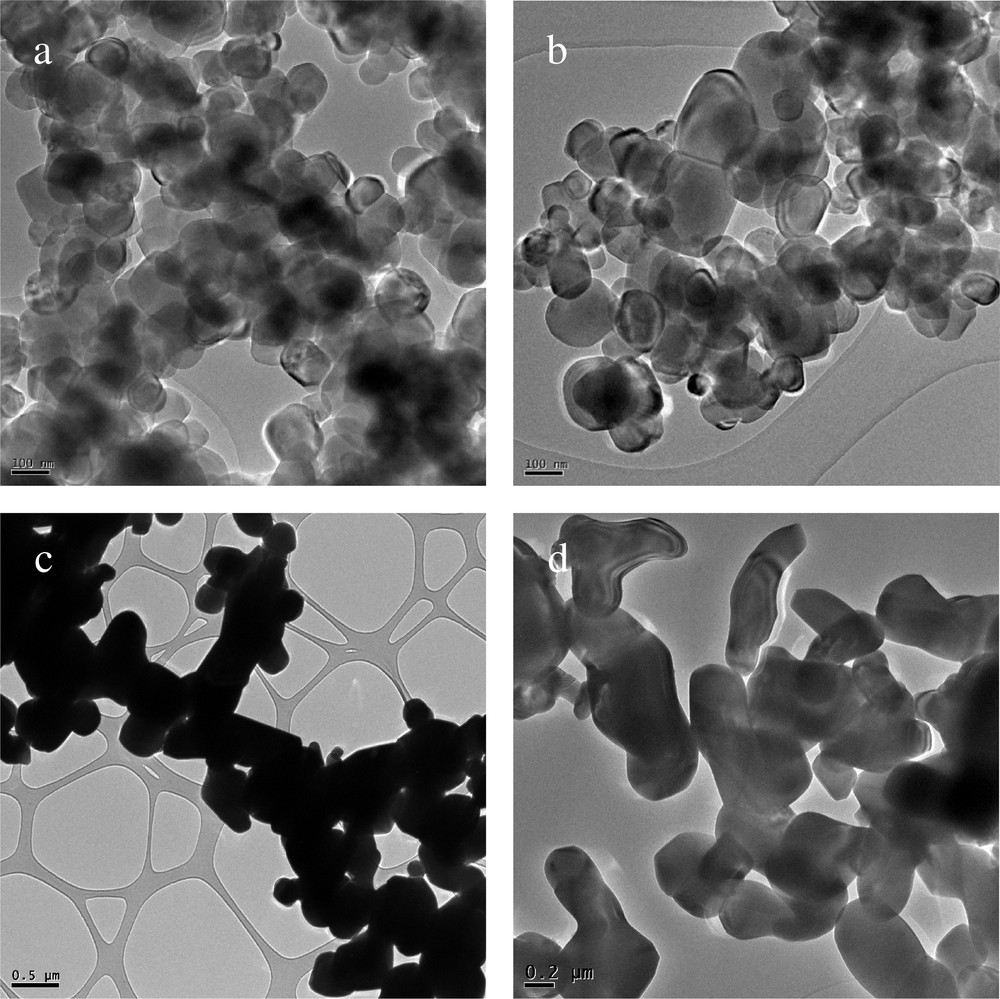
TEM images of (a) An, (b) An (12 h), (c) Ru, and (d) Ru (24 h).
Apparently, the isolation methods do not alter the morphology and the size of anatase (An (12 h); Fig. 3b) and rutile (Ru (24 h); Fig. 3d) particles.
However, the histograms showing the particle size distribution, depicted in Fig. 4, prove that there is a small change in the crystallite size for both An and Ru. Analyzing Fig. 4, it is evident that the treated samples (Fig. 4b and d) have predominantly smaller sized particles, by comparison with the commercial photocatalysts (Fig. 4a and c). Another observation is related to the small but noticeable differences observed in Table 2 among the particle diameters calculated from XRD (DpXRD) and High Resolution Transmission Electron Microscopy (HRTEM) (DpTEM). This is likely to be because of smaller number of particles that are averaged in the HRTEM method as compared to XRD. A similar discrepancy was reported by Ridley et al. [15].
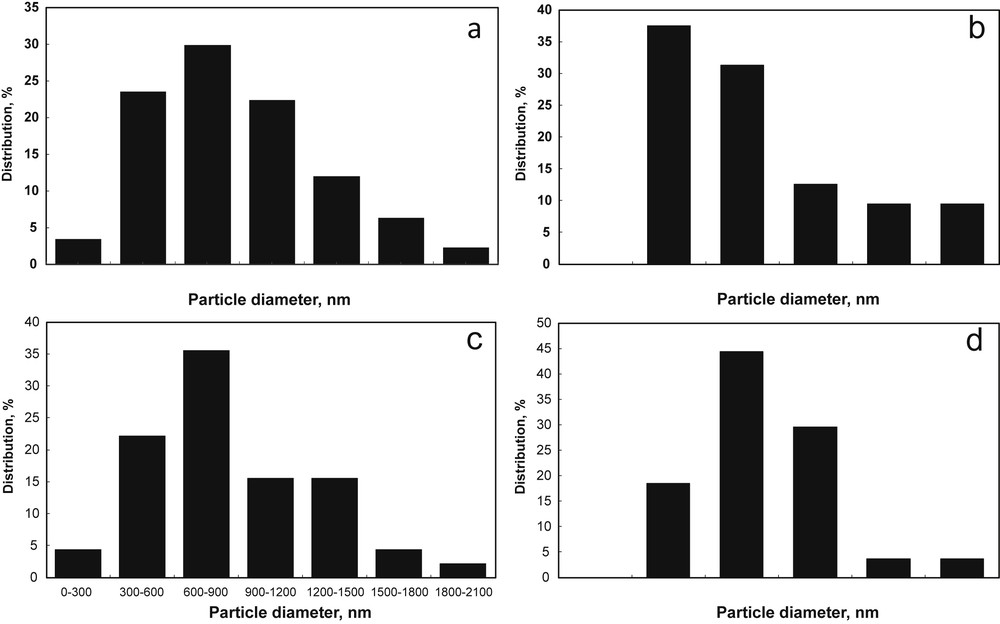
Particle size distribution as a function of diameter for (a) An, (b) An (12 h), (c) (Ru), and (d) Ru (24 h).
The band gap energies were calculated from the diffuse reflectance (DR) UV–vis spectra (Fig. 5) using both Tauc plots, after their conversion in Kubelka Munk absorbance units, and a derivative spectroscopic method, based on of spectra recorded in reflectance mode [8]. The results are presented in Table 4. By using the Tauc plots for the anatase phases, we found the values of the extrapolated band gap (absorbance level at zero or at background signal) in the indirect-allowed plot at about 3.33 eV (An) and 3.27 eV for An (12 h). In the case of rutile, extrapolated band gap values lied in the 3.0–3.15 eV range for both plots (i.e., square root or second power). A more accurate analysis of the spectra was performed using the first derivative method as described in detail elsewhere [8]. Although the Tauc plots seemed to indicate a shift in the Eg values for anatase, before and after treatment, the first derivative method did not confirm this trend. In this case, the treated semiconductors did not show any modifications in the band gap values as compared to the values of the starting samples.
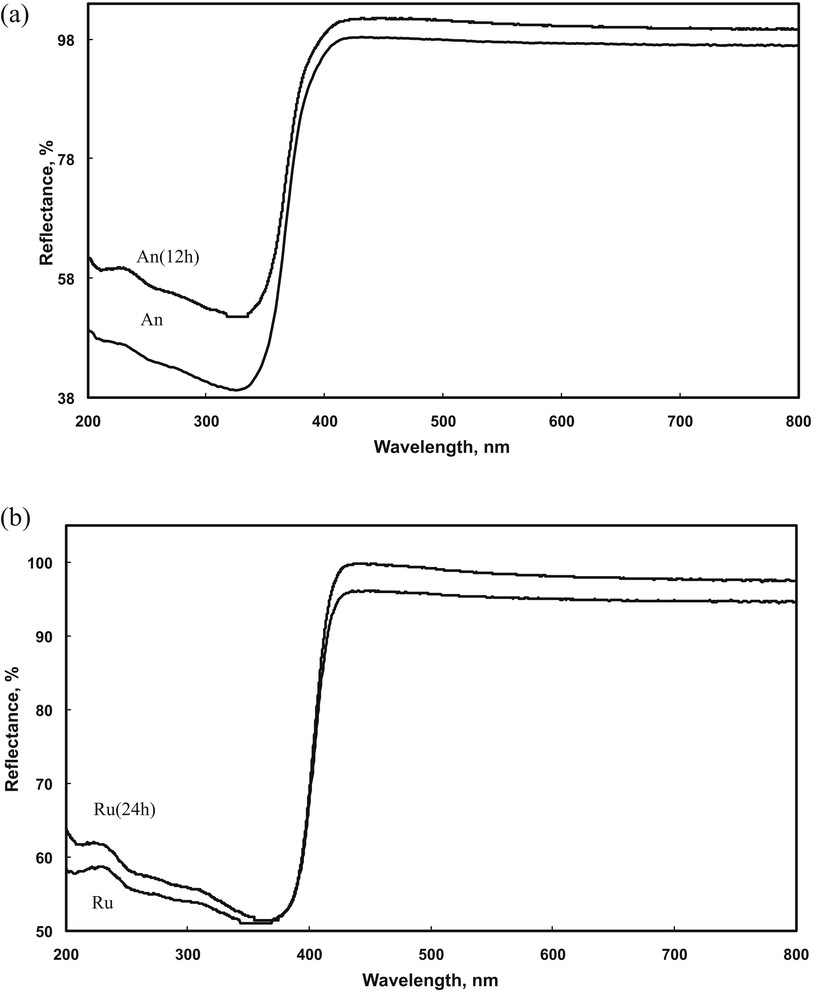
DR UV–vis spectra for selected anatase (a) and rutile (b) samples.
Calculated values for the forbidden energy band in the case of the treated photocatalysts.
| Sample | Eg (eV) | ||
| First-order derivates for the DR UV–vis spectra | Tauc graphs | ||
| Direct transition, n = 1/2 | Indirect transition, n = 2 | ||
| An | 3.38 | – | 3.33 |
| An (12 h) | 3.38 | – | 3.27 |
| Ru | 3.07 | 3.13 | 3.07 |
| Ru (24 h) | 3.07 | 3.13 | 3.07 |
Raman spectroscopy was also used to distinguish the TiO2 crystalline phases from the powder mixtures. The Raman spectra of the anatase samples indicate the presence of the specific lines at 143.9, 196.9, 395.9, 517.2, and 639.5 cm−1, associated with specific band frequencies (Eg), (Eg), (B1g), (A1g + B1g), and (Eg), respectively. The same observation is valid for the Raman spectra in the case of the rutile, which show the same characteristic frequency bands (B1g), (Eg), and (A1g), associated with frequencies 143, 448, and 6115 cm−1 [16].
From Fig. 6, it is evident that the positions of the Raman lines characteristic for each TiO2 phase remain unchanged after the selective dissolution treatments.
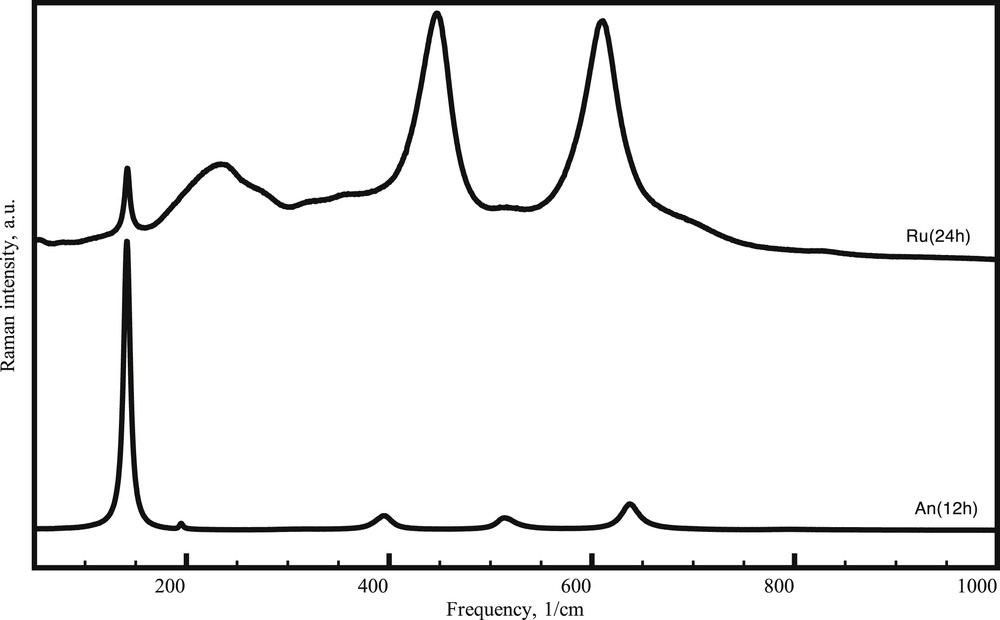
Raman spectra recorded for treated selected anatase An (12 h) and rutile Ru (24 h) samples.
3.2 Photocatalytic tests
The photocatalytic activity expressed by means of the removal efficiencies of 4-CP from aqueous solutions for different TiO2 samples is presented in Fig. 7a and b. For comparison, the results of an additional test using the commercial Degussa P25 sample are also shown. As expected, Degussa P25 performed better than the other photocatalysts. The smaller size of the TiO2 particles exposing a higher surface and the possible intervention of a synergetic effect between anatase and rutile are arguments that support this trend of the photocatalytic activity. In the early stages of the H2O2/NH4OH treatment, the photocatalytic activity decreases, especially at short reaction time. However, the sample treated for 12 h shows an almost identical photocatalytic performance as the original anatase sample. On the contrary, the photocatalytic activity of rutile increases for longer treatment periods. The observed changes in 4-CP removal efficiency could be partially attributed to the modifications of both particle size and accessible surface areas.
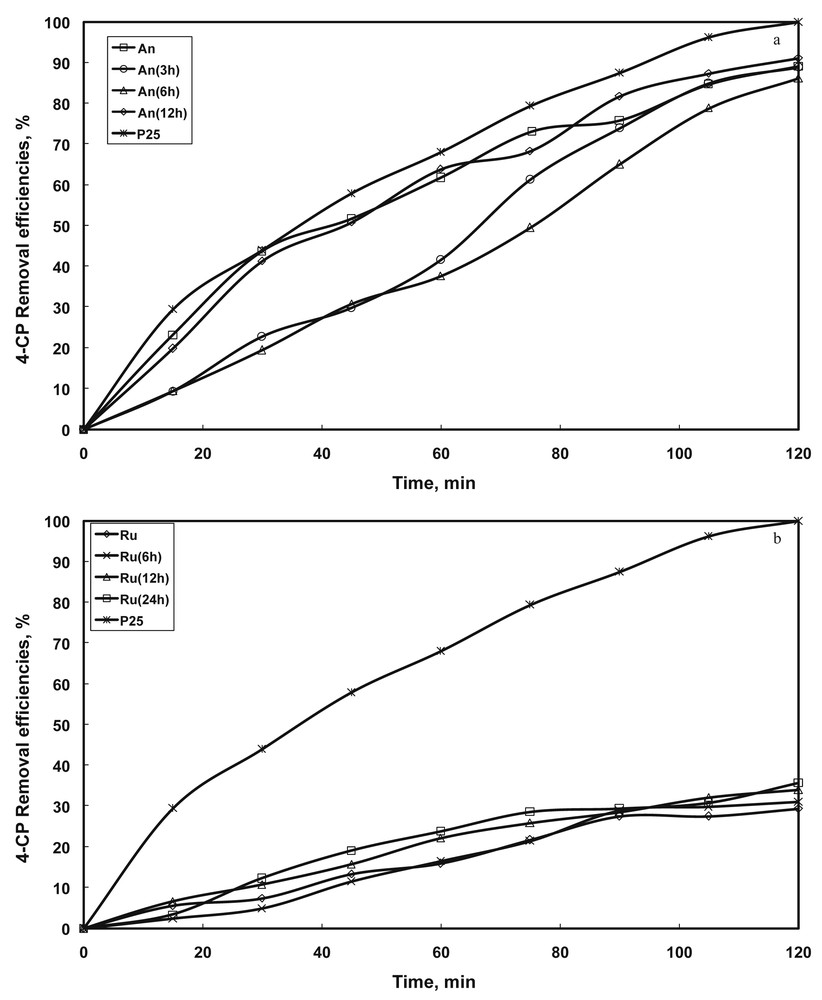
Influence of separation methods on the photocatalytic activity of the commercial catalysts (a) anatase, (b) rutile (conditions: T = 25 °C, V = 0.5 L, 500 rpm, pH = 5, C4-CP = 20 mg L−1, ).
The linear form of the logarithmic plot of 4-CP concentration versus time (Fig. 8) demonstrated that the photocatalytic reaction obeys the first-order rate law. However, this correlation is only formal and does not give any additional, pertinent information on the reaction mechanism. The values of the reaction rate constants calculated from the slopes of the lines in the logarithmic plots are summarized in Table 5.
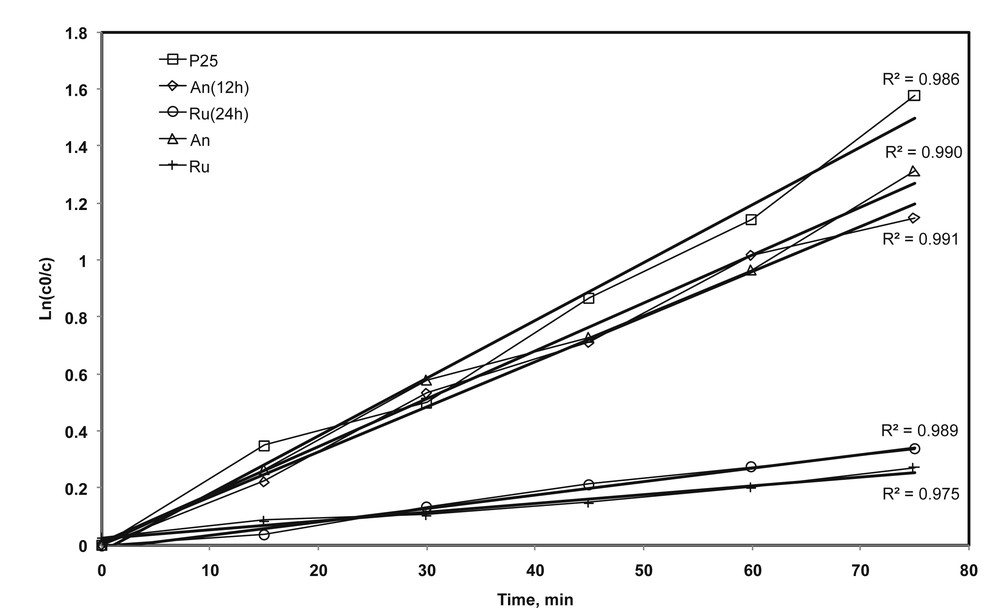
First-order linear fit for the color removal process with time and the corresponding coefficient of determination (R2) for selected samples.
Rate constants for color removal over different photocatalysts.
| Photocatalyst | k, min−1 |
| An | 0.016 |
| An (3 h) | 0.008 |
| An (6 h) | 0.008 |
| An (12 h) | 0.015 |
| Ru | 0.003 |
| Ru (6 h) | 0.003 |
| Ru (12 h) | 0.004 |
| Ru (24 h) | 0.004 |
An important finding is that NH4OHH2O2 treatment not only dissolves the rutile phase but also affects the photocatalytic performances of the anatase phase. In a similar manner, HF treatment, besides attacking anatase, alters the photocatalytic properties of rutile. These changes should be taken into account in studies dealing with the photocatalytic properties of reconstructed TiO2 phases.
4 Conclusions
After the selective dissolution treatments, the characterization data showed that the photocatalysts retain their characteristics in terms of band gap energies and do not show composition modifications, whereas their morphologic and textural properties were slightly altered, that is, surface areas increase from 11.9 to 15.2 m2/g for anatase and from 3.5 to 4.3 m2/g for rutile. The particle sizes were also slightly modified by the separation treatments: they decrease from 150–200 to 50–100 nm for anatase and from 600–900 to 500–800 nm for rutile. The photocatalytic activity of the initial and modified samples was tested in the removal of 4-CP from water. The NH4OHH2O2 treatment used to selectively remove the rutile phase produced a discernible change in the photocatalytic performance of the anatase phase. Similarly, the HF dissolution of anatase had also an influence on the photocatalytic properties of the rutile phase. Thus, the use of these selective dissolution methods to obtain the pure TiO2 phases from mixtures involves more extensive effects than the simple removal of the target phase.
Acknowledgments
This work was supported by the Romanian National Authority for Scientific Research, CNDI–UEFISCDI, Project no. 60/2012 (PNII Parteneriate), “Integrated System for Reducing Environmental and Human-related Impacts and Risks in the Water Use Cycle” (WATUSER).
Chevreul Institute (FR 2638), Ministère de l'Enseignement Supérieur et de la Recherche, Région Nord-Pas-de-Calais and FEDER are acknowledged for funding.