

1 Introduction
Mefenamic acid [2-(2,3-dimethylphenyl)aminobenzoic acid] is a nonsteroidal anti-inflammatory drug widely used in clinical applications [1]. It is well known that this drug exists in three polymorphic forms, namely, form I, form II, and form III [2]. The polymorphs of mefenamic acid exhibit different physicochemical characteristics and stabilities, that is, mefenamic acid form I is more thermodynamically stable and has a lower solubility than form II and form III [2–5]. The polymorphs of mefenamic acid are formed when the mefenamic acid with the same chemical composition crystallizes to more than one crystal structure or form depending on several factors [6]. Previous works have investigated the factors affecting the polymorphism of mefenamic acid, including the choice of solvent, temperature, supersaturation, stirring, and the presence of interfaces or impurities during the crystallization process [6–8]. The polymorphs of mefenamic acid differ according to the relative conformation of the carboxylic group in the molecular structure [2], which is highlighted by a rectangular shape in Fig. 1.
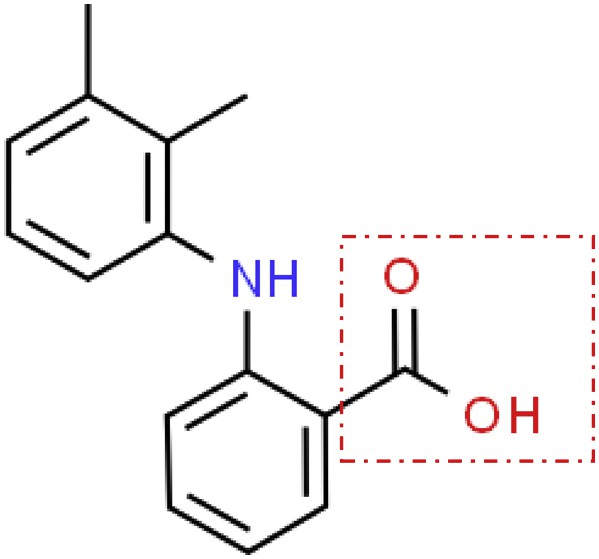
Chemical structure of mefenamic acid.
The choice of solvent during the crystallization process has been demonstrated to play a significant role in the polymorphic selectivity of the drug [9,10]. For instance, the cooling crystallization of mefenamic acid using ethyl acetate, ethanol, and N,N-dimethyl acetamide as solvents has been reported to produce form I crystals [6]. Meanwhile, form II and form III crystals are obtained through the cooling crystallization using N,N-dimethyl formamide (DMF) and cocrystallization experiments with adenine in DMF/methanol mixture, respectively [2]. It is compulsory for the drug molecules to be soluble in the solvent before nucleating into different polymorphs at high supersaturation levels. During the process, the solvent can either interact with the solute or adsorb onto the crystal faces at the molecular level through intermolecular solvent–solvent, solute–solvent, and solute–solute interactions [11,12]. A solvent molecule that has the ability to accept or donate hydrogen bond may form a hydrogen-bonding network with the solute molecule during the crystallization and can cause selective nucleation [13].
Insights into the hydrogen bonding network in the solution can be obtained through molecular dynamic (MD) simulations. Bernardes et al. [14] performed MD simulations using the DL_POLY 2.20 package for two polymorphic phases of 4′-hydroxyacetophenone. The work reported by Hamad et al. [15] revealed the presence of a hydrogen bond that led to the formation of different polymorphs of 5-fluorouracil. In our previous research, we investigated the intermolecular interactions through hydrogen bond formations between ethyl acetate and water using mefenamic acid MD simulations [16,17]. To the best of our knowledge, the study on the intermolecular interactions, that is, the hydrogen bonding that leads to the formation of mefenamic acid form II in DMF is yet to be reported.
In this work, the crystallization of mefenamic acid using DMF as a solvent was investigated using MD simulations and Fourier transform infrared (FTIR) spectroscopy. The aim of this work was to investigate the hydrogen bonding between the solute–solute, solute–solvent, and solvent–solvent interfaces, which control the self-assembly of the mefenamic acid molecules in DMF and cause the formation of mefenamic acid form II crystals. The FTIR spectra of the mefenamic acid/DMF saturated solution were recorded and compared with that of the mefenamic acid form II crystal to comprehend the simulation work. The crystals produced were further characterized by X-ray powder diffractometry (XRPD) and scanning electron microscopy (SEM) to determine the fingerprint and morphology, respectively.
2 Materials and methods
2.1 Materials
Mefenamic acid powder (98 wt % pure) and analytical grade DMF (99.9 wt % pure) were obtained from Baoji Tianxin Pharmaceutical Co. Ltd., China and Fisher Scientific, respectively. The materials were used as received.
2.2 Preparation of the saturated solution and mefenamic acid crystals
Mefenamic acid was added in excess into a glass vial containing 2 mL of DMF at 25 °C. The amount of mefenamic acid added was estimated based on the solubility data reported in the previous work [4]. The solution was continuously shaken at 300 rpm and 25 °C for 24 h in a temperature-controlled block (Eppendorf Thermomixer Shaker). This step is required to ensure the complete dissolution of mefenamic acid and to allow the solution to attain equilibrium [18]. After that, the solution was filtered under isothermal condition using a 0.45 μm polyterafluoroethylene (PTFE) syringe filter and stored in a glass vial for FTIR analysis.
The mefenamic acid crystal formed in DMF was prepared by the cooling crystallization method [19]. In this method, a saturated solution, at 50 °C, was prepared by heating a conical flask containing 8.60 g of mefenamic acid in 50 mL of DMF on a hot plate until a clear solution was obtained. The solution was allowed to reach room temperature by cooling naturally. The crystals produced were filtered, periodically dried in an oven at 60 °C, and weighed until a constant weight was achieved. The dried crystals were stored in screw cap glass vials for analysis.
2.3 FTIR spectroscopy
The FTIR spectra of the mefenamic acid and the saturated solution in the range of 500–4000 cm−1 were recorded and analyzed using a PerkinElmer ATR-FTIR Spectrometer (Frontier) and OMNIC software with an average of 16 scans, respectively.
2.4 X-ray powder diffractometry
The XRPD patterns of the mefenamic acid in a scan range of 5–50° (2θ) were determined using a Shimadzu XRD 6000 instrument equipped with a vertical X-ray goniometer and using Cu Kα radiation. The angle reproducibility was ±0.001° (2θ). The samples were gently ground in a mortar, pressed, and flattened softly onto an aluminum holder using a spatula and glass plate. The measurement conditions were set as follows: voltage of 40 kV, current of 30 mA, step size of 0.05°, and a scan rate of 3°/min in a continuous mode [6].
2.5 Scanning electron microscopy
The shape of the mefenamic acid was analyzed by SEM (TM3030 plus, Hitachi High-Technologies Corporation, Japan). The samples were placed on double-sided adhesive carbon tapes fixed to an aluminum mount and sputter-coated with gold using a Sputter Coater (Quorum Technologies Q300TD, Ltd., UK). The analysis was performed at a 1–3 kV voltage with a magnification ranging from 20 to 5000×.
2.6 Simulation method
The MD simulations were performed at 298 K and 1 atm by the method reported by Abdul Mudalip et al. with slight modification [16,17]. The Material Studio 5.5 (Accelrys, Inc., San Diego, USA) application, installed in an HP Z400 device, was used. The molecules of mefenamic acid and DMF, shown in Fig. 2, were sketched, optimized, and completed for energy minimization using the Smart minimizer tool. Subsequently, cubical simulation boxes with a periodic boundary containing pure DMF and a mixture of mefenamic acid and DMF molecules at random configuration were constructed using the Amorphous Cell [20]. The number of molecules and density shown in Table 1 were used during the configuration of the simulation box. The number of molecules was chosen within the range recommended by van Gunsteran and Berendsen [21]. The density of the mefenamic acid/DMF mixture was determined as follows:
| (1) |

Partial labeling of (a) DMF and (b) mefenamic acid molecule.
Number of molecules and density used in the simulation trajectory.
| Simulation trajectory | Number of molecules | Density (g cm−3) | Cubic cell size (Å3) |
| N,N-dimethyl formamide | 250 | 0.945 [30] | 31.75 × 31.75 × 31.75 |
| Mefenamic acid/N,N-dimethyl formamide | 25:250 | 1.009a | 34.16 × 34.16 × 34.16 |
Each simulation was conducted at a time step of 1 fs for a period of 250 ps in a thermodynamic ensemble of constant number of atoms, volume, and energy and continued for a period of 2000 ps in a constant number of atoms, pressure, and temperature ensemble. The COMPASS force field and the Ewald summation technique were used to address the long-range electrostatic interactions [20,22]. The temperature and pressure in the ensembles were maintained using a Nose thermostat with a Q-ratio of 1.0 and the Berendsen barostat with a decay constant of 0.1 ps, respectively [23,24]. Each pair of atoms in the final trajectory files, as shown in Fig. 2, was analyzed for various radial distribution functions (RDFs). The RDFs represent the distances between each pair of atoms, which averaged and normalized to the RDF of an ideal gas of the same density. The equation used to describe the RDF is given as
| (2) |
3 Results and discussion
3.1 Validation of the MD simulation method
The MD simulation method used in this work was validated by comparing the calculated density and RDF or g(r) plot of the pure DMF with those from the literature. The simulated density of the DMF obtained was 0.938 g cm−3, which is comparable to that from the literature (0.943 g cm−3) [24]. The calculated deviation was 0.53%. Lei et al. [25] reported about 6% deviation in the density values for the MD simulations of 150 organic structures. Because the deviation in the density value obtained in this work is quite small, it can be suggested that the MD simulation methods used in this work produced good results.
Fig. 3 illustrates the RDF plot of the pure DMF in comparison with that from the literature [26]. In general, the RDF patterns shown in Fig. 3 show a slight deviation from those in the literature, which is less than 10% deviation for the radius of the first peak. Beredsen [24] has reported the MD simulation for 216 molecules of DMF using the TINKER 3.9 molecular modeling package in the constant number of atoms, pressure, and temperature ensemble at 298 K and 1 atm with modified optimized potentials for liquid simulations-all atom. The first peaks observed for OF⋯HF, OF⋯CF, OF⋯HM, and OF ⋯ CM are at 2.75, 3.7, 2.9, and 3.75 Å, respectively. The peaks that are relatively short and broad indicate weak hydrogen bonding interactions between formyl oxygen and formyl hydrogen or methyl hydrogen. In addition, the broad peaks are associated with the presence of dispersion. The strength of the hydrogen bonding present in the structure of the pure DMF is indicated by OF⋯HF, as it shows the nearest-neighbor interaction.
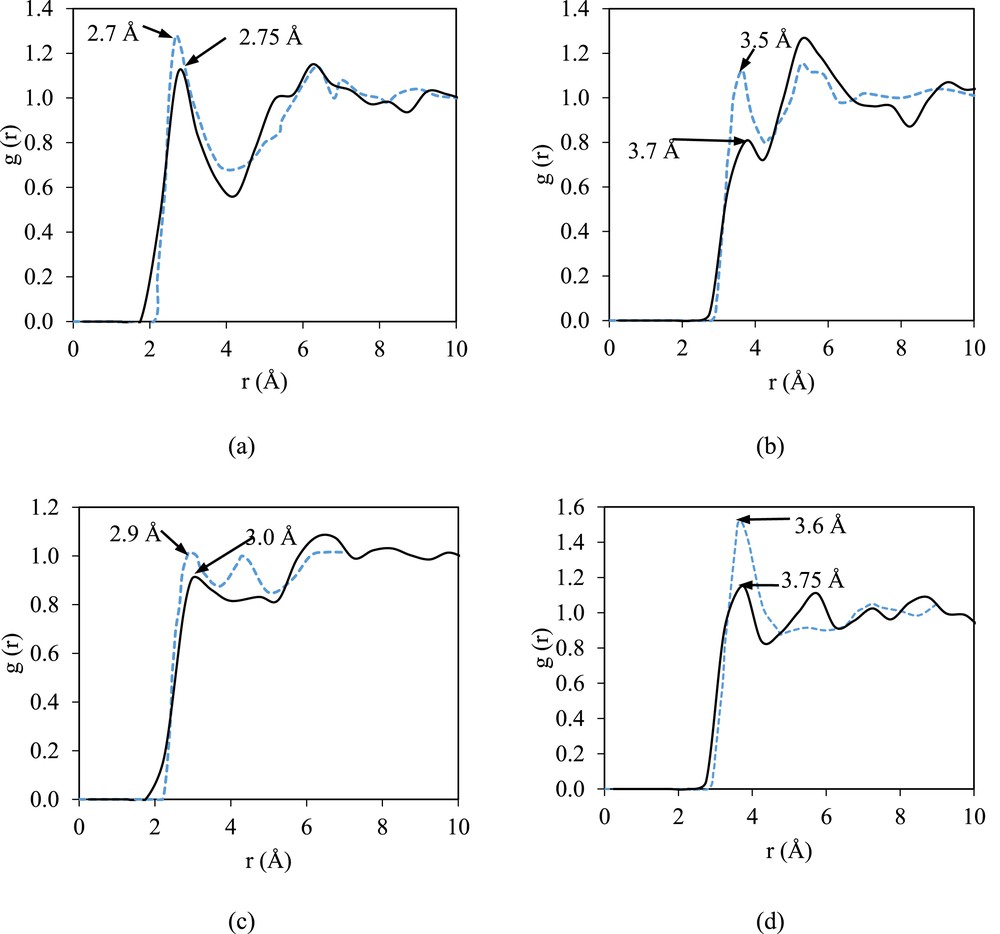
The g(r) plots of pure DMF: (a) intermolecular interactions in OF⋯HF, (b) OF⋯CF, (c) OF⋯HM, and (d) OF⋯CM in comparison with those from the literature [25]. The solid line represents the RDF obtained in this work, and the dashed blue line represents the RDF reported in the literature.
3.2 Intermolecular interaction in relation to polymorphism
Fig. 4 illustrates the RDFs of the solvent–solvent interaction in the mefenamic acid/DMF mixture. It can be seen that the RDFs are structured and show no clear difference with those of the pure solvent except for a slight change in the probability of g(r). For example, the probability of the OF⋯HF interactions in pure DMF is only 1.12, whereas in the binary system, it increases to 1.18. This indicates that the presence of the mefenamic acid solute in the binary system does not modify the long-range pure solvent structure. However, an increase in the intensity in relation to the solvent–solvent interaction in the binary mixtures is expected because of the differences in the self-assembly of the solvent molecules that are present in the binary solution but not in the pure solvent. These changes also reflect the initiation of the phase separation between the solvent molecules and solute molecules during the dissolution and before the formation of the solute cluster or nucleation [27].
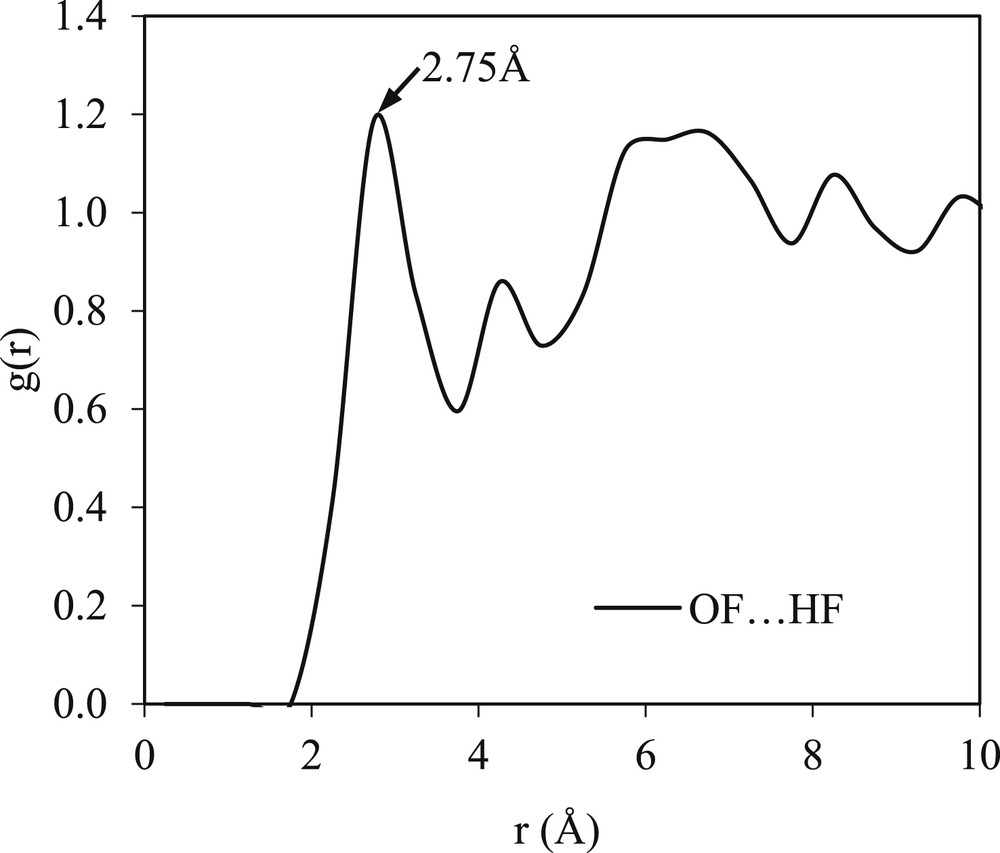
A g(r) plot of the solvent–solvent interaction present in the binary system of the mefenamic acid/DMF mixture.
Fig. 5 shows the RDFs of the mefenamic acid molecules with several targeted atoms in DMF representing the solute–solvent interactions. It is clear that the oxygen atom of the mefenamic acid molecule (O1MA) interacts strongly with the hydrogen atom of the DMF molecule (HF) (refer to Fig. 5a). The RDF of O1MA⋯HF shows a sharp peak at 2.75 Å, whereas that of O1MA⋯HF shows a broad peak at 2.75 Å. The interactions between O2MA and N1MA with the HF and HM of DMF are less structured. More structured RDFs are observed in OF⋯H15MA with a probability of 3.5 at 1.75 Å (refer to Fig. 5b). The peak falls and passes through a minimum value around 4.25 Å with an intensity of 1.30, which indicates fewer chances of finding atom OF and H15MA at this radial distance. The RDF pattern of OF⋯H15MA agrees with the structure of the liquid system modeled by Ingebrigtsen et al. [28], where the structure of the liquid system shows two intense peaks at different radial distances before the peaks drop and reach a plateau of 1.00.
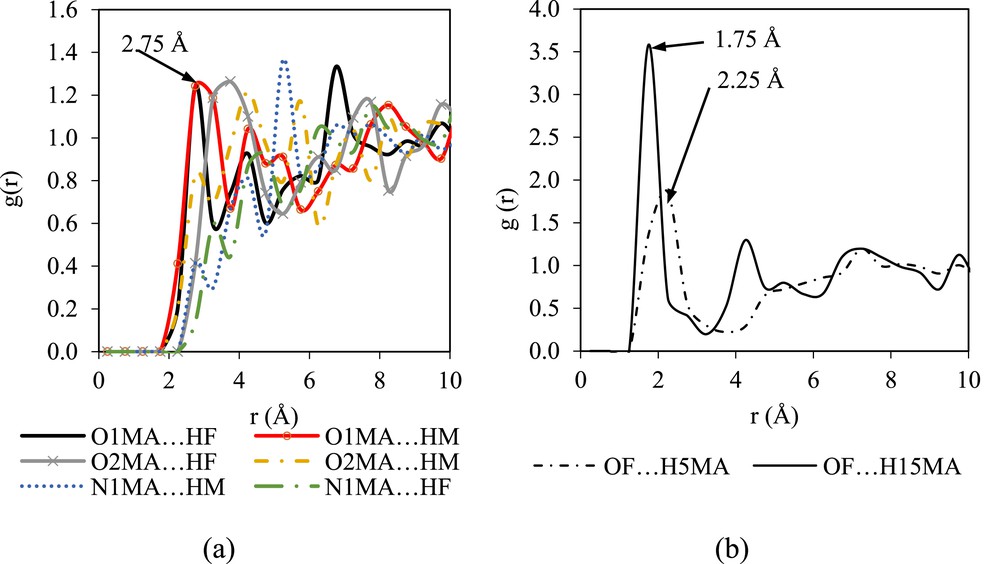
The g(r) plots of the atoms in mefenamic acid and the atoms in DMF molecules: (a) solute–solvent and (b) solvent–solute interactions.
The intermolecular interactions between the solute molecules in DMF are shown in Fig. 6. As can be observed in Fig. 6, the interaction between O1MA and H5MA is the strongest with a probability of 3.35 at a radial distance of 1.75 Å. According to Ref. [27], the g(r) peaks with sharp and nearest radial distances will contribute to significant intermolecular interactions during the prenucleation event. Therefore, it can be suggested that the intermolecular interaction between O1MA and H5MA plays an important role during the prenucleation of mefenamic acid form II in DMF. This behavior is different as compared with the nucleation of mefenamic acid form I, where the existence of a solute–solute interaction between O1MA and H15MA was reported [16].
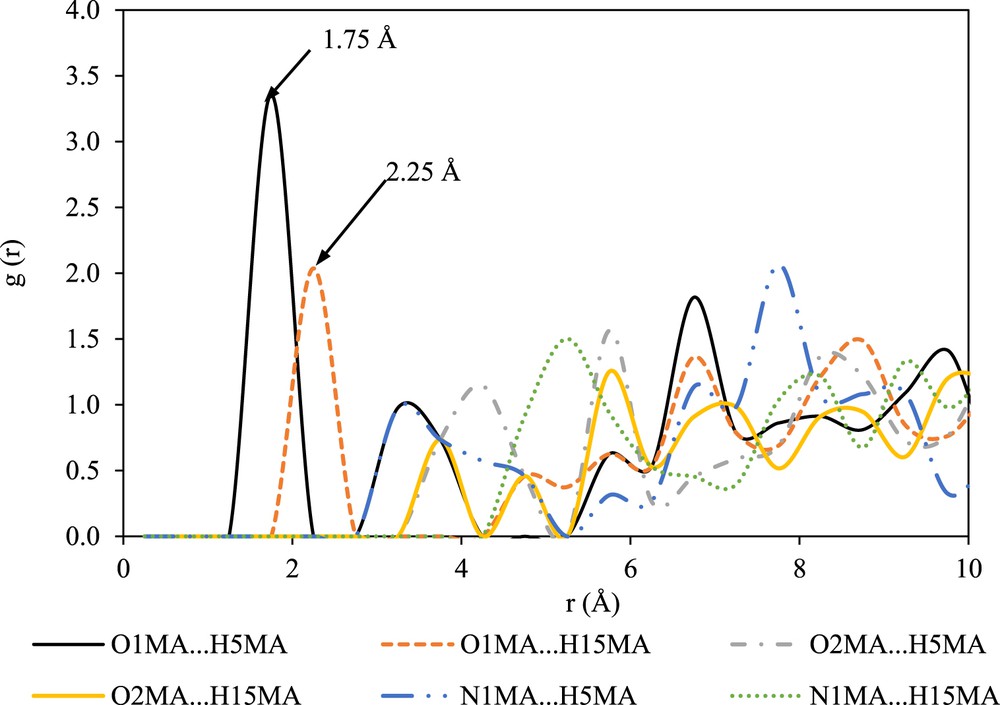
RDFs between the solute molecules in DMF.
3.3 FTIR spectroscopy analysis
The FTIR spectra of pure DMF, the saturated solution of the mefenamic acid/DMF mixture, and the solid mefenamic acid crystals are shown in Fig. 7a, b, and Fig. 8, respectively. The spectrum illustrated in Fig. 7a indicates the presence of CO and N–H chemical structures at wavenumbers of 1656 and 3500 cm−1, respectively, in the pure DMF solvent, which may contribute to the hydrogen bonding formation. The FTIR spectrum of the mefenamic acid/DMF solution in Fig. 7b shows a similar structure to that of the pure DMF. The slight change in the CO and N–H bonds in the spectrum implies the availability of mefenamic acid in the solution. In addition, the peaks are relatively more intense than those in the pure DMF spectrum. This indicates that the bonds exist with higher strength in the saturated solution of the mefenamic acid/DMF as compared with the case in pure DMF. This finding complements the behavior of the solvent–solvent interaction in the binary mixture of mefenamic acid/DMF.
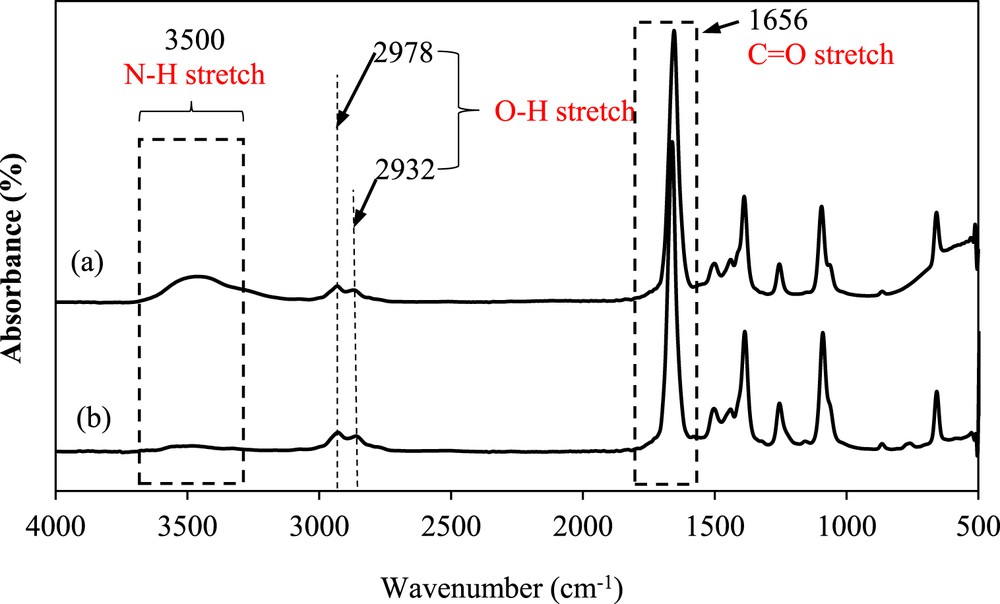
FTIR spectra of (a) pure DMF and the (b) saturated mefenamic acid/DMF solution at 25 °C.
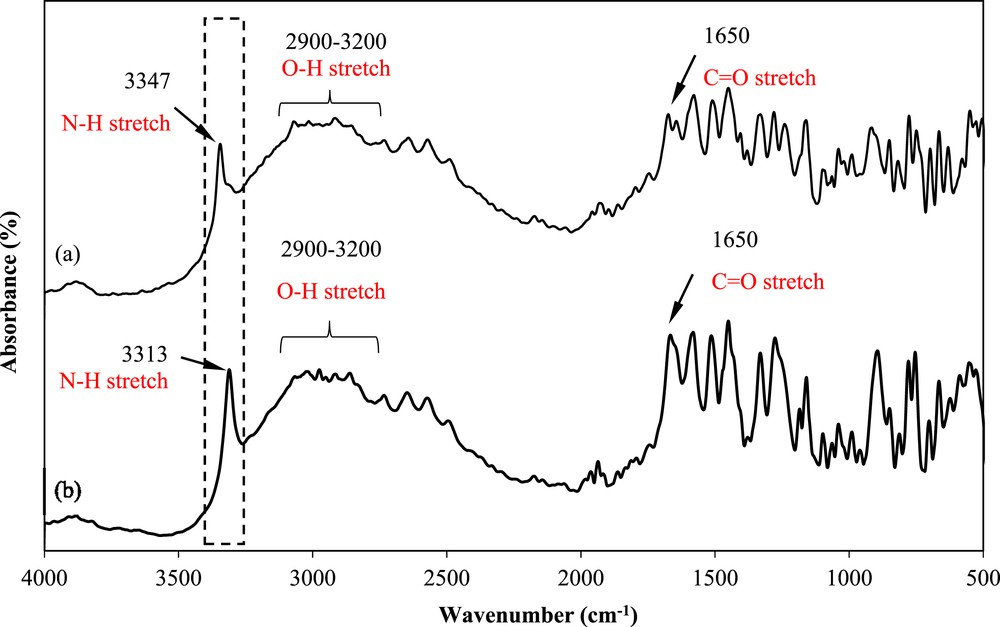
FTIR spectrum of the mefenamic acid solid crystals obtained from (a) DMF and (b) raw material.
Fig. 8 shows the FTIR spectra of mefenamic acid before and after crystallization in DMF. The spectra show the presence of CO and O–H in the same region, although a slight change in the N–H stretching wavenumber is observed. As highlighted with a rectangular box in Fig. 8, the mefenamic acid obtained from the supplier shows a N–H stretching band at approximately 3313 cm−1. This value corresponds to mefenamic acid form I crystals [29]. The crystals obtained using DMF as the solvent show a N–H stretching band at 3347 cm−1, which corresponds to form II crystals [29]. This finding shows that mefenamic acid form I was changed to form II after crystallization in DMF.
3.4 XRPD and crystal shape
Fig. 9 illustrates the fingerprint analysis of the mefenamic acid crystals and raw material in comparison with the results of Kato et al. [30]. They reported that the major XRPD peaks of form I were observed at 6.3°, 21.3°, and 26.3° (2θ), whereas those of form II were observed at 11.8°, 17.9°, 23.8°, and 25.6° (2θ) [30]. As shown in Fig. 9, the XRPD pattern of the mefenamic acid crystals concurs with form II because notable peaks at 11.8°, 17.9°, 23.8°, and 25.6°, as well as 9–12° (2θ), were observed. Conversely, the XRPD pattern of the mefenamic acid raw material concurs with the major XRPD peaks of form I at 6.3°, 21.3°, and 26.3° (2θ). This confirms that the mefenamic acid form I has been successfully crystallized to form II in DMF.
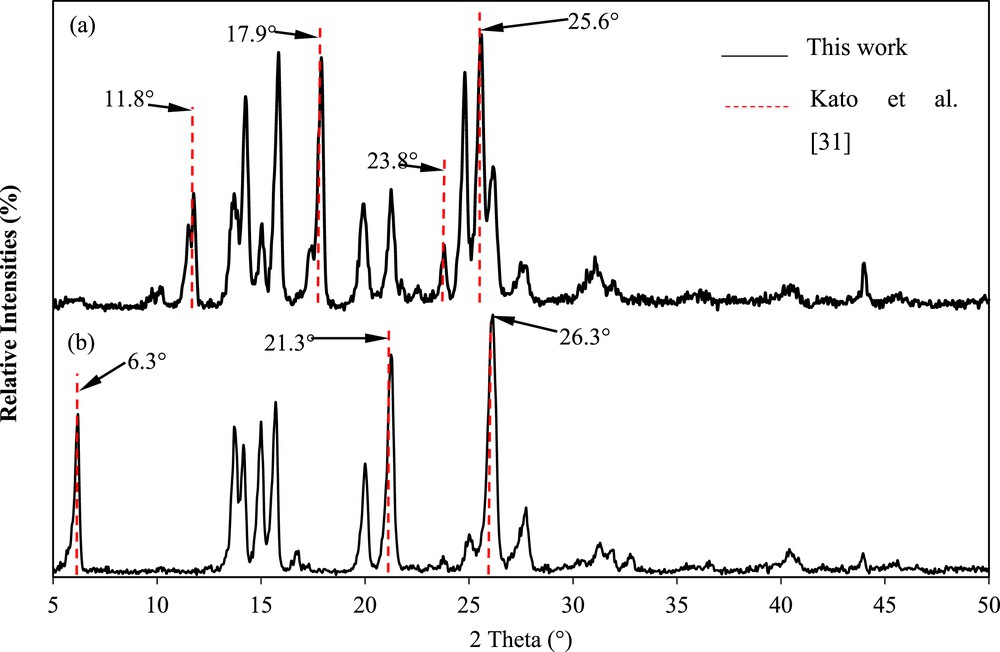
Comparison of the X-ray powder diffraction patterns of the mefenamic acid crystals (a) crystallized using DMF and (b) raw material in this work with the major peaks of the mefenamic acid form I crystals obtained by Kato et al. [30].
The shapes of the mefenamic acid before and after crystallization in DMF are shown in Fig. 10. It can be seen that the mefenamic acid raw material is needle-like in shape and changes to cubic or tubular shape when crystallized in DMF. Past works have reported that the crystallization of mefenamic acid in other solvents, that is, ethanol and ethyl acetate, produced needle-like crystals [6,19]. The difference in the crystal shape after crystallization in DMF is probably because of the different strengths of the solute–solvent interactions at the facets of the crystals. Lee et al. [31] reported the presence of –OH, –CO, and –C6H5 groups on the crystal facet (0 0 1) of the mefenamic acid. The –OH and –CO groups have significant hydrogen bonding abilities, and thus, may permit strong hydrogen bonding interactions between the facet (0 0 1) and DMF, which promote the growth on the crystal facet.
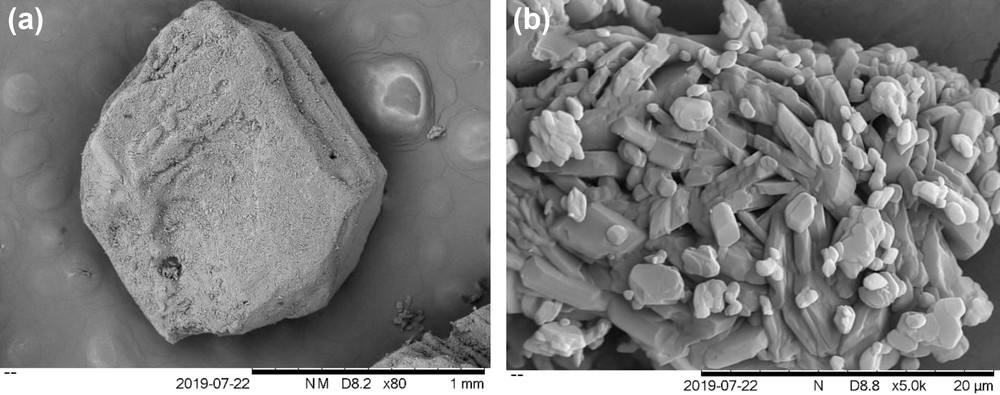
Scanning electron microscopic images of the mefenamic acid crystals (a) crystallized using DMF and (b) raw material.
4 Conclusion
This work was successfully performed to obtain insights into the molecular characteristics of mefenamic acid polymorphs crystallized in DMF. The simulation results suggested that the hydrogen bond plays an important role in determining the polymorphism of mefenamic acid crystals. O1MA⋯H5MA was identified as being responsible for the formation of the hydrogen motif in the mefenamic acid form II crystal when crystallized in DMF. The FTIR results revealed the existence of a hydrogen bond in the mefenamic acid/DMF solution, which contributed to the nucleation of the mefenamic acid form II crystals. Cubic-shape crystals were obtained and were confirmed as form II through SEM and XRPD analyses.
Acknowledgments
The authors acknowledge the financial support from the Ministry of Education Malaysia (Exploratory Research Grant Scheme RDU120607) and Universiti Malaysia Pahang (Internal Grant Research Scheme RDU150359).