


 CC-BY 4.0
1. Introduction
Spinel ferrites represent an important class of magnetic composite metal oxides containing Fe3+ cations and having the general formula MFe2O4, where M is a divalent cation such as Co, Ni, Fe, etc. or mixtures of these [1, 2]. These materials received special attention over the last decades because of their unique physicochemical properties such as excellent magnetic properties, high chemical stability and specific surface area, tunable size and shape, and the relative ease of modification [1].
The features of spinel ferrites can be modified or fine-tuned, according to requirement, by several strategies, such as varying composition, sintering temperature and/or duration, synthesis method, doping, etc. [3, 4, 5, 6]. Concerning the preparation strategies, numerous conventional (traditional ceramic processing methods) and non-conventional routes (sol–gel, microemulsion, sonochemical, electrochemical, etc.) were proposed for the synthesis of spinel ferrites [7]. Nevertheless, each of the synthesis strategies presents various advantages and drawbacks/limitations of its own [3, 7]. Among the synthesis methods of ferrites, the sol–gel autocombustion is versatile, simple and rapid method, where an important role is played by the combustion agent, which can be: citric acid, maleic acid, urea, tartric acid, sucrose, cellulose, etc. [8]. The role of the combustion agent is not only exclusively to provide enough heat required for spinel ferrite formation, but also to form stable complexes with the metal cations and to prevent the selective precipitation of the metal ions during water evaporation [9]. A critical aspect for sol–gel synthesis of spinel ferrites is the combustion process. Combustion is a process that is difficult to control and occurs when the gel is uniformly heated by an energy source, usually a hot plate, electric oven, or sand bath [4, 10]. One of the drawbacks of the sol–gel autocombustion method is that the mixture reaches the required quantity of heat in order to explode in a relatively long time (from tens of minutes to hours), depending on the energy source temperature; nature of fuel and cations presented in the system, or the cations:fuel ratios [8, 10].
To overcome this disadvantage, previous studies suggested the use of microwave energy to initiate combustion in order to reduce both processing time and energy consumption [11, 12]. Thus, it was found that irradiation with microwaves allows reaching high temperatures, ensuring the faster formation and crystallization of spinel powders, thereby favoring the release of important amounts of gases mitigating the particle agglomeration [11]. The fuel used for such processes is of crucial importance. Most of the studies proposed the use of urea [11, 13, 14, 15] as fuel for microwave-assisted combustion synthesis of various spinel ferrites. Nevertheless, fuels such as H. rosa-sinensis plant extract [16], L-arginine [17, 18], citric acid [19] or glycine [15] were successfully employed as well. However, to the best of our knowledge, no previous work has been dedicated to the study of the fuel nature over the features of the obtained spinel ferrites via sol–gel microwave-assisted combustion technique.
In the present work, we focussed on two of the most representative compounds of the spinel ferrites class: cobalt ferrite and nickel ferrite. The spinel ferrites were obtained by sol–gel microwave-assisted combustion technique using urea, citric acid and maleic acid as combustion/chelation agents. Structural, morphological, textural and magnetic properties of CoFe2O4 and NiFe2O4 nanoparticles were studied. Furthermore, the as-obtained materials were evaluated as adsorbents for water purification, a critical need of the modern society [20]. Thus, Orange-II dye was used to investigate the adsorption capacity of the spinel ferrites samples. This recalcitrant organic pollutant, with a chemical formula C16H11N2NaO4S, was selected as a model molecule of azo-dye groups because of its high toxicity. This pollutant, mainly used in the paper and textile industry, can generate serious health problems and hence it is critical to treat appropriately the waters contaminated with this dye [21]. The adsorption of Orange-II was evaluated via kinetics, equilibrium, and thermodynamic approaches.
2. Materials and methods
2.1. Materials
Co(NO3)2⋅6H2O, Ni(NO3)2⋅6H2O, Fe(NO3)3⋅9H2O, maleic anhydride, citric acid monohydrate, urea and Orange-II dye were purchased from Sigma-Aldrich. All products involved in this study were analytical grade and used without any purification step.
2.2. Synthesis of spinel ferrites
CoFe2O4 and NiFe2O4 were obtained by an innovative method combining the well-known sol–gel autocombustion synthesis and microwaves [17, 22]. In this respect, the metal nitrates were used as cationic sources and three different types of substances: maleic acid (MA), citric acid (CA), and urea (U) were involved as combustion agents/chelating. First, the required quantity of metal nitrates and fuel agent (molar ratio 1:3) was dissolved by stirring in distilled water. The obtained solution was magnetically stirred and heated to 353 K on a water bath until a viscous gel was formed. Afterward, in order to induce the autoignition, the gel of each sample formed was subjected to a non-conventional heat treatment—microwave at an intensity of 700 W. Exposure to irradiation was for 15 min. In order to achieve the spinel phase, the resulting powders were subjected to calcination at 623 K for 5 h with a heating rate of 15 degree⋅min−1. Samples were denoted CoMA, NiMA, CoCA, NiCA, CoU and NiU indicating the distinctive metallic cation and the combustion agent used.
2.3. Characterization methods
Structural characterization of the synthesized Ni and Co spinel ferrite was performed by X-ray diffraction (XRD) and Fourier transform infrared (FTIR) spectroscopy. The XRD patterns were registered in the 2𝜃 range 20–80° with a scanning rate of 0.02°/s, using a Shimadzu LabX 6000 Diffractometer with CuK𝛼 (𝜆 = 1.5406 Å) radiation. Based on the registered XRD patterns the mean crystallite size values were calculated by Debye–Scherrer and Williamson–Hall equations ((1) and (2), respectively):
| (1) |
| (2) |
FTIR spectra were recorded in the range 400–4000 cm−1 with a resolution of 2 cm−1 by using a Bruker Vertex 70 FTIR spectrometer.
The morphology of Ni and Co spinel ferrites was examined by Hitachi High-TechHT7700 Transmission Electron Microscope (TEM) registering micrographs while being operated in high-contrast mode at 120 kV accelerating voltage. The samples were ground in ethanol solution, and subsequently the mixture was subjected to ultrasound for 30 min. From the ethanol dispersion of powdered samples drops were placed on cooper grids. The cooper grids were then dried overnight in an oven at 333 K.
The textural properties of synthesized Ni and Co materials were investigated on a Nova 2200e Quantachrome instrument. All samples have been degassed for 2 h under high vacuum at room temperature. The specific surface area (SBET) was estimated from nitrogen sorption data applying the Brunauer–Emmett–Teller (BET) equation, the total pore volume was taken at P∕P0 = 0.95. The pore size distributions (PSDs) were estimated from the adsorption–desorption isotherm using the Barrett–Joyner–Halenda (BJH) equation.
Magnetic measurements of the studied ferrites were acquired, at the ambient temperature, by using a vibrating sample magnetometer (VSM) of type Lake Shore model 8607. Before each measurement, the samples were demagnetized in alternating field.
2.4. Assessing of adsorption performance
The concentrations of Orange-II dye in aqueous solutions were analyzed using UV–Vis spectrophotometer (Hitachi U-2910). To this end, the measurements of the absorbance were taken at the wavelength of 𝜆max = 485 nm.
The spinel ferrites produced were employed as adsorbents for the removal of Orange-II dye from synthetic wastewaters using the batch technique. In this respect, a sorbent dose (SD) was added to 50 mL of working solution. The samples thus prepared were stirred at 240 rpm by using an orbital-shaker incubator (BIOSAN ES-20/60) with temperature control. The adsorption tests were performed at naturally occurring pH (pH 5.0 ± 0.2) and at different temperature levels (i.e. 300 K, 313 K and 333 K). At the end of the process, the loaded adsorbent was separated from the liquid phase using an external magnet, and then the purified aqueous solution was analyzed for the residual dye content.
For all experiments (screening test, kinetics, and isotherms) the adsorption capacity was determined according to the following relation (3):
| (3) |
| (4) |
3. Results and discussions
3.1. Characterization of the produced spinel ferrites
3.1.1. XRD measurements
The recorded XRD patterns for Co and Ni ferrites obtained after microwave irradiation and calcination at 623 K are shown in the Figure 1(a,b). The XRD patterns for all analyzed materials present the most intense peak characteristic of the spinel structure at 2𝜃 around 35°. Moreover, the diffraction lines corresponding to the (220), (311), (222), (400), (422), (511), (440), and (533) diffraction planes, typical for face-centered cubic spinel structure for cobalt and nickel ferrites, were clearly observed, according to the JCPDS Card No. 22-1086 and No. 44-1485 [22]. Close inspection of the XRD patterns indicated the presence of a secondary phase, identified, according to the JCPDS Card No. 80-2377 [4], as hematite (𝛼-Fe2O3) for all samples.
XRD patterns of (a) Co and (b) Ni ferrites obtained by microwave-assisted sol–gel autocombustion synthesis using different combustion agents.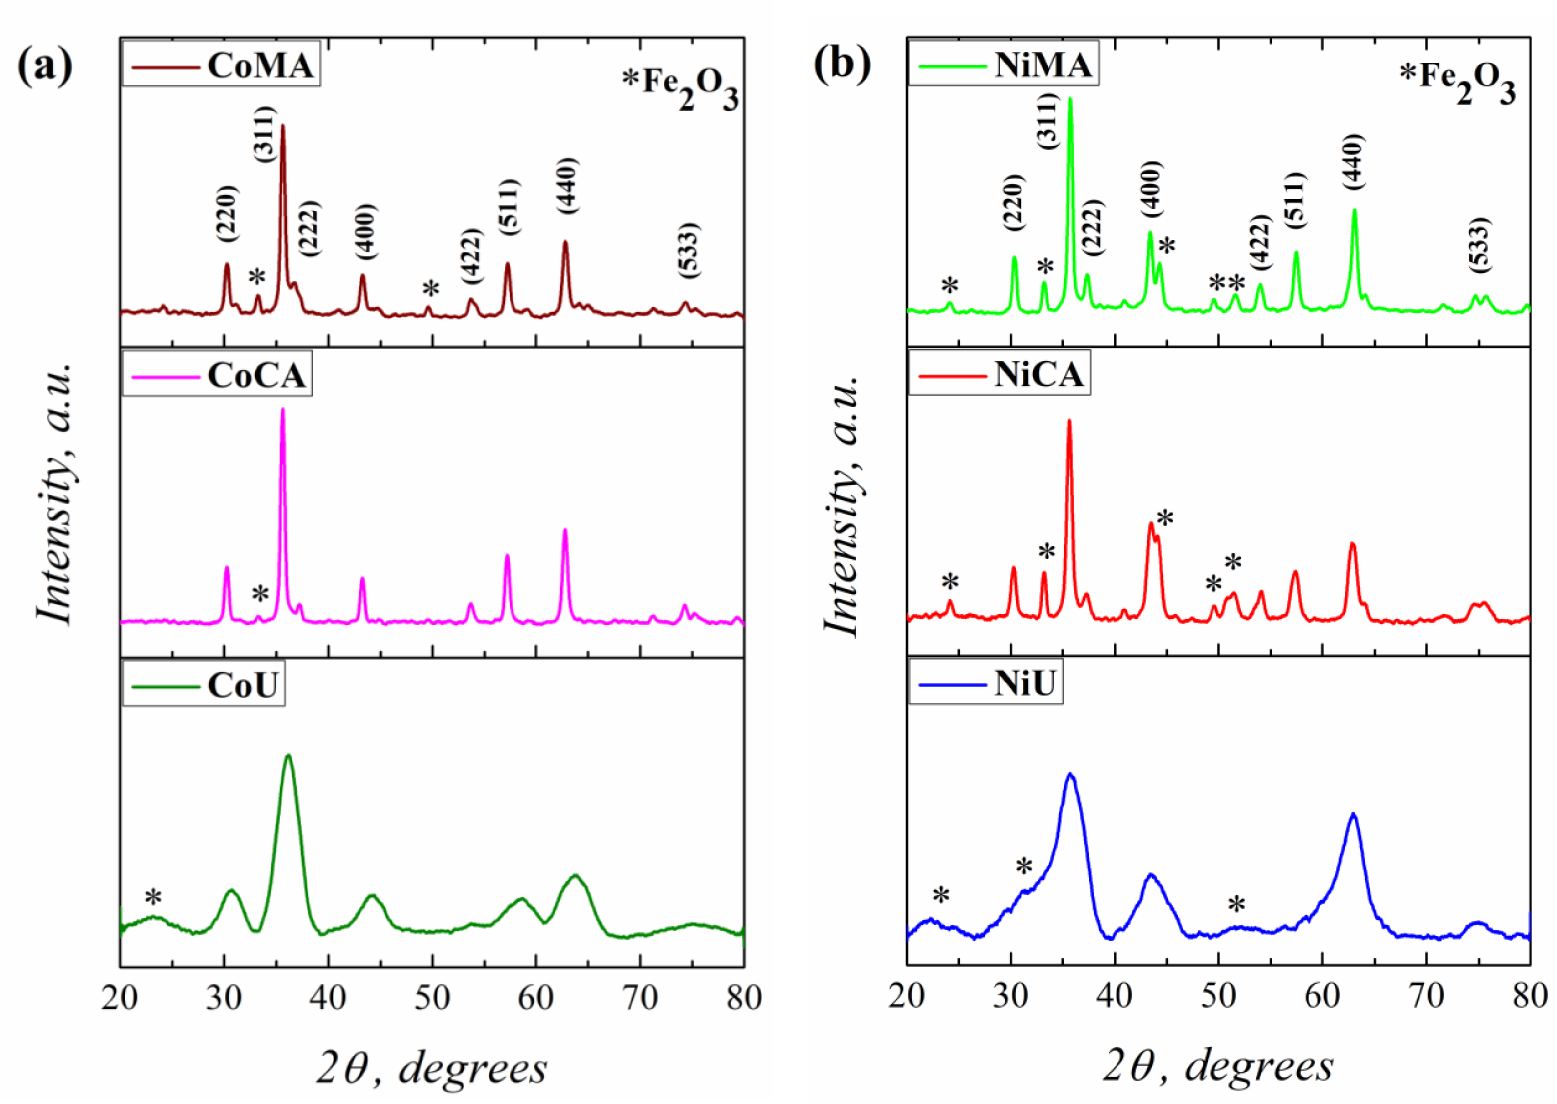
On the other hand, using different fuel agents for synthesis of Co and Ni spinel ferrites strongly influenced the material’s crystallinity. Thus, the well-defined sharp peaks of the CoMA, CoCA, NiMA and NiCA indicated that these samples present a high degree of crystallinity [23]. By contrast, the shape of the XRD patterns for CoU and NiU samples, more precisely the broadening of the peaks, suggested a lower degree of crystallinity [23] for the materials that were prepared using urea as a fuel agent. The broadening of the diffraction peaks is strictly correlated with the crystallite size values [24]. Thus, the XRD data were exploited in order to calculate the mean crystallite size values by Debye–Scherrer and Williamson–Hall equations using (1) and (2), respectively (see Section 2.3).
Likewise, typical Williamson–Hall plots were drawn with 𝛽 cos𝜃 along the y-axis, and 4sin𝜃 along the x-axis for the studied samples as given in Figure 2(a,b). Using the linear fit to the data, the strain values were estimated from the slope of the line. In addition, the crystalline sizes were estimated from the intersection with the vertical axis. The calculated data are presented in Table 1.
Calculated and experimental data of Co and Ni ferrites obtained by microwave-assisted sol–gel autocombustion synthesis using different combustion agents
| Samples | XRD analysis | BET analysis | VSM analysis | |||||||
|---|---|---|---|---|---|---|---|---|---|---|
| DScherrer (nm) | DW–H (nm) | 𝜀⋅10−3 (no unit) | SBET (m2/g) | Vt (cm3/g) | Dpore (nm) | Ms (emu/g) | Hc (Oe) | |||
| CoMA | 18.2 | 19.2 | 0.7 | 8.3 | 0.020 | 2.6; 7.3 | 76.6 | 8.0 | ||
| CoCA | 19.8 | 24.8 | 1.3 | 8.5 | 0.022 | 7.2; 12.3 | 57.4 | 3.9 | ||
| CoU | 3.7 | 9.8 | 16.6 | 66.3 | 0.128 | 5.03 | 45.4 | 2.6 | ||
| NiMA | 18.1 | 17.7 | 0.6 | 22.0 | 0.034 | 3.5; 4.3; 6.0 | 64.2 | 3.5 | ||
| NiCA | 15.0 | 17.5 | 3.8 | 12.6 | 0.025 | 4.3 | 51.3 | 4.2 | ||
| NiU | 2.5 | 1.5 | 12.97 | 94.0 | 0.176 | 5.9 | 4.3 | 4 × 10⁻⁴ | ||
Williamson–Hall plots for (a) Co and (b) Ni ferrites obtained by microwave-assisted sol–gel autocombustion synthesis using different combustion agents.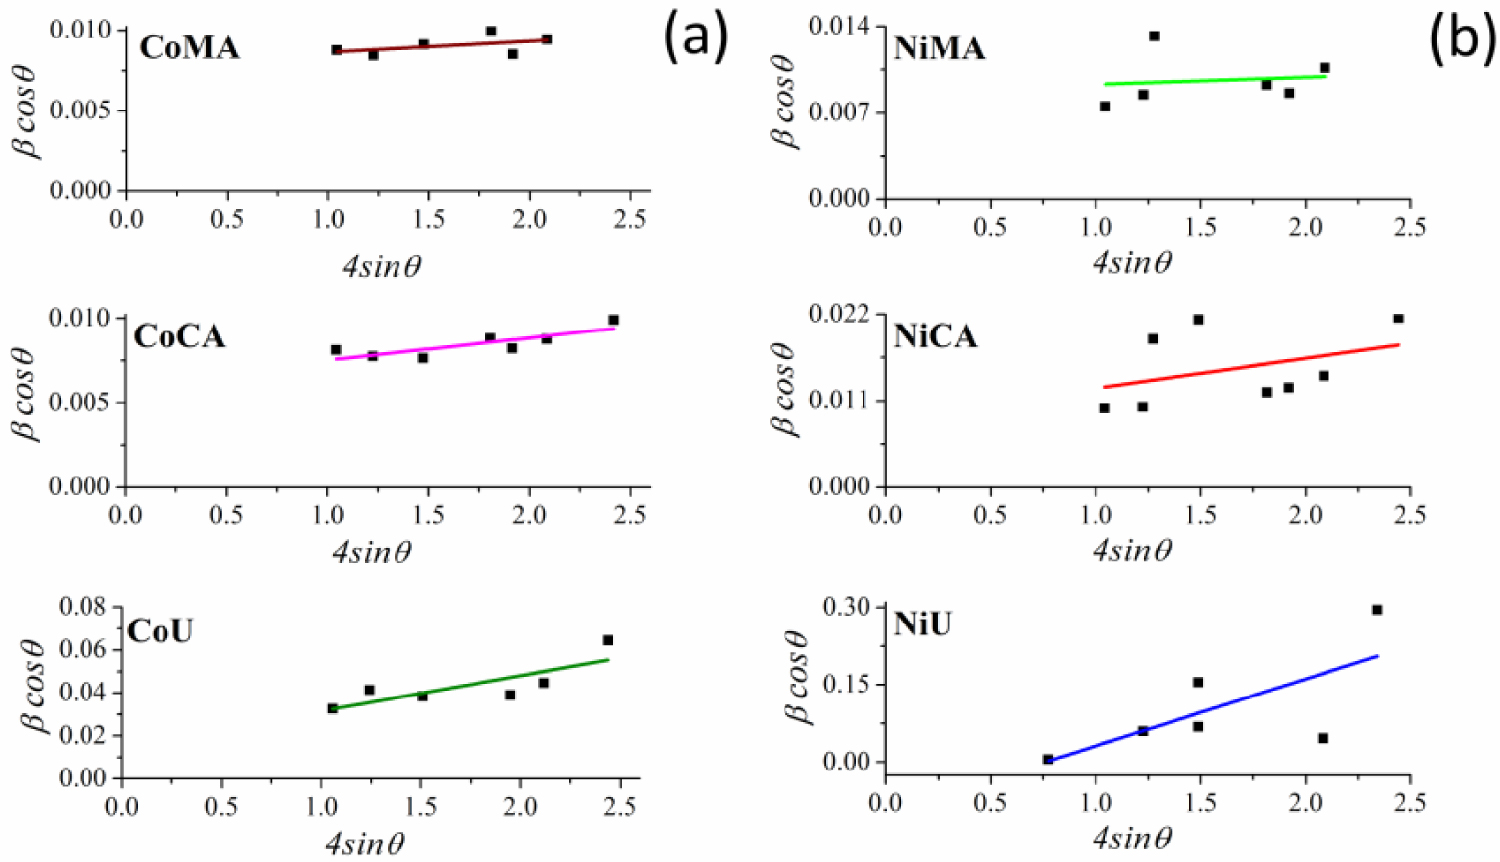
The data from Table 1 demonstrate a close agreement between the crystallite values calculated by Debye–Scherrer and Williamson–Hall methods for all studied materials. More importantly, one may observe that the crystallite sizes were significantly influenced by the type of fuel used during synthesis of spinel ferrites, regardless of the nature of the ions present in the system. Thus, using maleic acid and citric acid as chelating/combustion agents lead to materials with crystallite sizes in the tens of nanometers range. Instead, using urea as fuel leads to crystallites in the range of nanometers, for both cobalt and nickel ferrites. These findings are in good agreement with our previous data [8]. Thus, by studying the influence of the fuel used during a typical sol–gel autocombustion synthesis of NiFe2O4 it was found that the crystallite sizes ranged from 22 to 51 nm depending on the nature of the chelating/combustion agent (cellulose, citric acid, glycine, hexamethylenetetramine or urea) [8]. Nevertheless, the involvement of the microwave for ignition leads to even smaller crystallite sizes. Likewise, the internal strain 𝜀 values acquired from Williamson–Hall plots (Figure 2) are also influenced by the fuel used during the sol–gel microwave-assisted synthesis. The crystallites of spinel ferrites obtained by using urea showed strain values way higher compared to materials that were prepared by using the other two combustion agents. Thus, there is a strict correlation between the smaller crystallite sizes of CoU and NiU samples and the internal strain of the obtained crystallites.
3.1.2. IR interpretation
The FTIR spectra depicted in Figure 3 are in close agreement with the XRD findings. Thus, a strong argument to confirm the formation of cobalt and nickel ferrites with spinel structure was the presence of two strong absorption bands in the range 400–600 cm−1: the more intense band around 580 cm−1 was assigned to the stretching vibration of the tetrahedral M–O bond and the less intense band around 470 cm−1 was assigned to the octahedral M–O bond, respectively [2, 5, 22, 24]. Closer inspection of all the IR spectra indicates an unforeseen shape of the adsorption band at around 600 cm−1. The appearance in that region of a visible adsorption shoulder can be assigned to the 𝛼-Fe2O3 impurity [25], as observed from XRD patterns.
FTIR spectra of Co and Ni ferrites obtained by microwave-assisted sol–gel autocombustion synthesis using different combustion agents.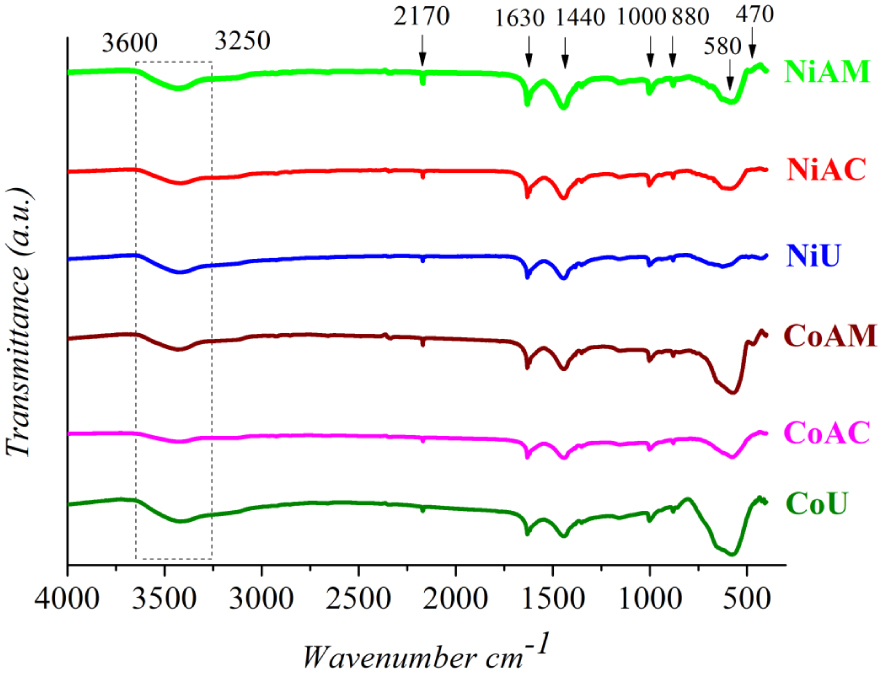
The absorption bands that appeared up to 600 cm−1 can be assigned to the by-products of the chelating/combustion agents [2], as follows: the wide band ranging from 3260 cm−1 to 3646 cm−1 was attributed to bonded and free (O–H) [26, 27]; the peak observed at 2170 cm−1 was ascribed to the adsorbed CO2 on the surface of synthesized materials [28]; the peak at 1631 cm−1 was assigned to the C=O group stretching vibration as a residue of MA [27], U [29] and CA [26]; and the peak at 1443 cm−1 was attributed to the symmetric stretching vibration of (COO−) group [30, 31]. The weaker peaks at 1002 and 879 cm−1 were attributed to the C–O stretching vibration and the –O–H bending vibration of the –COOH group [27], respectively. Each fuel agent presents its own reduction capacity and the amount of gases eliminated during burning, affecting the combustion temperature and duration [32]. On the other hand, in our particular case, the mixtures were irradiated with microwave. The heating mechanism using microwaves is profoundly different from conventional processing that applies external heat in order to promote self-combustion. Microwave radiation is first absorbed by the gel, converted to thermal energy and then the mixture ignition occurs from within the gel to its surface [33]. By contrast, for the conventional methods, involving hot plates or muffle furnaces, the autocombustion first occurs at the sample surface and is propagates inside the gel. Thus, using microwaves, the combustion processes are characterized by faster reaction kinetics [33]. Therefore, even if the fuel agents are not completely burned, spinel ferrite formation may occur.
3.1.3. Transmission electron microscopy analysis
Figure 4 shows a selection of representative TEM micrographs. For all samples, close examination of the TEM images suggested the formation of grains with an irregular shape, fine powder size, and homogeneous nanostructures in the nanometer range (<50 nm).
Representative TEM photomicrographs of Co and Ni ferrites obtained by microwave-assisted sol–gel autocombustion synthesis using different combustion agents.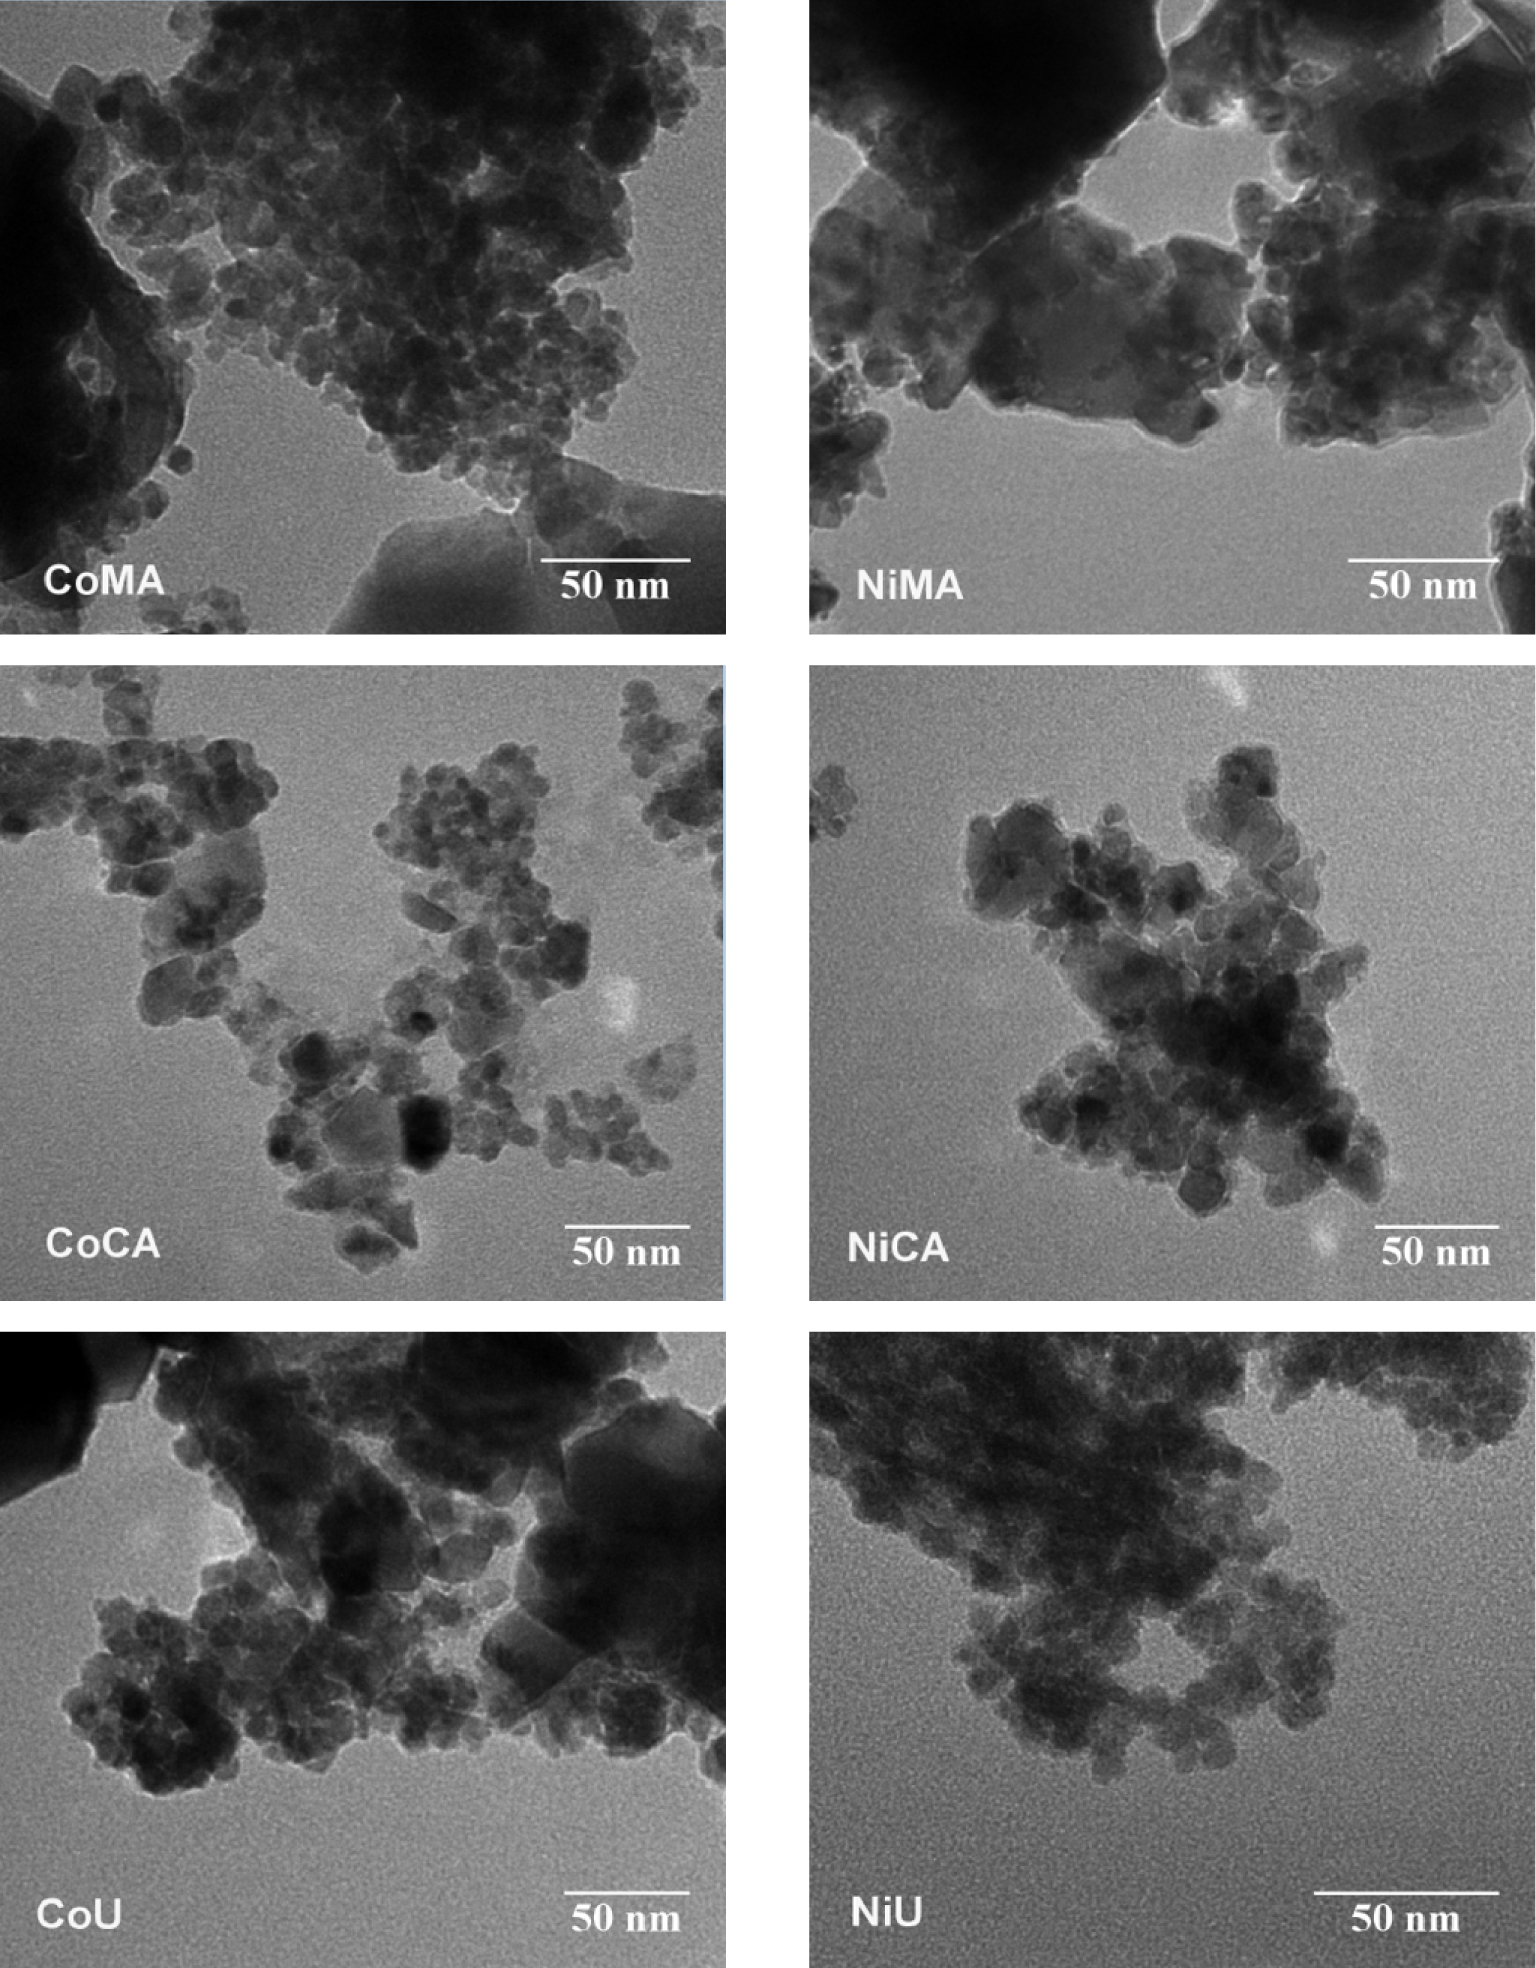
Nitrogen sorption isotherms and their corresponding pore size distribution (insert) of (a) Co and (b) Ni ferrites obtained by microwave-assisted sol–gel autocombustion synthesis using different combustion agents.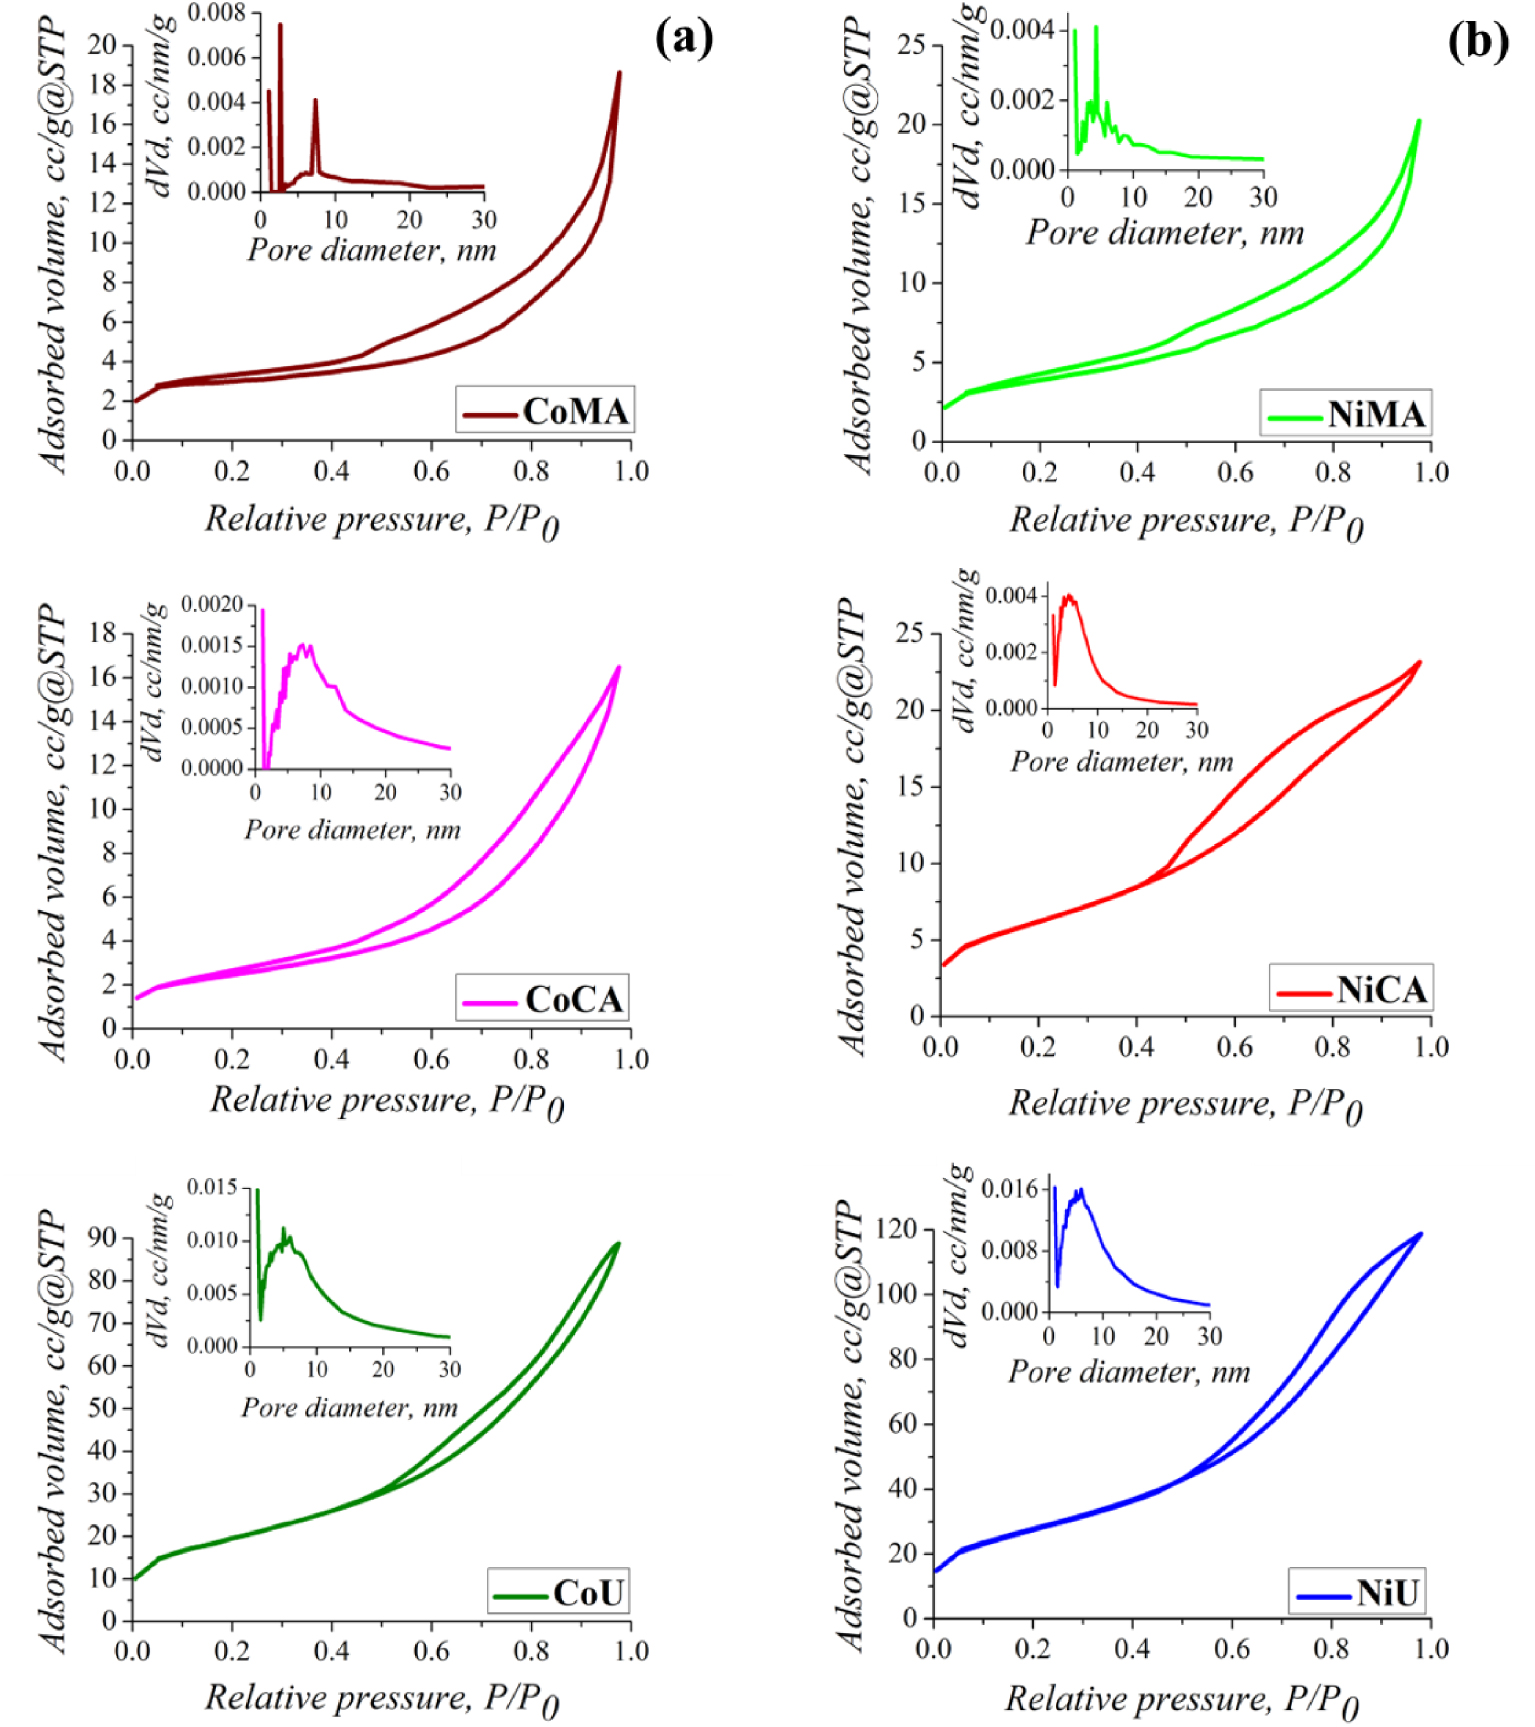
Likewise, one may note the presence of individual “unaggregated” grains together with relatively large aggregation of nanoparticles. The tendency of nanoparticles to agglomerate is most probably due to the magnetic properties of the powders. The aggregation of the nanoparticles and their irregular shapes hinder the accurate estimation of particle size distribution.
3.1.4. BET analysis
The fuel agent is an important reaction component for a sol–gel synthesis assisted by microwave. The combustion agent and the microwave exposure have a significant impact on the textural characteristics of Co and Ni nanoparticles. The nitrogen adsorption–desorption isotherms and their corresponding pore size distribution curves for all samples are represented in Figure 5(a,b). One may observe that the isotherms were significantly influenced by the type of fuel used during synthesis of spinel ferrites and by the nature of the cations. Thus, according to the IUPAC classification, for all the samples containing cobalt (CoMA, CoCA, CoU) and for the sample NiMA, the isotherms were of type II with a specific shape of monolayer–multilayer adsorption up to high P∕P0 ratios. Usually, type II isotherms are the result of the physisorption of gases on non-porous or macroporous solids [34]. The isotherms for the other two nickel-containing materials (NiCA and NiU) were similar to the type II mixed with type IV features. A slight delay can be observed in the desorption process. According to literature, the type IV isotherms are typical of mesoporous materials. The N2 consumption at relative pressure values P∕P0 < 0.05 indicated the existence of micropores in the solid structure. At the same time, the almost linear shape of the adsorbate in the range P∕P0 = 0.1–0.5 and the presence of a H3-type hysteresis allow the identification of macropore networks where the condensation of gas molecules did not take place definitively. In other words, due to the H3-type hysteresis, it can be stated that the analyzed solids have sloping pores [34]. The BJH pore size distribution calculated using the data of adsorption branch of isotherms revealed that in case of samples obtained with maleic acid as a fuel agent, a dual system of pores was present for cobalt ferrite, and three different types of pores for nickel ferrite, respectively. Likewise, a dual system of pores was specific also for CoCA sample. Comparing with CoAM and NiAM the rest of the samples showed a wider pore size distribution. The mean pore diameters were larger for the CoAM and CoAC samples as compared to CoU, NiAC and NiU samples.
The (SBET) specific surface areas, total pore volume (Vt) and pore size distribution (Dpore) of the studied materials are reported in Table 1. The nature of the fuel played an important role in increasing the surface area and total pore volume as noticed in the case of urea. Thus, it can be observed that after irradiation with microwaves and calcination of materials, urea led to the highest values for specific surface areas (CoU 66.3 m2/g and NiU 94.0 m2/g). Also the results proved the same trend is characteristic for total pore volume (CoU 0.128 cm3/g and NiU 0.176 cm3/g). These special textural parameters, in case of NiU, represent an advantage for application in adsorption processes because the surface contact between the sample, and the solution needs to be as high as possible.
3.1.5. Magnetic properties
The magnetic properties of the prepared cobalt and nickel nanoparticles were measured by VSM at room temperature. Magnetization—magnetic field curves are depicted in Figure 6(a,b) and the magnetic parameters such as saturation magnetization and coercivity values are displayed in Table 1. The registered data indicate a typical ferrimagnetic behavior [35] for all cobalt samples, and for the nickel samples prepared with citric acid and maleic acid, and a paramagnetic behavior [36] for the NiU sample. The magnetic properties of the studied samples can be correlated with the crystallite size and internal strain values. These findings are in close agreement with previous works proving that saturation magnetization values usually decrease with increasing internal strain values due to presence of a non-magnetic layer at the nanoparticle’s surface [37]. Additionally, for the NiU sample the change in magnetic behavior, corroborated with the reduction in magnetization, can be explained by the change in cation distribution among tetrahedral and octahedral sites of the spinel structure, occurring at nanoscale level because of size confinement [36].
Magnetic measurements—Room temperature hysteresis loops for (a) Co and (b) Ni ferrites obtained by microwave-assisted sol–gel autocombustion synthesis using different combustion agents.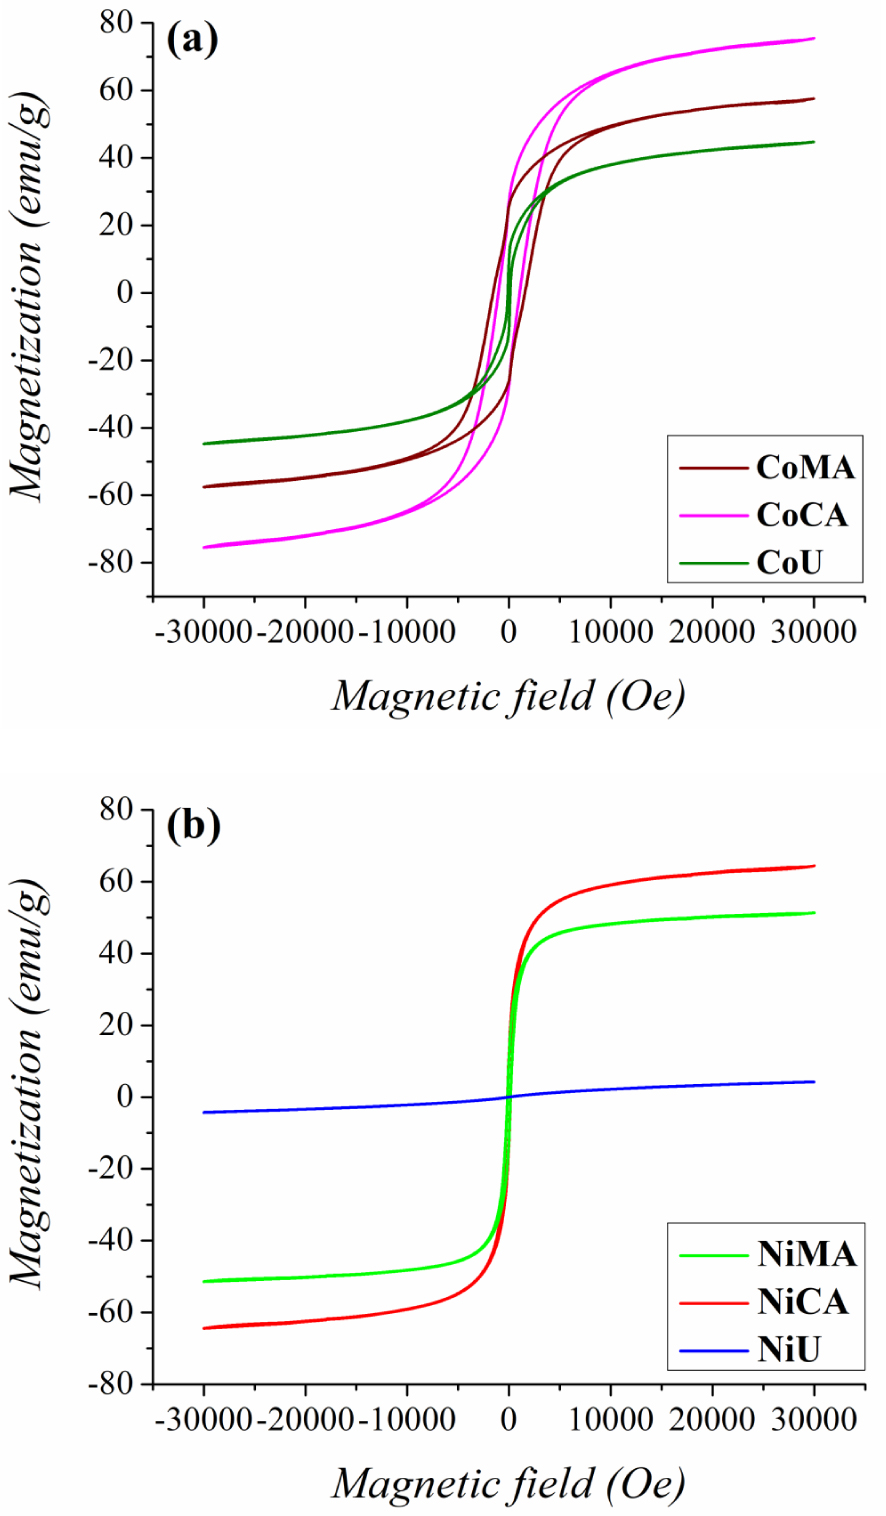
3.2. Adsorption-screening test
The goal of the screening test was to compare the produced ferrites in terms of performance of adsorption of Orange-II dye from aqueous solutions under the same conditions. The results of the screening test are highlighted in Figure 7. Hence, the highest adsorption performances were attributed to the adsorbent NiU (NiFe2O4), which showed the greatest values of adsorption capacity and color removal efficiency (Figure 7). Therefore, the spinel ferrite NiU (NiFe2O4) showing the best adsorption performance was employed for the next studies dealing with adsorption kinetics and isotherms. Note that, the higher adsorption performance of the studied materials can be correlated with the textural properties, such as BET-surface and the total pore volume.
Batch adsorption screening test for Orange-II removal from aqueous solutions using different spinel ferrite adsorbents—values of adsorption capacity (q, mg/g) and color removal efficiency (Y, %) depending on the type of the adsorbent used; experimental observations.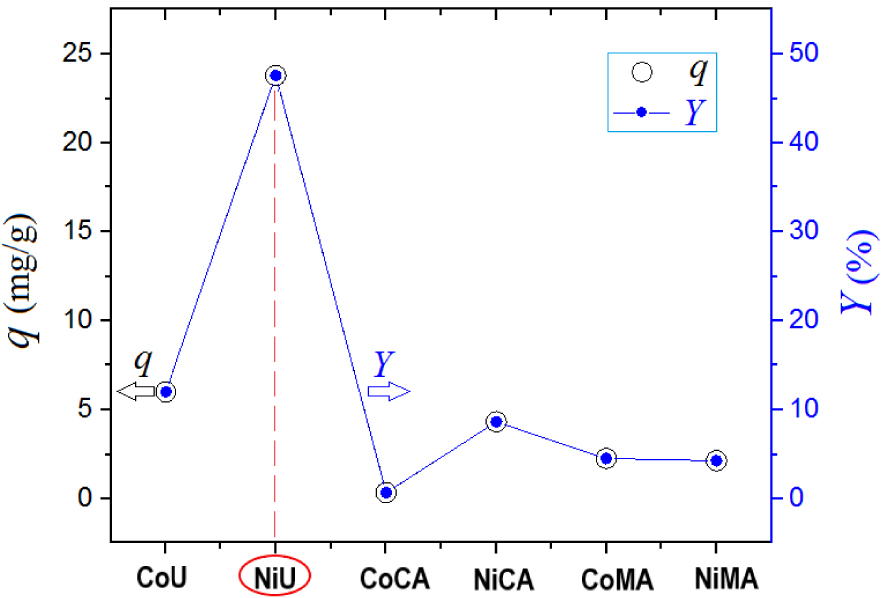
3.3. Adsorption kinetics and isotherms
The adsorption kinetics of Orange-II anionic dye onto the surface of NiU material was studied in this section. These experiments were done under the following conditions of T = 300 K (temperature), pH 5.0 ± 0.2, SD = 1 g/L (sorbent dose), and C0 = 50 mg/L (initial dye concentration). Figure 8a illustrates the history of the adsorption capacity qt (mg/g) versus the contact time t (min). Generally, the adsorption capacity increased as the contact time elapsed. Three stages can be identified from the kinetic profile (Figure 8a). In the first stage, the adsorption capacity increased rapidly in the first 15 minutes. In the second stage (15–120 min), the adsorption capacity increased gradually. In turn for the third stage (>120 min), the adsorption capacity attained a stationary plateau, i.e. the equilibrium (Figure 8a).
Adsorption of Orange-II anionic dye onto the surface of NiU (NiFe2O4) adsorbent: (a) adsorption kinetics (data and models) at T = 300 K, pH 5.0 ± 0.2, SD = 1 g/L, C0 = 50 mg/L; (b) adsorption isotherms (data and models), conditions: SD = 1 g/L, pH 5.0 ± 0.2, t = 240 min; solid, dashed and dotted lines represent estimations given by fitted models.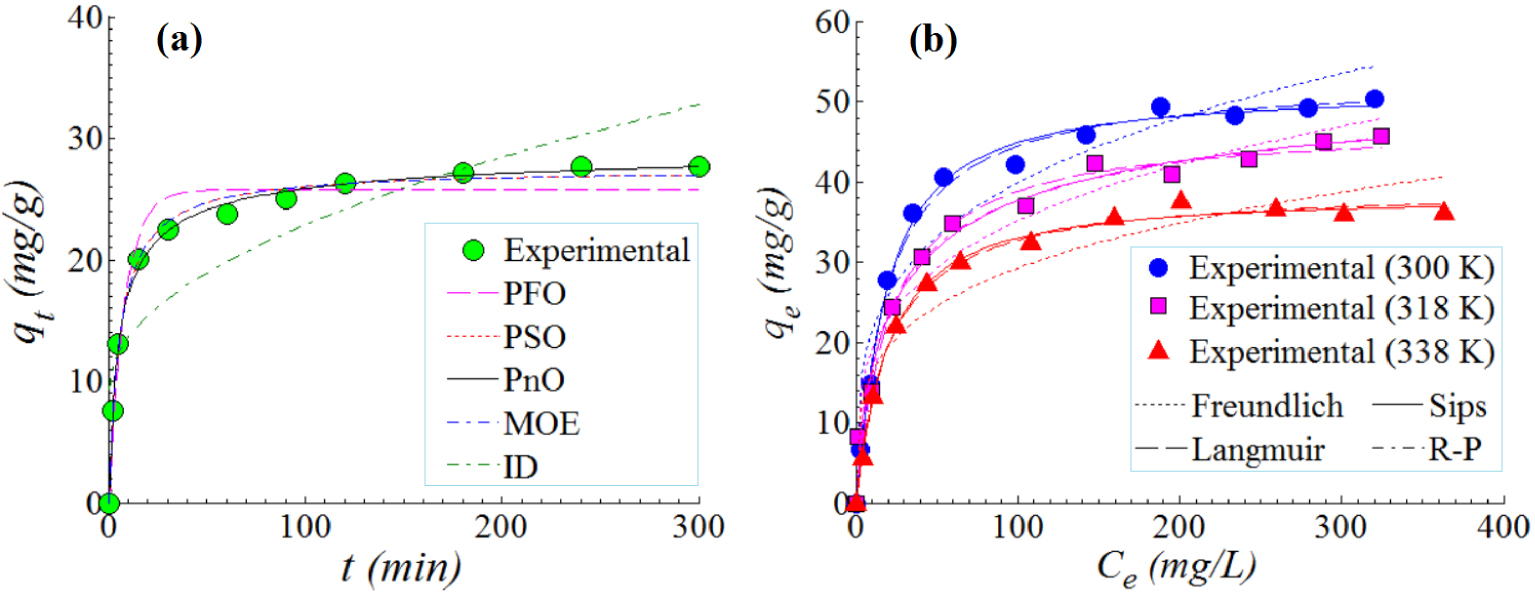
To interpolate experimental data, different kinetic models [38, 39, 40] were used, which are summarized in Table 2 as rate (differential) expressions as well as non-linear mathematical equations. Likewise, the calculated kinetic parameters for each model are also given in Table 2. In this table, qe (mg/g) and qt (mg/g) designate the adsorption capacity determined at equilibrium and at any contact time, respectively. Note that the parameters of kinetic models were established via non-linear regression. Estimations provided by kinetic models are represented in Figure 8a as lines of different patterns (solid, dashed, and dotted). To evaluate the goodness-of-fit offered by each kinetic model, the chi-squared (𝜒2) statistical test was adopted. Generally, a small value for chi-squared (𝜒2) is preferred, suggesting a better prediction ability offered by the model. From Figure 8a and by inspecting 𝜒2-values in Table 2, it can be noticed that the best-fitting model of kinetics data was PnO model (pseudo-n-order), followed by MOE (mix 1,2-order) and PSO (pseudo-second-order) models. It should be mentioned here that the PSO rate constant (k2) found for the NiU/Orange-II system was equal to 6.36 × 10⁻³ (g/mg⋅min−1). If compared with literature, a similar order of magnitude ∼10−3 (g/mg⋅min−1) for k2 (PSO) was reported and for the other systems like HDTMA-coated zeolite/Orange-II [41] and CTAB-modified sepiolite/Orange-II [42].
Kinetic models and parameters for Orange-II dye adsorption onto NiU (NiFe2O4) sorbent sample, experimental conditions: T = 300 K, SD = 1 g/L, [Orange-II]0 = 50 mg/L, and pH 5.0 ± 0.2
| Model abbreviation | Kinetic model (rate equation) | Kinetic model (non-linear equation) | Kinetic parameters |
|---|---|---|---|
| PFOa | qt = qe 1 − e−k1 t | qe = 25.779 (mg/g) | |
| k1 = 1.244 × 10⁻¹ | |||
| 𝜒2 = 1.7115 | |||
| PSOb | qe = 27.501 (mg/g) | ||
| k2 = 6.360 × 10⁻³ | |||
| 𝜒2 = 0.2001 | |||
| PnOc | qe = 29.813 (mg/g) | ||
| kn = 4.580 × 10⁻⁴ | |||
| n = 2.80 | |||
| 𝜒2 = 0.0882 | |||
| MOEd | qe = 27.501 (mg/g) | ||
| K1 = 2.793 × 10⁻⁶ | |||
| K2 = 6.361 × 10⁻³ | |||
| 𝜒2 = 0.2000 | |||
| IDe | kd = 1.349 | ||
| J = 9.366 | |||
| 𝜒2 = 7.6391 |
aPFO—pseudo-first-order kinetics;
bPSO—pseudo-second-order kinetics;
cPnO—pseudo-n-order kinetics;
dMOE—mix 1,2-order kinetics;
eID—intra-particle diffusion kinetics.
For the investigated system (NiU/Orange-II), the adsorption isotherms were recorded for three values of temperature (300 K, 318 K, and 338 K). Here, the contact time was fixed at t = 240 min in order to achieve the equilibrium of adsorption. Results of the isotherm study are illustrated in Figure 8b for the adsorption of Orange-II dye onto the solid surface of the inorganic material NiU (NiFe2O4). As shown in Figure 8b, with the increment of the equilibrium concentration Ce (mg/L), the adsorption capacity qe (mg/g) gets higher. Furthermore, the adsorption of Orange-II onto the NiU sorbent was disfavored by the increment of temperature. That is, as the temperature increased the adsorption capacity was diminished. The maximum adsorption capacity of qe = 50.32 mg/g was observed at 300 K. At higher values of temperature (318 K and 338 K) the adsorption capacities at equilibrium were lower (Figure 8b).
The observed adsorption capacity of qe = 50.32 mg/g, for the studied system (NiU/Orange-II), is relevant if compared with the existing data in literature. For instance, the following adsorption capacities were reported for different systems: 8.13 mg/g (zeolite/Orange-II) [41]; 38.96 mg/g (HDTMA-coated zeolite/Orange-II) [41]; 42.50 mg/g (Zn2Al-layered double hydroxide/Orange-II) [43]; 13.24 mg/g (bottom ash/Orange-II) [44]; 26.90 mg/g (CTAB-modified biochar/Orange-II) [45]; and 104 mg/g for the CTAB-modified sepiolite/Orange-II [42].
The adsorption data at equilibrium were interpolated by isotherm models, namely, Freundlich, Langmuir, Sips and Redlich–Peterson (RP) [46, 47, 48]. In this regard, the non-linear regression method was applied in order to establish the isotherm parameters. And, 𝜒2-values were calculated to evaluate the goodness-of-fit between model predictions and experimental observations. In Figure 8b, the model predictions are represented graphically as lines of different patterns (dashed, dotted, and solid). Equations and calculated parameters of isotherm models as well as the calculated 𝜒2-values are listed in Table 3. According to 𝜒2-values (Table 3) the best-fitting equation was the Sips model, which combines aspects of both classical Freundlich and Langmuir equations. Moreover, the Dubinin–Radushkevich (DR) isotherm model [49, 50] was also applied to determine the type of adsorption process (physical, ion-exchange, or chemisorption). The main parameter of the DR equation that gives information regarding the nature of the adsorption process is the mean free energy of sorptionES (kJ/mol) [49, 50]. Typically, the adsorption process relies mainly on physical forces (van der Waals) when ES < 8 (kJ/mol). Instead, if 8 ⩽ ES⩽16 (kJ/mol), then the adsorption process is based on ion exchange. For greater values of energy ES > 16 (kJ/mol), the chemisorption can be the prevailing phenomenon [49]. In our particular case, the mean free energy ES varied from 11.88 to 14.25 (kJ/mol) (Table 3), suggesting that, for the adsorption system NiU (NiFe2O4)/Orange-II, the ion-exchange mechanism was dominant.
Isotherm models and parameters for Orange-II dye adsorption onto NiU (NiFe2O4) sorbent sample, experimental conditions: SD = 1 g/L, t = 240 min, and pH 5.0 ± 0.2
| Isotherm model | Parameters for the adsorption system: NiU/Orange-II | ||
|---|---|---|---|
| T = 300 K | T = 318 K | T = 338 K | |
| Freundlich: | KF = 11.647 | KF = 10.385 | KF = 9.037 |
| nF = 3.7432 | nF = 3.7835 | nF = 3.9218 | |
| 𝜒2 = 10.482 | 𝜒2 = 3.7548 | 𝜒2 = 7.5254 | |
| Langmuir: | qm = 52.905 (mg/g) | qm = 47.225 (mg/g) | qm = 39.344 (mg/g) |
| KL = 0.05246 (L/mg) | KL = 0.04585 (L/mg) | KL = 0.04915 (L/mg) | |
| 𝜒2 = 0.6733 | 𝜒2 = 9.9951 | 𝜒2 = 0.3758 | |
| Redlich–Peterson (RP): | A = 2.7754 (L/g) | A = 3.1311 (L/g) | A = 1.9336 (L/g) |
| B = 0.05246 (L/mg) | B = 0.11062 (L/mg) | B = 0.04915 (L/mg) | |
| g = 1 | g = 0.9103 | g = 1 | |
| 𝜒2 = 0.6733 | 𝜒2 = 5.4061 | 𝜒2 = 0.3758 | |
| Sips: | qS = 51.341 (mg/g) | qS = 53.991 (mg/g) | qS = 38.312 (mg/g) |
| b = 0.038537 (g/mg) | b = 0.091758 (g/mg) | b = 0.036897 (g/mg) | |
| nS = 0.88649 | nS = 1.4297 | nS = 0.89765 | |
| 𝜒2 = 0.4514 | 𝜒2 = 1.8968 | 𝜒2 = 0.1889 | |
| Dubinin–Radushkevichi (DR): | KD = 3.539 × 10⁻³ | KD = 2.463 × 10⁻³ | KD = 3.082 × 10⁻³ |
| ES = 11.88 (kJ⋅mol−1) | ES = 14.25 (kJ⋅mol−1) | ES = 12.74 (kJ⋅mol−1) | |
| r2 = 0.9148 | r2 = 0.9713 | r2 = 0.9011 | |
3.4. Thermodynamic parameters
The thermodynamic parameters for Orange-II adsorption onto NiU (NiFe2O4) sorbent sample were computed according to the conventional method presented elsewhere [50, 51]. Thus, the thermodynamic parameters for the adsorption system NiU (NiFe2O4)/Orange-II were found to be 𝛥G = −25.65 ± 1.46 kJ/mol, 𝛥H = −1.46 kJ/mol and 𝛥S = −75.93 ± 0.49 J/mol⋅K. Hence, the negative value of free energy 𝛥G (−25.65 kJ/mol) unveiled the spontaneous nature of the investigated adsorption process. In turn, the negative value of enthalpy 𝛥H (−1.46 kJ/mol) suggested a moderate exothermic effect of the adsorption process. Moreover, the negative value of entropy 𝛥S (−75.93 J/mol⋅K) revealed the diminishing effect of the randomness at the solid/liquid interface. Hence, for the investigated system (NiU/Orange-II), the values of all three thermodynamic parameters (𝛥G, 𝛥H, 𝛥S) were found to be negative. A similar situation was reported in literature and for the adsorption system CTAB-modified sepiolite/Orange-II [42].
4. Conclusions
CoFe2O4 and NiFe2O4 nanoparticles with spinel structure were successfully prepared by sol–gel microwave-assisted combustion technique using urea, citric acid and maleic acid as fuels. Thus, by using microwave irradiation, spinel ferrites were obtained by saving time and energy compared to the classical sol–gel autocombustion method. XRD analysis demonstrated that crystallite sizes, and internal strain values are very sensitive to the fuel used during preparation, in agreement with the BET analysis findings. TEM analysis confirms the irregular shape of particles with sizes in the nanoscale regime. VSM analysis demonstrated the ferrimagnetic behavior for the samples, except for the NiU (NiFe2O4) material which presented a paramagnetic behavior.
The spinel ferrite materials produced by the microwave-assisted process were applied for Orange-II adsorption from synthetic wastewaters. The screening test revealed the most efficient NiU material for the adsorption of the organic pollutant (Orange-II dye) from aqueous solutions. The adsorption kinetics unveiled that the experimental data were best fitted by PnO kinetic model, suggesting that the most appropriate order for the rate equation was n = 2.8. The Sips isotherm model revealed the finest agreement with the observations. The maximum adsorption capacity was observed at 300 K and was equal to 50.32 mg/g, which was in good accordance with maximum adsorption capacity predicted by Sips isotherm (51.34 mg/g). According to DR isotherm, the mean free energy ES of sorption ranged from 11.88 to 14.25 (kJ⋅mol−1); suggesting a retention mechanism based on ion-exchange. Along with smaller crystallite size and highest specific surface are, the superiority of NiU sample in adsorption of Orange-II (by ion-exchange predominant mechanism) might be attributed to the paramagnetic behavior of NiU material, compared to other sorbents of ferrimagnetic behavior reported in this study.
Conflicts of interest
Authors have no conflict of interest to declare.
Acknowledgment
Petrisor Samoila and Corneliu Cojocaru are grateful for the financial support from the grant of the Romanian Ministry of Research, Innovation and Digitization, CNCS/CCCDI – UEFISCDI, project number PN-III-P1-1.1-TE-2019-0594, within PNCDI III.