


 CC-BY 4.0
1. Introduction
The oxidation of organic compounds into oxygenated compounds, used as precursors or intermediates, is of great importance in organic syntheses [1, 2, 3]. In the field of green chemistry, several works focus their research on efficient catalytic systems exploiting clean oxidants such as molecular oxygen, hydrogen peroxide and non-corrosive and non-polluting catalytic materials [4, 5, 6, 7, 8]. In this context, Keggin-type polyoxometalates (POMs), especially those based on the phosphomolybdic ion () can meet these requirements. They are widely used as homogeneous and heterogeneous catalysts in acid and/or oxidative reactions due to their multifunctional properties, combined with their chemical composition that can be modulated according to the needs of the desired reaction [9, 10, 11]. POMs with higher oxidation state (MoVI) are also recognized as electron reservoirs due to the vacant d-orbitals of the transition metal [12, 13, 14]. Furthermore, it has been shown that in the presence of hydrogen peroxide, POMs form peroxide species whose catalytic action is more effective than that of POMs [15, 16, 17, 18].
The POM synthesis has been elaborated to adapt the process to the objectives. In order to increase the oxidizing power of POMs, several studies have proposed the introduction of transition metals (Co, Ni, Fe, Mn, …) and non-metallic elements (Sb, Sn, Bi, …) as a counter-ion using the precipitation method from the parent heteropolyacid (HPA) in the presence of ammonium chloride or cesium chloride [19, 20, 21, 22, 23, 24, 25]. The introduction of antimony or tin in the POM-framework has already been the subject of several studies [22, 26, 27, 28, 29, 30, 31]. The authors have prepared mixed-valence antimony POMs such as and (M:MnII, FeII, CuII or CoII), Na10[{SbV(OH)3}2{VIV − O(H2O)}2{SbIIIW9 O33}2]32H2O and using both SbCl3 and Sb2O5. Keggin-type POMs such as (NH4)xAyPMo12O40 and CsxAyPMo12O40 (An+ = Sb3+, Bi3+ or Sn2+) were also prepared. In the case of SnII based POMs, the SnIV state is formed in situ, a presence that is demonstrated by XPS or UV–Visible (UV–Vis).
In this work, phosphomolybdic POMs were prepared by introducing tin and/or antimony as more electronegative element than molybdenum, in the cationic position, in order to create more active sites with the formation of redox couples such as Mo(VI)/Mo(V), Sb(V)/Sb(III) and Sn(IV)/Sn(II) in situ. Thus, a series of POMs as soluble salts of formula Sn1.5PMo12O40, SbPMo12O40 and H3−xSnx1Sbx2PMo12O40 (x = 2x1 + 3x2 and x1, x2 = 0–0.75) was prepared using the cationic exchange method under stoichiometric conditions. This method permits to fix the number of Sn and Sb atoms from 0.25 to 1.5, in contrast to that of the precipitation where the number of these atoms is arbitrary; even if initially fixed [19, 23, 32]. In this case, the number of these atoms must be determined by ICP analysis. The prepared materials were characterized by several physicochemical techniques such as Raman, Fourier Transform-Infrared (FT-IR), solid UV–Vis and X-ray Photoelectron (XPS) spectroscopies and X-ray diffraction (XRD), thermogravimetric analysis (TG-DTA) and electrochemical analysis (cyclic voltammetry) and tested in the cyclohexanone oxidation in the presence of hydrogen peroxide at 90 °C, without the addition of organic solvent, co-catalyst, phase transfer compounds or surfactants, which are harmful reagents, as observed in several studies [33]. Among the products of the cyclohexanone oxidation, adipic acid (AA) is the most important because of its use as a precursor in the production of Nylon-6,6,polyvinyl butyral (PVB), and as additives for food, cosmetics, gelatins, lubricants, fertilizers, adhesives, insecticides, paper and waxes [34, 35, 36]. In this study, only the AA formation was taken into account. It can be easily separated from the other products of the oxidation reaction by cold crystallization.
2. Experimental
2.1. Material synthesis
H3PMo12O40 HPA was prepared according to the classical method described by Tsigdinos [37]. It is constituted of two steps, in the first one, Na2HPMo12O40 was synthesized by dissolving Na2MoO4, 2H2O (145.15 g) in 210 mL of distilled water, subsequently 3.4 mL of H3PO4 (14.8 M) and 142 mL of HClO4 (11.7 M) were added to the solution. The mixture was left under stirring for 30 min. The yellow precipitate formed was then filtered and dried. In the second step, the recovered salt (125 g) was dissolved in 150 mL of acidified water with 37.5 mL of HCl (2 M). The HPA was extracted with 130 ml of diethyl ether. The etherate-phase recovered was dissolved in half of its volume in water. Yellow translucent crystals were formed.
Sn1.5PMo12O40, SbPMo12O40 and H3−xSnx1Sbx2 PMo12O40 (x = 2x1 + 3x2 and x1, x2 = 0–0.75) soluble salts were synthesized using the cationic exchange method under stoichiometric conditions [19, 23]. The method consists in a first step of adding progressively, in small quantities, solid Ba(OH)2 to the HPA solution, maintaining pH < 2 to avoid brutal decomposition of the Keggin anion (1). In the second step, the Ba2+ ions were precipitated as BaSO4 by adding metal sulfate (SnSO4 and/or Sb2(SO4)3) (2). After filtration, the soluble heteropolysalt was dried at 50 °C under vacuum and recovered as a powder.
| (1) |
| (2) |
2.2. Characterization
Thermal analysis was performed from room temperature to 600 °C, under N2 flow with a heating rate of 5 °C/min using a TA Q600 apparatus.
IR spectroscopy (1800–400 cm−1) was performed using a Nicolet Is50 FT-IR spectrometer, including an attenuated total reflectance (ATR) module with a diamond crystal.
Raman spectra were obtained using an EXOLORA HORIBA spectrometer equipped with a detector operating at liquid nitrogen temperature under a double frequency Nd–YAG laser, with the excitation line at 532 nm. The samples were dispersed on a glass plate and the laser was focused on several grains under the microscope before the spectrum acquisition. Calibration was checked by using the Si line at 521 nm and/or the MoO3 line at 818 nm. The use of filters reduced the possibility of laser-induced changes in the solid state (applied power 0.04 mW).
UV–Vis spectra were performed with a Perkin Elmer UV/Vis spectrometer (Lambda 650S) equipped with an integrating sphere. The apparatus is constituted of a double beam and a double monochromator. The sources used are tungsten-halogen and deuterium. The solids are analyzed as finely ground powder. The spectra of the solid samples were recorded between 200 and 900 nm with a step of 1 nm. For solids, the spectra collected in percent reflectance were processed by applying the Kubelka–Munk function to the raw data: F(R) = (1 − R)2∕2R.
XRD spectra were obtained using a Bruker D8 Advance A25 in Bragg–Brentano configuration (Cu Kα radiation, 𝜆 = 1.5418 Å), equipped with a 1D Lynxeye XE detector, in the range of 2𝜃 = 5°–70°.
XPS measurements were carried out on a Kratos AXIS Ultra DLD spectrometer equipped with a monochromatic Al Kα X-ray source (10 mA, 12 kV), equipped with a hemispherical analyzer operating at a fixed pass energy of 20 eV. The pressure during analysis was lower than 5 × 10⁻⁹ mbar. Calibration was done by using the C 1s component of adventitious carbon at BE (binding energy) = 284.8 eV. Quantification and decomposition were carried out using Casa XPS software. A Shirley background was subtracted from the spectra for quantification. The analyzed area was of approximately 700 μm × 300 μm.
The Cyclic voltammograms were carried out at room temperature, on a PGZ 301 Potentiostat, in a conventional cell containing Hg/HgCl2 electrode (SCE) and Pt-counter-electrode, the working electrode was prepared by dissolving 100 mg of catalyst in 200 ml of distilled water. The electrical current must be uniform; so the electrode was placed in front of the Pt electrode.
2.3. Catalytic reaction
The cyclohexanone oxidation was performed according to the literature [38]. The mixture, constituted of the substrate (cyclohexanone) and the catalyst, was introduced into a 100 mL round-bottomed flask (1000 rpm) equipped with a reflux condenser and heated to 90 °C. After a few minutes, the yellow reaction mixture turned blue, a typical color of reduced POM. 0.5 mL of hydrogen peroxide (30%) was then added to oxidize the reduced catalyst and restore the original yellow color. This operation is repeated after each color change. Once there is no further color change, indicating the end of the reaction, the mixture is stirred for up to 20 h to favor the AA formation. The reaction mixture is then cooled to 4 °C overnight. The AA was recovered as white crystals and its purity was confirmed by recording its infrared spectrum and measuring its melting point (152 °C).
3. Results and discussion
3.1. Characterization results
3.1.1. UV–Vis characterization
The UV–Vis spectra of solids of H3PMo12O40 and the different prepared salts (Figure 1) showed two absorption bands corresponding to ligand-metal charge transfers from oxygen to Mo(VI) [39, 40]. The absorption band Od→Mo is located in the range of 223–227 nm and those corresponding to Ob∕Oc→Mo in the range of 319–334 nm. In the Keggin unit, Oa corresponds to O atoms shared in common between PO4 tetrahedron and a trimetallic group, Ob to O atoms connecting two trimetallic groups, Oc to O atoms connecting two MoO6 octahedra within a trimetallic group and Od is a terminal oxygen, linked to a Mo atom [11]. The substitution of protons by Sn and/or Sb elements has led to the appearance of a wide charge transfer band around 700 nm, attributed to the d–d transition band of the Mo(V) [20, 41]. The presence of this band suggests a partial reduction of Mo(VI) to Mo(V), highlighting an electron exchange between Sn(II) and Mo(VI) and Sb(III) and Mo(VI) as follows:
UV–Vis spectra of HPA, Sn1.5PMo12O40, Sb1PMo12O40 and H3−xSnx1Sbx2PMo12O40 heteropolysalts (x1, x2 = 0–0.75).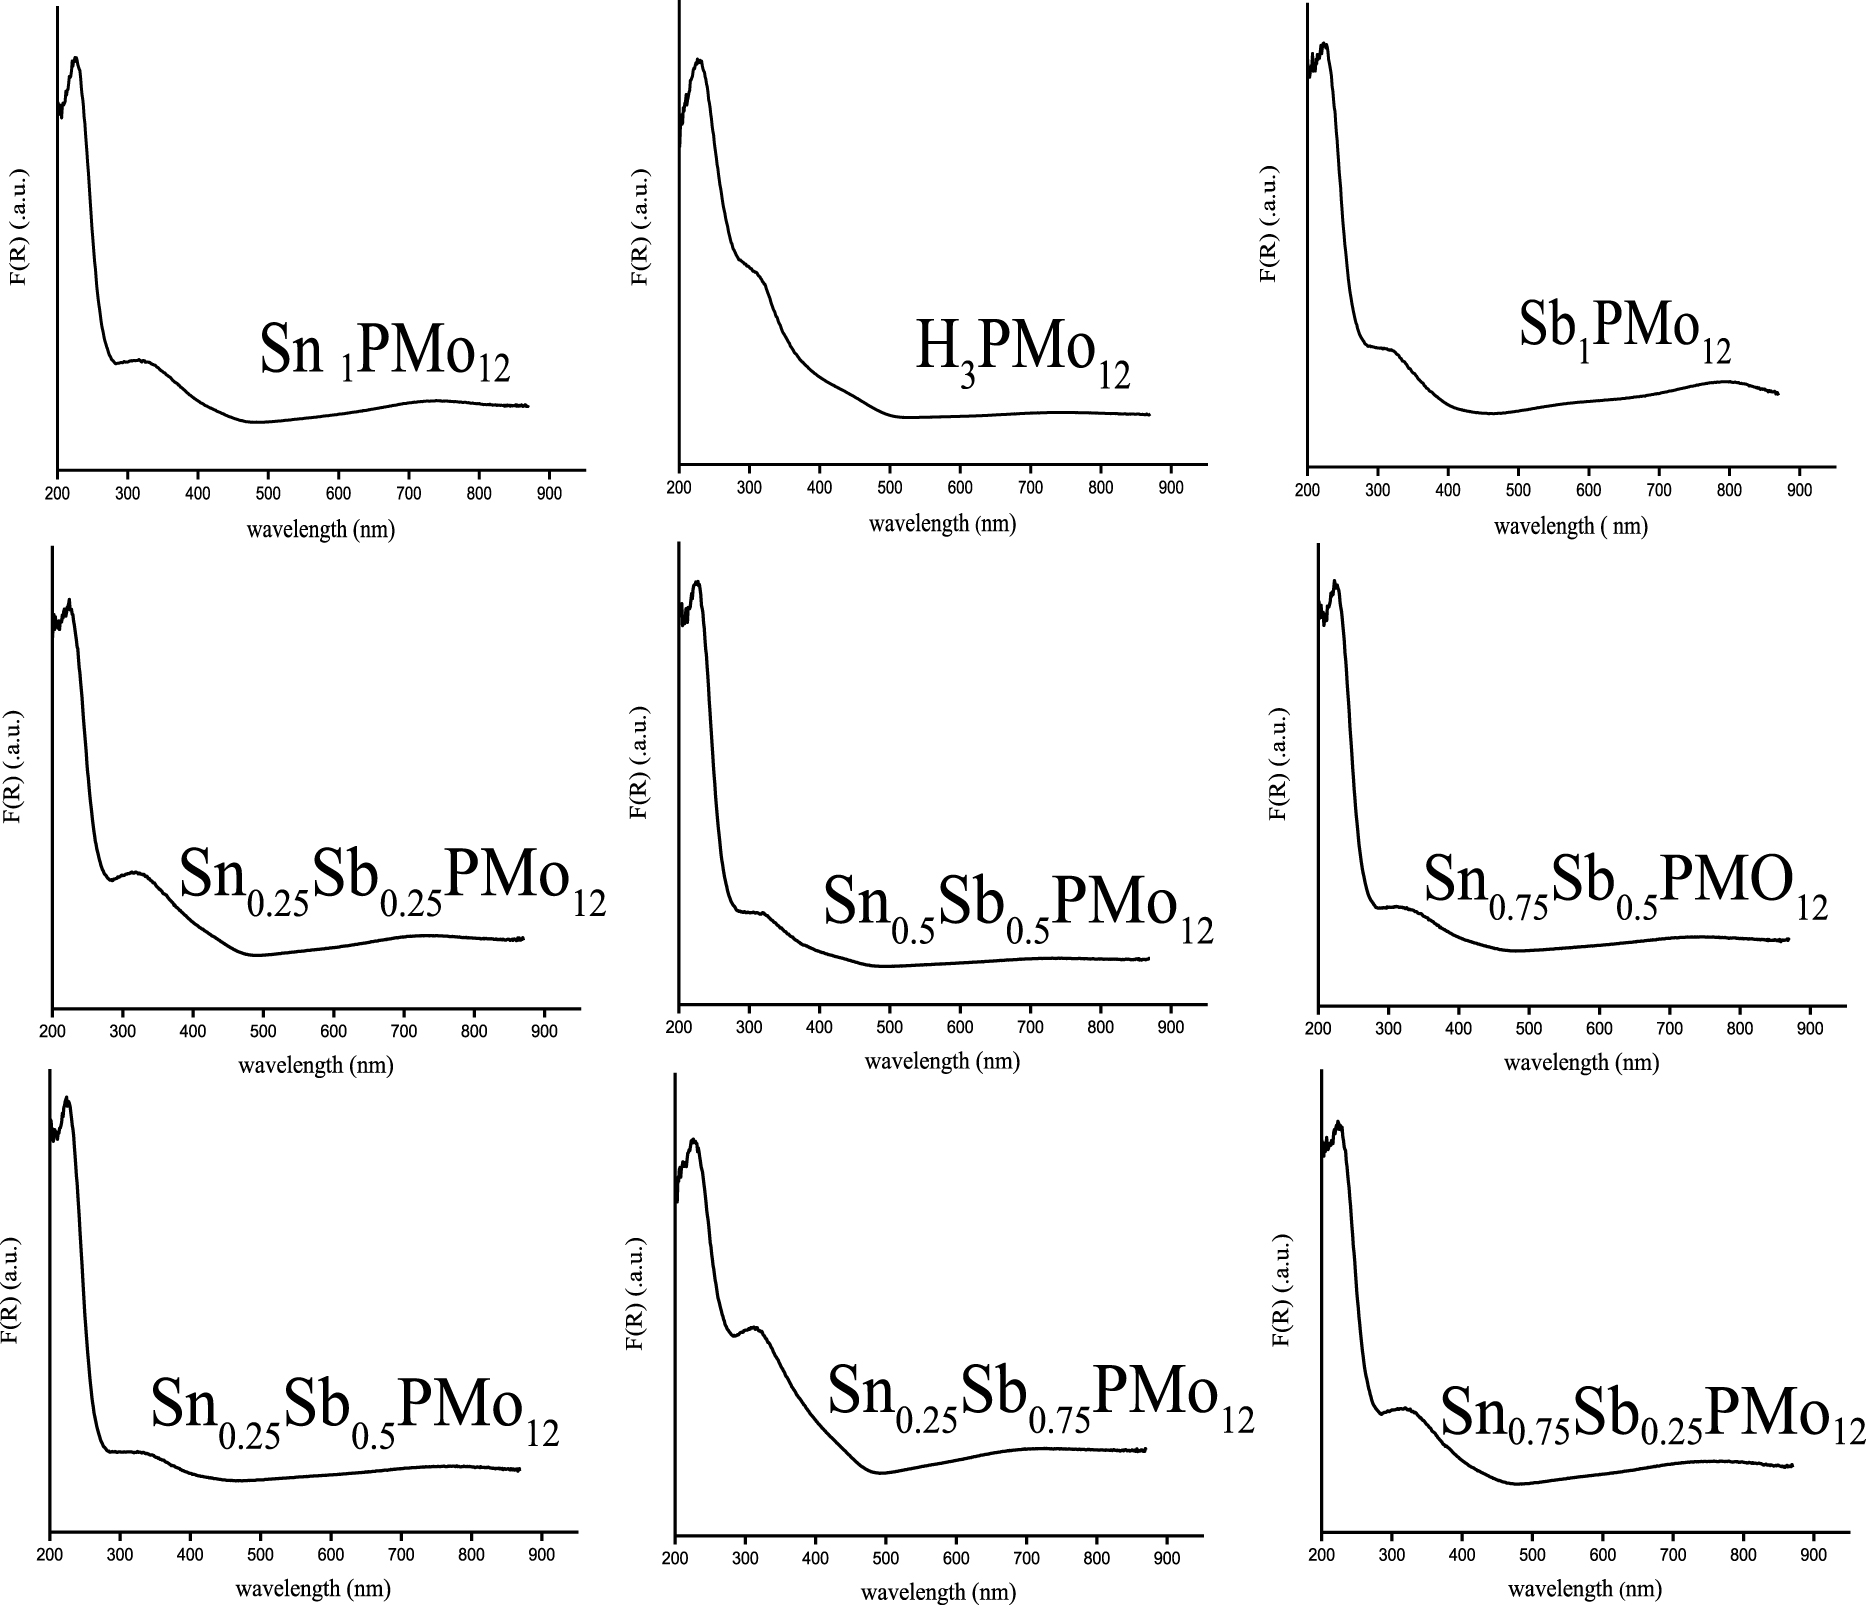
Figure 1 also shows for H3−xSnx1Sbx2PMo12O40 series, that the band intensity observed at 700 nm is sensitive to the stoichiometric coefficients of Sn and Sb atoms. When the Sn/Sb ratio is of 1 as in the case of Sn0.25Sb0.25 and Sn0.5Sb0.5, the band intensity increases from 1.08 to 1.45 a.u., with the increase of the Sn and Sb atom number from 0.25 to 0.5 (Table 1). The intensity of the band is higher for a Sn/Sb ratio of 3 (Sn0.75Sb0.25), than for a ratio of 1∕3 (Sn0.25Sb0.75), with 3.29 versus 2.52 a.u. These latter values are higher than those obtained in the case of Sn0.25Sb0.25 and Sn0.5Sb0.5 (1.08–1.45 a.u. for Sn/Sb = 1), Sn0.25Sb0.5 (2.3 a.u. for Sn/Sb = 1∕2) and Sn0Sb1 (2.63 a.u. for Sn/Sb = 0/1). From these results, we can observe, that the partial reduction of POM can be adjusted as a function of the stoichiometric coefficients of Sn and Sb atoms. In the H3−xSnx1Sbx2PMo12O40 series, the salt of formula Sn0.75Sb0.25 appears to be the most reduced with more molybdenum atoms with an oxidation state V, therefore more Sn(IV) and Sb(V) ions.
d–d transition band intensities (a.u.) of Mo(V) in the heteropolysalts deduced from UV–Vis analysis
| Catalyst | Sb1 | Sn1.5 | Sn0.25Sb0.25 | Sn0.25Sb0.5 | Sn0.25Sb0.75 | Sn0.5Sb0.5 | Sn0.75Sb0.25 | Sn0.75Sb0.5 |
|---|---|---|---|---|---|---|---|---|
| Band intensity (a.u.) | 2.63 | 3.13 | 1.08 | 2.3 | 2.52 | 1.45 | 3.29 | 1.84 |
3.1.2. FT-IR and Raman spectroscopies
FT-IR spectra of H3PMo12O40 and Sn-, Sb-based salts (Figure 2) show the phosphorus–oxygen and molybdenum–oxygen characteristic vibration bands of the Keggin anion, [PMo12O40]3−, in the low wavenumber region (1100–600 cm−1). In accordance with the literature data [42], the asymmetric stretching vas(P–Oa), is observed at 1056–1054 cm−1 and those of metal–oxygen, vas(Mo–Od), vas(Mo–Ob–Mo) and vas(Mo–Oc–Mo) at 952–949, 883–880 and 756–742 cm−1, respectively. Comparison of the frequency of the FT-IR vibration bands of SnxSbyPMo12O40 salts, with those of the parent acid (H3PMo12O40) revealed no significant difference, except for Sn1.5PMo12O40 where a shift from 742 to 774 cm−1 and a decrease in the intensity of the bands were observed, particularly that of vas(Mo–Oc–Mo). These perturbations can be attributed to the presence of mixed-valence Sn(II) and Sn(IV) in the POM, that would lead to a deeper change in the symmetry of POM in contrast to the mixed Sn/Sb salt by formation of MoVI–OC–MoV instead of MoVI–OC–MoVI.
FT-IR spectra of H3PMo12O40 (a), Sb0.25Sn0.25PMo12 (b), Sb0.5Sn0.5PMo12 (c), Sb0.5Sn0.75PMo12 (d), Sb0.5Sn0.25PMo12 (e), Sb0.75Sn0.25PMo12 (f), Sb0.25Sn0.75PMo12 (g), Sb1PMo12 (h) and Sn1.5PMo12 (i).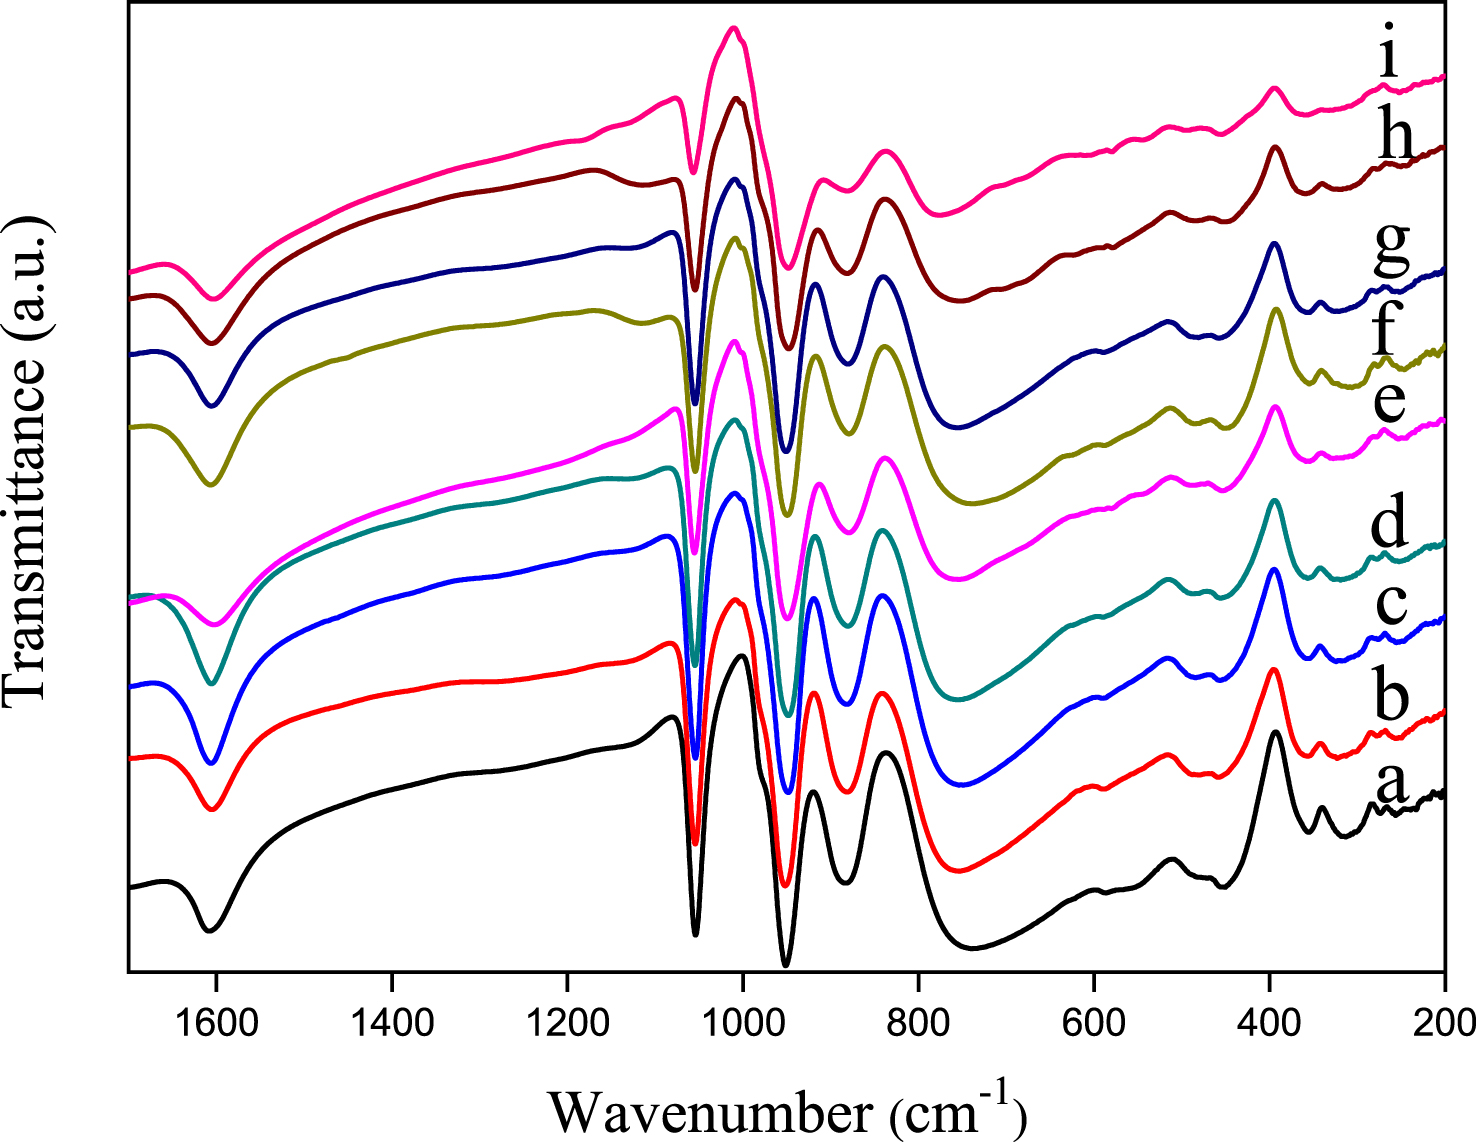
In conclusion, the Keggin anionic structure is well preserved despite the partially reduced state of POM, resulting from the introduction of Sb and/or Sn.
The Raman spectroscopy of the materials is shown in Figure 3. The phosphomolybdic acid, H3PMo12O40, exhibits the characteristic Keggin anion vibrational bands in the wave number region of 1100–200 cm−1. According to the literature [20, 43], the vibration bands observed at 998, 971, 908, 607 and 250 cm−1 are attributed to vs(Mo=Od), vas(Mo=Od), vas(Mo–Ob–Mo), vs(Mo–Oc–Mo) and vs(Mo–Oa), respectively. An important decrease in the intensity of all vibration bands was observed on salt spectra, except in the case of Sn0.25Sb0.25, the less substituted. On the other hand, the shoulders attributed to vas(Mo=Od), vas(M–Ob–Mo) and vs(Mo–Oc–M) are not clearly visible on the spectra, particularly in the presence of tin. Furthermore, the frequency of vs(Mo=Od) has increased from 998 to 1009–1006 cm−1 for all salts except for that of Sn0.25Sb0.25. These perturbations can be attributed to the partially reduced state of the heteropolyanion, confirmed by the dark blue-green color of the salt as reported by Dermeche et al. [41]. Compared to FT-IR, Raman spectroscopy seems to be sensitive to the reduction of molybdenum (VI) induced by the introduction of antimony and tin. These results are in agreement with those observed in UV–Vis spectroscopy. It should be noted that the vibration band corresponding to P–Oa could not be observed by Raman spectroscopy.
Raman spectra of H3PMo12O40 (a), Sb0.25Sn0.25PMo12 (b), Sb0.5Sn0.5PMo12 (c), Sb0.5Sn0.75 PMo12 (d), Sb0.5Sn0.25PMo12 (e), Sb0.75Sn0.25PMo12 (f), Sb0.25Sn0.75PMo12 (g), Sb1PMo12 (h) and Sn1.5PMo12 (i).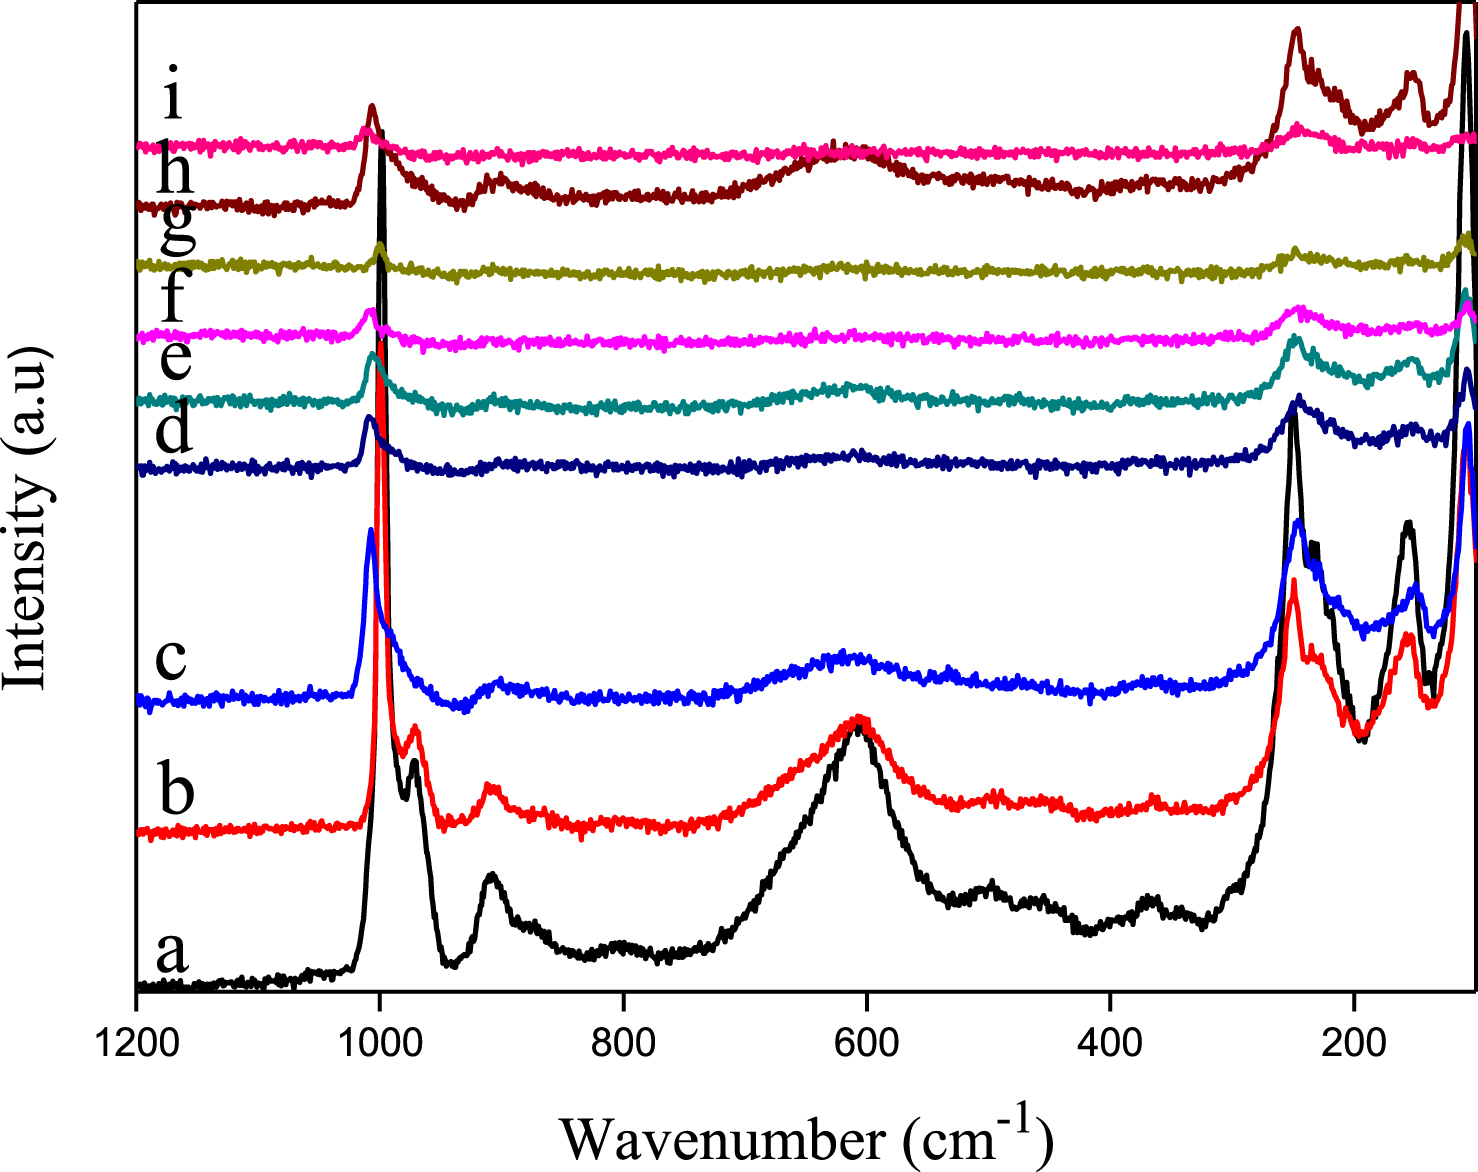
3.1.3. XRD characterization
Figure 4 shows that the XRD patterns of Sn1.5PMo12, SbPMo12 and H3−2xSnx1Sbx2PMo12O40 series are similar to that of the hydrated parent acid (H3PMo12O40⋅13H2O) that crystallizes in a triclinic system (PDF-ICDD 075-1588). It is known that soluble salts corresponding to counter-ions of small ionic radius, classified in the group A category, crystallize in a system of low symmetry such as triclinic [44, 45, 46, 47]. In the case of fully substituted salts (Sn1.5PMo12, SbPMo12), the decrease in ray intensity demonstrates a loss of crystallinity, resulting in a distortion of the crystal lattice as reported in the literature [27, 28, 48]. It is also well known that the XRD and IR spectra reflect the secondary structure of the POM and the primary structure of the Keggin anion, respectively. In contrast to the Keggin structure, the secondary structure is of a crystalline system that is strongly dependent on the water molecule hydration number and both the nature and radius of the counter-ion. The loss of crystallinity is also attributed to the simultaneous presence of ions with different oxidation states such as Sn(IV)/Sn(II) and Sb(V)/Sb(III), as observed in UV–Vis spectroscopy.
XRD patterns of H3PMo12O40 (a), Sn0.25Sb0.5PMo12 (b), Sn0.5Sb0.5PMo12 (c), Sn0.75Sb0.25PMo12 (d), Sb1PMo12O40 (e) and Sn1.5PMo12O40 (f).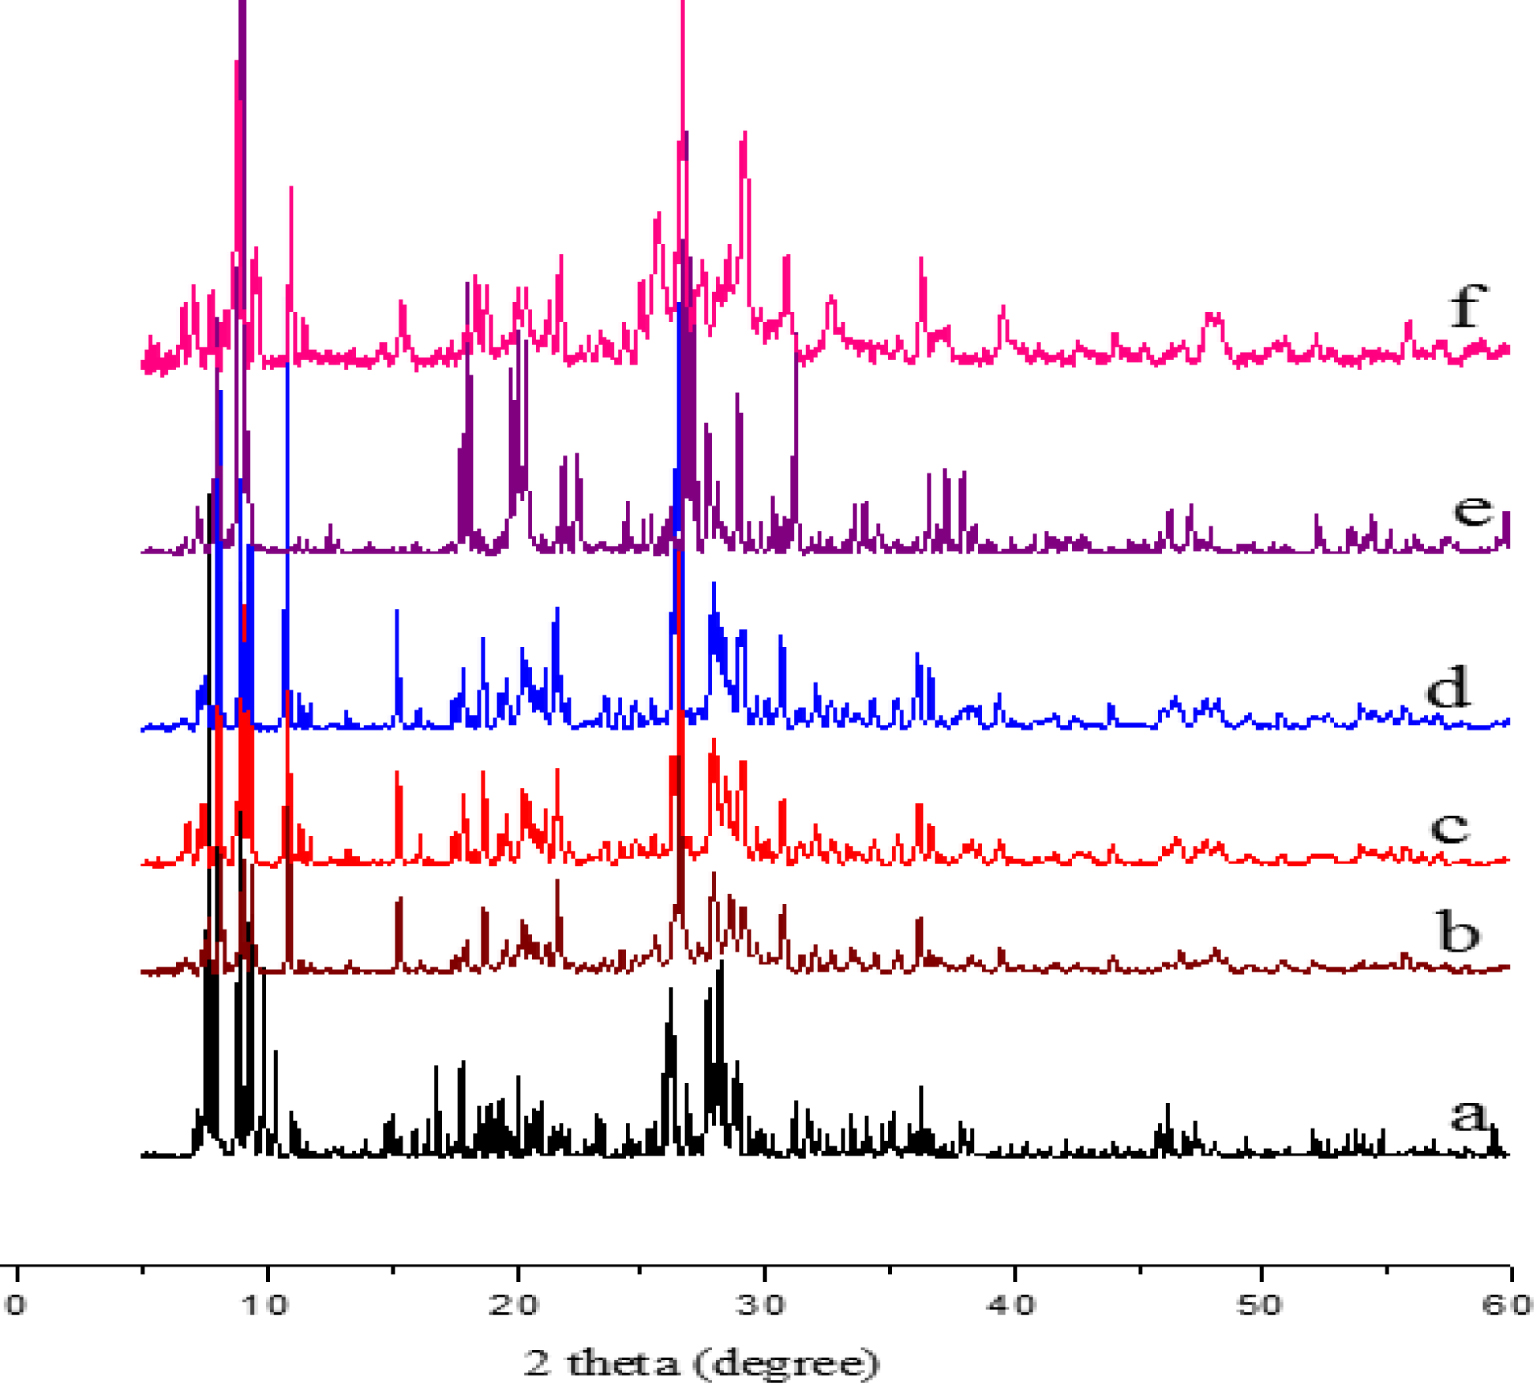
3.1.4. TG-DTA characterization
The TG-DTA curves of H3PMo12O40, SbPMo12 and H3−2xSnx1Sbx2PMo12O40 series presented in Figure 5, are similar with two weight loss steps between 25 and 400 °C. The first (25–200 °C) is attributed to the desorption of the crystallization water molecules and the second (200–400 °C) to those of constitution and/or those accompanying the Sb and Sn counter-ions as [M(H2O)x]n+Mn+: SnII, SnIV, SbIII and SbV. The higher the degree of oxidation, the more hydrated the ion [49]. This would explain the mass loss which extends from 200 to 400 °C. The DTA curves of all POMs show a strong exothermic peak around 440 °C, reflecting the crystallization of the different oxides originating from the decomposition of the POM (P2O5, MoO3, SnO/SnO2, Sb2O3/Sb2O5). Partial or total substitution of protons by antimony and/or tin ions does not appear to affect the thermal stability of POM.
TG–DTA diagrams of H3PMo12O40 (a), Sn0.25Sb0.25PMo12 (b), Sb1PMo12 (c), Sn0.25Sb0.5PMo12 (d), Sn0.75Sb0.25PMo12 (e), Sn0.75Sb0.5PMo12 (f), Sn0.5Sb0.5PMo12 (g) and Sn0.25Sb0.75PMo12 (h).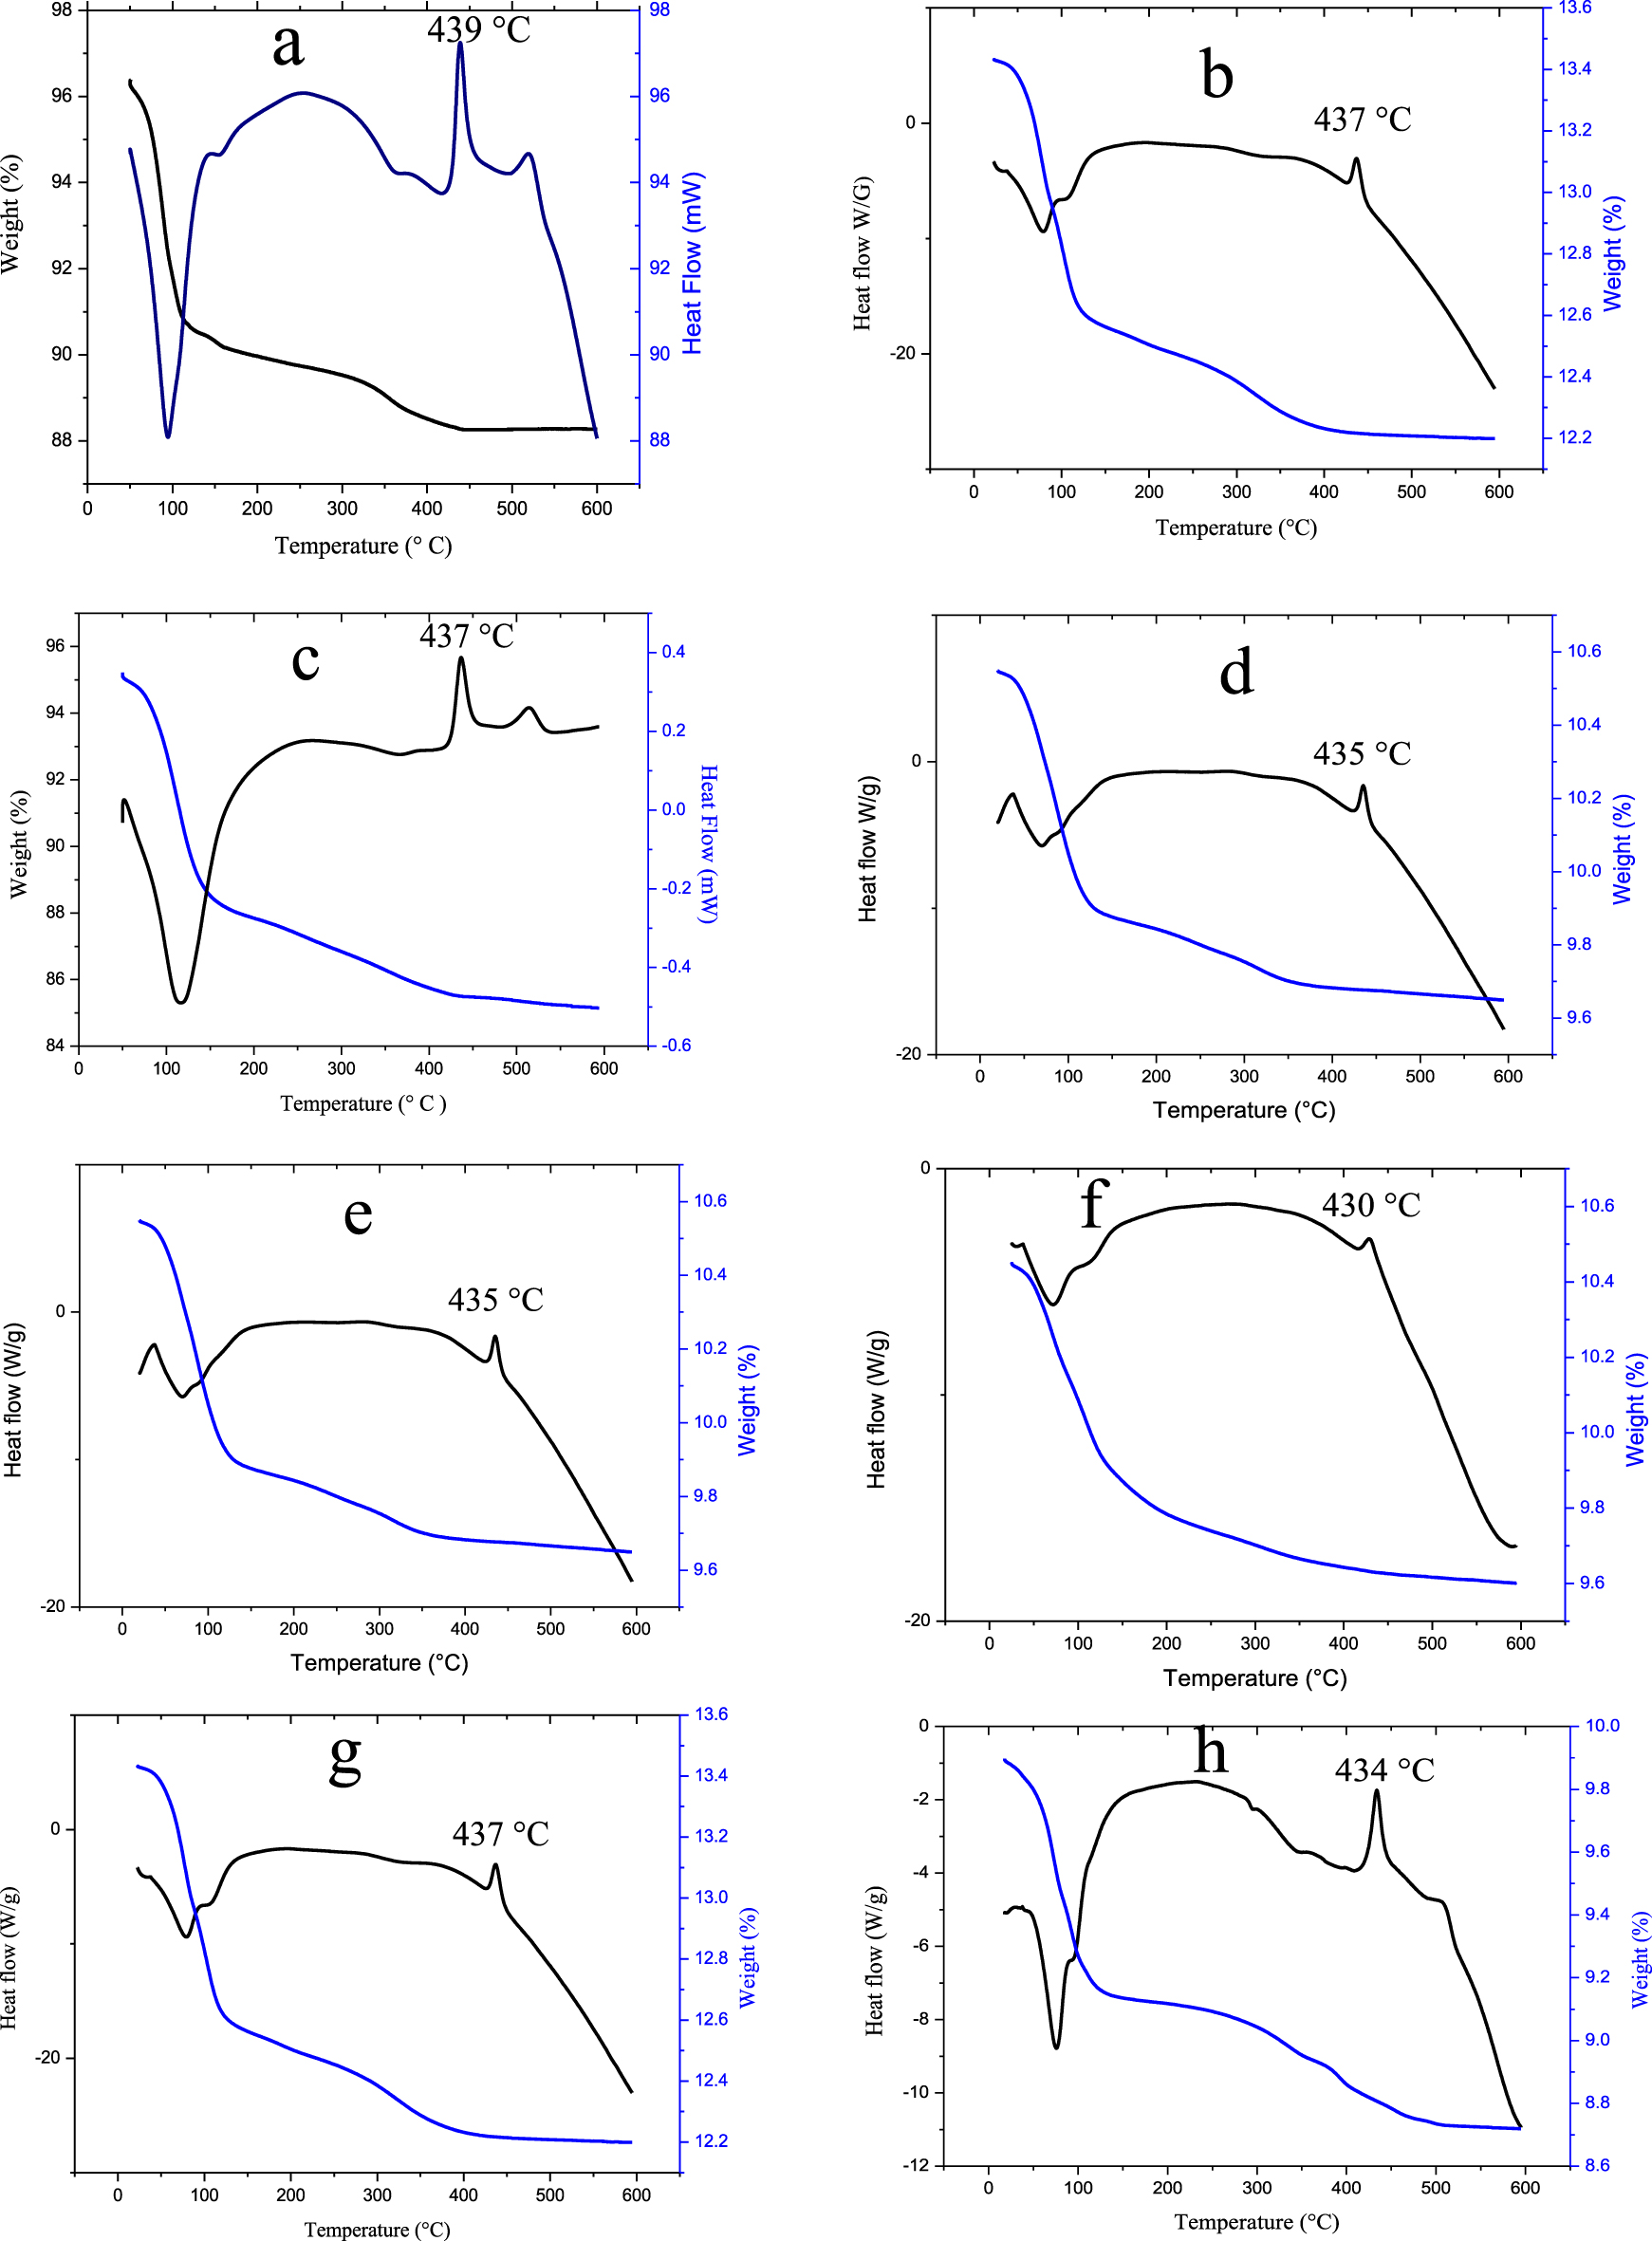
3.1.5. XPS characterization
Table 2 presents the binding energies of elements, determined from XPS analysis. For H3PMo12O40, taken as reference, the binding energies determined are 531.2 eV for oxygen (O 1s), 134.2 eV for phosphorus (P 2p) in its oxidation state V and 233.2 eV for molybdenum (Mo 3d) in its highest oxidation state (VI). These values are characteristic of the elements of the Keggin unit () [50].
Binding energies (eV) of different elements of the heteropolysalts deduced from XPS analysis
| PMo12 | Sb0.5PMo12 | Sn0.5PMo12 | Sn0.25Sb0.25PMo12 | Sn0.5Sb0.5PMo12 | |
|---|---|---|---|---|---|
| O 1s | 531.2 | 531.4 | 530.9 | 531.2 | 531.1 |
| P 2p | 134.2 | 134.4 | 134.0 | 134.3 | 134.4 |
| Mo 3d | 233.2 | 233.1 | 233.1 | 233.4 | 233.3 |
| Mo(VI) 3d3/2 | / | 233.2 | 233.4 | 233.3 | |
| Mo(VI) 3d5/2 | / | 236.3 | 236.5 | 236.5 | |
| Mo(V) 3d3/2 | / | 232.0 | 232.0 | 232.0 | |
| Mo(V) 3d5/2 | / | 235.2 | 235.2 | 235.2 | |
| C 1s | 284.8 | 284.8 | 284.8 | 284.8 | 284.4 |
| Sn 3d | / | / | 487.5 | 487.2 | 487.1 |
| Sb 3d3/2 (Sb3+) | / | 541.38 | |||
| Sb 3d3/2–Sb2O5 (Sb5+) | / | 541.69 | |||
| Sb 3d5/2 | / | 532.95 | |||
| Sb 3d5/2–Sb2O5 | / | 534.28 | |||
| O 1s | / | 530.9 | |||
| O 1s | / | 532.0 | |||
| O 1s | / | 533.6 |
XPS spectrum of Sn0.5PMo12 (Figure 6c) shows two photo peaks in the range 496–488 eV, characteristic of Sn 3d5/2 and Sn 3d3/2. Based on literature data, the binding energy value of 487.2 eV, does not permit to distinguish between both oxidation states II and IV of tin [26, 29]. However, the detection of both Mo(V) 3d5/2 and Mo(V) 3d3/2 with binding energies of 232.0 and 235.2 eV, respectively, in addition to those of Mo(VI) 3d5/2 and Mo(VI) 3d3/2 with binding energies of 233.2 and 236.3 eV, respectively [51], indicates that tin may be present also as Sn(IV), results in agreement with those observed in UV–Vis that have evidenced the presence of Mo(V). In conclusion, H2Sn0.5PMo12 is a compound partially reduced with the presence of both Sn(IV)/Sn(II) and Mo(VI)/Mo(V) couples.
XPS spectra of Mo core levels of H1.75Sn0.25Sb0.25PMo12O40 (a), H0.5Sn0.5Sb0.5PMo12O40 (b) and Sn 3d core of: H2Sn0.5PMo12, H1.75Sn0.25Sb0.25PMo12O40, H0.5Sn0.5Sb0.5PMo12O40 (c) and Sb 3d + O 1s core of H0.5Sb0.5PMo12 (d).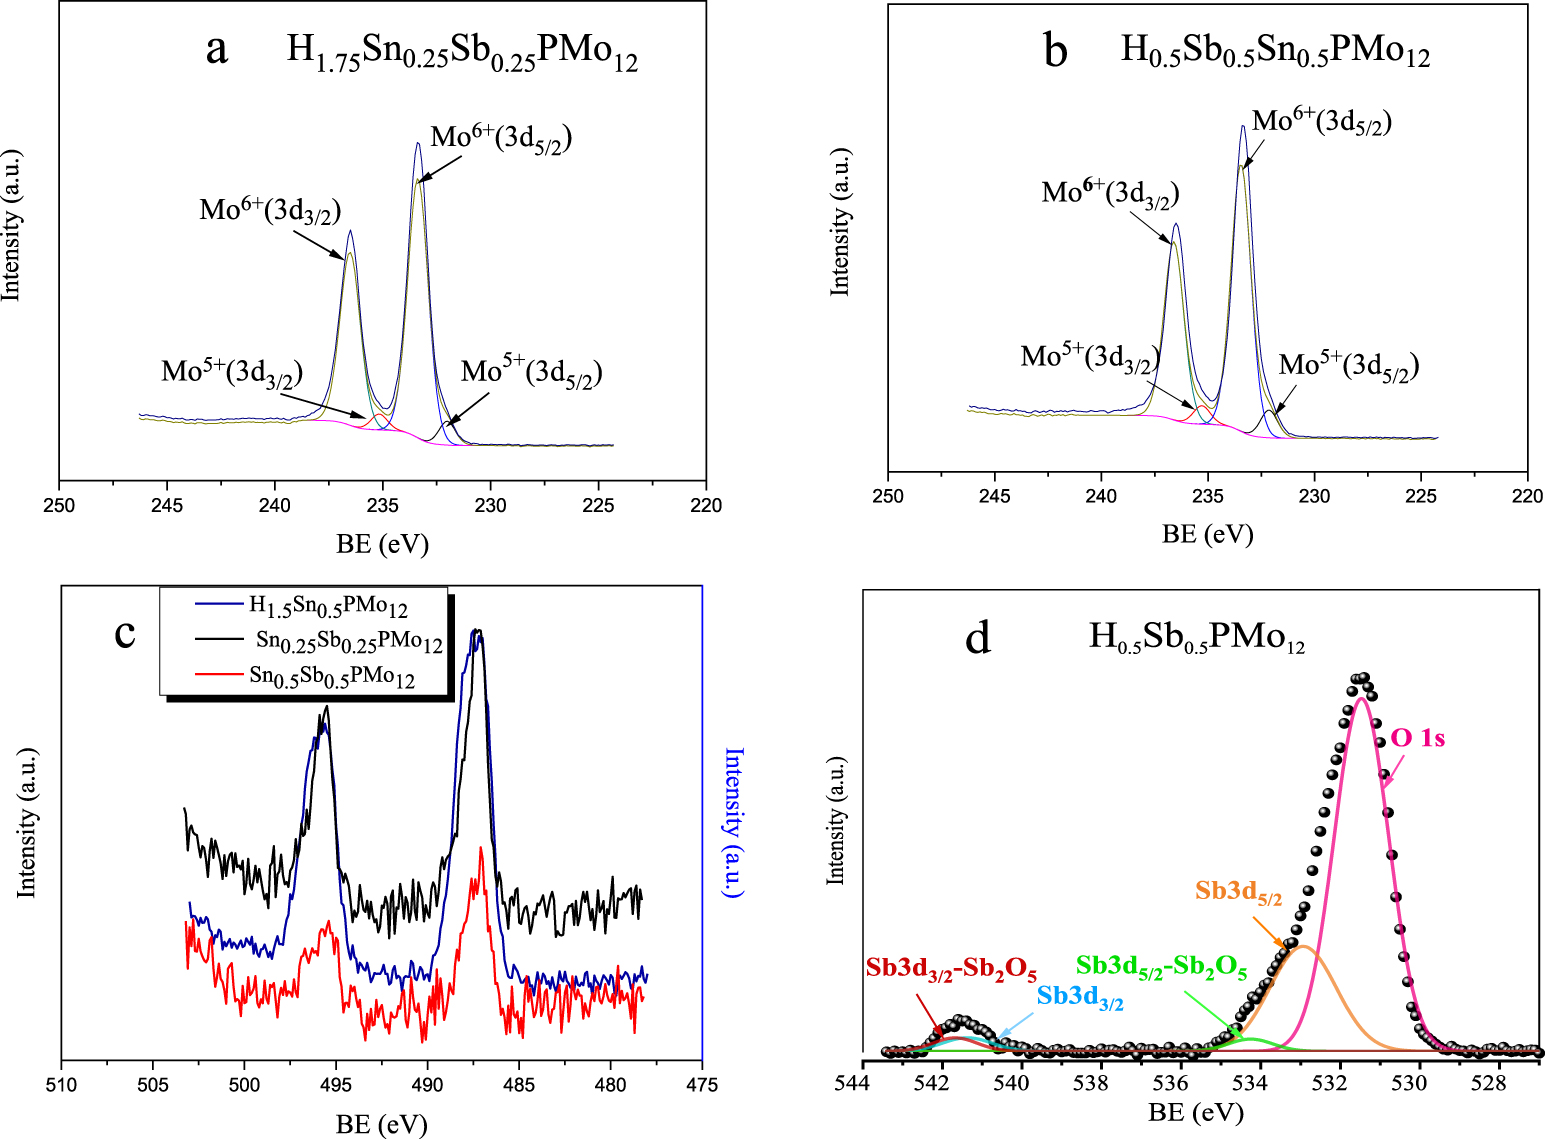
The XPS spectrum of Sb0.5PMo12 (figure not shown) displays the presence of three deconvoluted photo peaks with binding energies of 530.9, 532.0 and 533.6 eV revealing the existence of three types of oxygen atoms, that are probably terminal oxygen (Od), and bridging oxygen atoms (Ob and Oc) bonded to molybdenum atoms of the POM framework, as reported by Grinenval et al. [52]. On the other hand, the peak associated to Mo 3d was observed with an energy of 233.1 eV (Table 2). The binding energy values of 541.38 and 532.95 eV, given in Table 2 (Figure 6d), can be attributed to Sb 3d3/2 and Sb 3d5/2, respectively, characteristic of oxidation state III, and those of 541.69 and 534.28 eV to Sb 3d3/2 and Sb 3d5/2, respectively, characteristic of oxidation state V, in accordance with literature data [30, 53]. The presence of oxidation state V of antimony confirms, therefore the reduction of Mo(VI) to Mo(V), a result consistent with that observed in the UV–Vis. In conclusion, H1.5Sb0.5PMo12 is also a compound partially reduced with the presence of both Sb(V)/Sb(III) and Mo(VI)/Mo(V).
In the case of mixed salts (Figures 6a and b), the binding energies of the molybdenum atoms at different oxidation degrees of Sn0.25Sb0.25PMo12, corresponding to the spin states Mo(VI) 3d3/2 (233.4 eV), Mo(VI) 3d5/2 (236.5 eV), Mo(V) 3d3/2 (232.0 eV) and Mo(V) 3d5/2 (235.2 eV) and those of Sn0.5Sb0.5PMo12, Mo(VI) 3d3/2 (233.3 eV), Mo(VI) 3d5/2 (236.5 eV), Mo(V) 3d3/2 (232.0 eV) and Mo(V) 3d5/2 (235.2 eV) are similar to those of Sn0.5PMo12 Mo(VI) 3d3/2 (233.2 eV), Mo(VI) 3d5/2 (236.3 eV) Mo(V) 3d3/2 (232.0 eV), Mo(V) and 3d5/2 (235.2 eV) (figure not shown). The Sn 3d binding energies in Sn0.25Sb0.25PMo12 and Sn0.5Sb0.5PMo12 are of 487.2 and 487.1 eV, respectively, equivalent to those obtained with Sn0.5PMo12 (487.5 eV), while the binding energies corresponding to the antimony atoms could not be detected, probably due to its very small amount or due to overlapping with the oxygen peaks.
These results seem to suggest that in the mixed salts, the influence of tin predominates over that of antimony, probably related to the stronger reducing character of tin. The presence of molybdenum in oxidation states (V) and (VI) can only confirm that of Sn(II) and Sn(IV) in the mixed salts.
Table 4 shows the percentage of molybdenum and the Mo(V)/Mo(VI) atomic ratios for Sn0.5PMo12, Sn0.25Sb0.25 and Sn0.5Sb0.5, determined from the surface percentages calculated in Table 3. For the three salts, the obtained ratios of Mo(VI)/Mo(V) are of 11–13. Referring to the Keggin unit, we can conclude that on average, one Mo atom out of 12 has undergone a reduction.
Atomic percentages of different elements of the heteropolysalts deduced from XPS analysis
| PMo12 | Sb0.5PMo12 | Sn0.5PMo12 | Sn0.25Sb0.25PMo12 | Sn0.5Sb0.5PMo12 | |
|---|---|---|---|---|---|
| O 1s | 54.2 | 47.7 | 53.9 | 46.1 | 43.0 |
| P 2p | 2.6 | 1.9 | 2.4 | 1.8 | 1.6 |
| Mo 3d | 19.1 | 14.5 | 18.0 | 16.4 | 14.8 |
| Mo(VI) 3d3/2 | 46.0 | 46.5 | 45.8 | ||
| Mo(VI) 3d5/2 | 46.2 | 46.6 | 46.0 | ||
| Mo(V) 3d3/2 | 3.9 | 3.4 | 4.1 | ||
| Mo(V) 3d5/2 | 3.9 | 3.5 | 4.1 | ||
| C 1s | 24.1 | 36.0 | 25.2 | 35.5 | 40.4 |
| Sn 3d | 0.5 | 0.2 | 0.1 | ||
| Sb 3d3/2-metal (Sb3+) | 1.2 | ||||
| Sb 3d3/2–Sb2O5 (Sb5+) | 0.3 | ||||
| Sb 3d5/2-metal | 1.2 | ||||
| Sb 3d5/2–Sb2O5 | 0.3 | ||||
| O 1s | 56.8 | ||||
| O 1s | 35.3 | ||||
| O 1s | 4.9 |
Surface atomic ratios of Mo(V)/Mo(VI) and number of Mo(V) and Mo(VI) deduced from XPS analysis
| POM | Mo(VI) (at.%) | Mo(V) (at.%) | Mo(V)/Mo(VI) | Mo(VI) number | Mo(V) number |
|---|---|---|---|---|---|
| Sn0.5PMo12 | 92.2 | 7.8 | 0.0846 | 11.064 | 0.936 |
| Sn0.25Sb0.25PMo12 | 93.1 | 6.9 | 0.0741 | 11.172 | 0.828 |
| Sn0.5Sb0.5PMo12 | 91.8 | 8.2 | 0.0893 | 11.016 | 0.984 |
3.1.6. Electrochemical characterization
Figure 7 shows the reversible cyclic voltammograms of aqueous solutions of H3PMo12O40, Sn0.5PMo12, Sb0.5PMo12, Sn0.25Sb0.25PMo12 and Sn0.5Sb0.5PMo12. The valence changes of the Mo species, Mo(VI)/Mo(V), in H3PMo12 exhibits, during cathodic sweep, two peaks at ca. 0.27 and ca. −0.13 V, suggesting two electrochemical reactions with a transfer of two electrons for each step as reported by several authors [54, 55, 56]. The tin introduction (Sn0.5PMo12) leads to a decrease in the reduction potential of molybdenum from 0.27 to 0.15 V, resulting from its pronounced reducing character. This effect was not observed with antimony (Sb0.5PMo12) and its presence does not seem to influence the oxidizing power of molybdenum. With mixed salts Sn0.25Sb0.25PMo12 and Sn0.5Sb0.5PMo12, the reduction potential of Mo(VI)/Mo(V) varies slightly (from 0.27 to 0.23 and 0.24 V, respectively). These results are consistent with those observed in UV–Vis and XPS analysis which showed the existence of the redox couples Mo(VI)/Mo(V), Sn(IV)/Sn(II) and Sb(V)/Sb(III).
Cyclic voltammogram curves of H3PMo12O40 (a), H2Sn0.5PMo12 (b), H1.5Sb0.5 PMo12 (c), H1.75Sn0.25Sb0.25PMo12O40 (d) and H0.5Sn0.5Sb0.5PMo12O40 (e) (scan rate: 10 mV⋅s−1).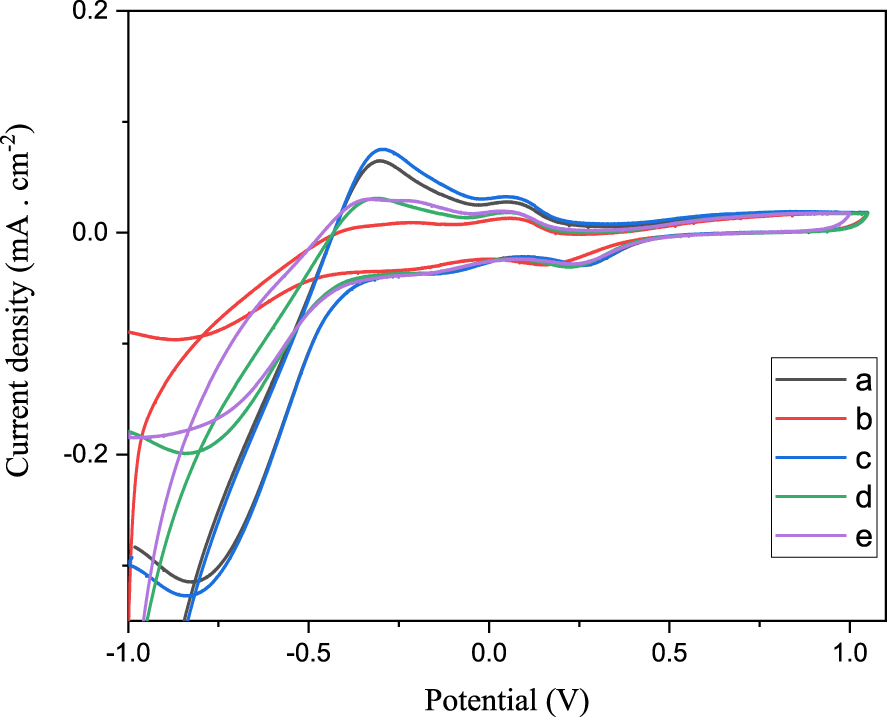
3.2. Catalytic test
Works carried out in our laboratory have shown that a reaction time of 20 h is required to achieve the highest AA yield [17, 24, 57]. In order to determine the best catalyst/cyclohexanone ratio leading to the highest yield of AA, various preliminary tests were carried out with H0.75Sb0.75PMo12O40 catalyst, soluble salt. The obtained results are represented in Figure 8. An increase in the molar ratio by a factor of 2, from 1.59 × 10⁻⁴ to 3.18 × 10⁻⁴, led to a strong increase of AA yield from 26 to 49%. Up to a molar ratio of 3.18 × 10⁻⁴, the AA yield decreases progressively with the increasing molar ratio to reach a value of 33% for a molar ratio of 9.53 × 10⁻⁴. It should be noted that for a ratio of 2.87 × 10⁻³, the AA yield is of 42%. So, the molar ratio of 3.18 × 10⁻⁴ was fixed for the catalytic tests carried out on all the series of salts.
AA yield and conversion as function of ncatalyst∕none molar ratio, catalyst: H0.75Sb0.75 PMo12O40. Reaction conditions: ncyclohexanone: 90 mmol, mcatalyst: 0.0625 g, time: 20 h, temperature: 90 °C, mixture agitation rate: 1000 rpm.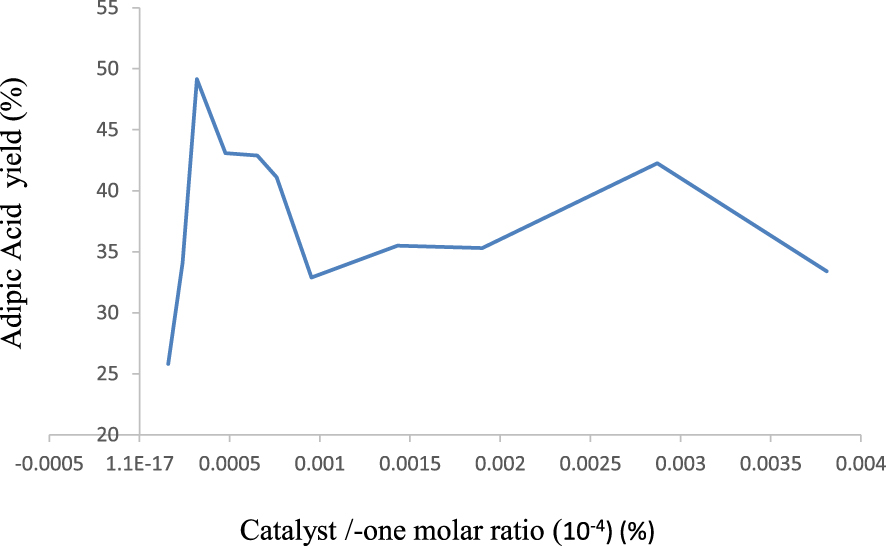
Table 5 shows the obtained AA yields over Sn and/or Sb-based salts. In HxSby series, the highest AA yield was obtained in the presence of salt of formula H0.75Sb0.75 with 49 against 44, 24 and 21% for H0Sb1, H2.25Sb0.25 and H1.5Sb0.5, respectively. It should be noted that in the absence of proton, the AA yield obtained with H0Sb1 (44%) is almost twice as high as those obtained with H1.5Sb0.5 (21%) and H2.25Sb0.25 (24%). These results suggest that the best AA yields were obtained when the Sb atom number is superior to 0.5 per Keggin unit. Among them, H0.75Sb0.75 catalyst was found to be the most efficient.
Adipic acid yields obtained from cyclohexanone oxidation over Sn- and/or Sb-based salts
| HxSby | AA yield (%) | HxSny | AA yield (%) | SnxSby | AA yield (%) |
|---|---|---|---|---|---|
| H2.25Sb0.25 | 24 | H2.5Sn0.25 | 30 | H0.75Sb0.25Sn0.75 | 37 |
| H1.5Sb0.5 | 21 | H2Sn0.5 | 35 | Sb0.5Sn0.25 | 30 |
| H0.75Sb0.75 | 49 | H1.5Sn0.75 | 39 | Sb0.5Sn0.75 | 26 |
| H0Sb1 | 44 | H1Sn1 | 28 | Sb0.25Sn0.25 | 31 |
| H0.5Sn1.25 | 35 | Sb0.5Sn0.5 | 35 | ||
| H0Sn1.5 | 33 | Sb0.75Sn0.25 | 23 |
Reaction conditions: ncatalyst∕none molar ratio = 3.18 × 10⁻⁴, time: 20 h, temperature: 90 °C, mixture agitation rate: 1000 rpm.
In HxSny series, the highest AA yield was obtained in the presence of H1.5Sn0.75 with 39 against 28–35% for other salts of the same series. Based on the UV–Vis analysis results and comparing the intensity of the absorption band corresponding to Mo(V), it can be deduced that a moderate reduction state of salt would favor the AA formation.
In the SnxSby series, the best combination leading to the highest AA yield is H0.75Sn0.75Sb0.25 with 37% against 23–35% for the other formulations, similar results to those obtained with the HxSny series. Therefore, the AA production does not seem to be influenced by the Sb addition.
The difference in the catalytic performance between H0.75Sb0.75 and H1.5Sn0.75 can be attributed to the higher oxidation states of the antimony atoms Sb(V)/Sb(III) compared to those of tin Sn(IV)/Sn(II). Thus, a judicious combination of elements in the chemical composition of the salt can lead to an effective catalyst in the cyclohexanone oxidation to AA.
In our previous works [15, 17], it was observed by P31NMR, after the cyclohexanone oxidation in the presence of hydrogen peroxide, carried out under the same operating conditions as those used in this work, the presence of heteropolyanionic species, different from those observed before oxidation reaction. They were attributed to peroxometallic species. In the case of Sn1.5PMo12O40, SbPMo12O40 and H3−2xSnx1Sbx2PMo12O40 (x = x1 + x2 and x = 0–0.75) salts, it can be assumed that the peroxometallic species that would constitute the active sites, would be based on molybdenum and also on tin and/or antimony. The peroxometallic species resulting from the Keggin-type HPA decomposition in the presence of hydrogen peroxide have already been reported by several authors [58, 59, 60] as [W2O3(O2)4(H2O)2]2−, [PO4(WO(O2)2)4]3−, [{HPO4(WO(O2)2}2]2− and [W2O3(O2)4(H2O)2]2−, [{WO(O2)2(H2O)}2(𝜇-O)]2−, {W2O2(𝜇-O2)(O2)2}.
4. Conclusion
Sn1.5PMo12O40, SbPMo12O40 and H3−2xSnx1Sbx2 PMo12O40 (x = 2x1 + 3x2 and x1, x2 = 0–0.75) materials were synthesized, characterized and tested in the cyclohexanone oxidation in the presence of hydrogen peroxide at 90 °C. The cationic exchange method used in the preparation of these salts allowed to fix precisely the stoichiometric coefficients of Sn and Sb atoms.
FT-IR and Raman spectroscopic analysis also showed that the Keggin structure was preserved. UV–Vis and XPS analysis showed that the salts are of mixed valence with oxidation states of Mo(VI)/Mo(V), Sb(V)/Sb(III) and Sn(IV)/Sn(II) and the valence change of the Mo species, Mo(VI)/Mo(V) was confirmed by electrochemical characterization.
The POMs are found to be active in the cyclohexanone oxidation and among them, the most efficient is H0.75Sb0.75 with 49% yield of AA.
Conflicts of interest
Authors have no conflict of interest to declare.