


 CC-BY 4.0
1. Introduction
The non-renewable nature of petroleum, petrochemicals and petroproducts has shifted global attention to biofuels. This paradigm shift is beneficial as biofuels are comparatively non-toxic, sulfur-free and biodegradable in nature [1]. Lignocellulosic biomass-based biofuels (e.g., bioethanol) is envisioned as one of the economically viable alternatives to the current petroleum-based energy sources and petrochemical products [2, 3]. However, bioethanol production occurs only when biomass are fermented with suitable microbes [4], and this is favored by the abundance of exploitable biomass and microorganisms [5].
There is available literature on studies investigating the destructuring of cell wall polysaccharides to fermentable (total reducing) sugars, which is a critical step for lignocellulose conversion into bioethanol. For example, the utilization of thermal liquefaction [6] as well as acid and alkaline hydrolysis [7] have been explored. Nevertheless, the extent to which this deconstruction is effected largely depends on the type of pretreatment and biomass chosen [8]. This, on the other hand, is dictated by the overall cost, environmental footprint and energy efficiency of the method [9]. Among the different pretreatment methods, very few approaches (e.g., hot water pretreatment) provide high total reducing sugars (TRS) with little investment [10]. Hot water pretreatment requires no or little additional chemicals, shorter residence times, and is comparatively more energy efficient. At high pressures and temperatures, water becomes acidic, and it induces autohydrolysis of glycosidic bonds, thereby resulting in the solubilization of hemicellulose and partial delignification of the biomass [11]. Similarly, acetic acid/sodium chlorite solution has been used for delignification of biomass [12]. In a recent investigation, addition of sodium chlorite (NaClO2) directly to fermenting water hyacinth (WAHT) without prior pretreatment was neither harmful to the microbes nor expensive (as it eliminated the cost of acetic acid) [13]. This particularity prompted us to investigate the use of NaClO2 with thermal treatment in WAHT fermentation.
On the other hand, consolidated bioprocessing is a unit operation where more than one microorganism hydrolyses and ferments biomass in a single step. For this reason, thermophilic microbes are more useful because they can utilize both pentose and hexose sugars, and are provenly resistant to fermentation inhibitors [14]. When used as a consortium, thermophilic microbes tend to be more stable, productive and functional at optimal conditions [15]. Thus, establishing the best (optimal) parameters for fermentation using microbial consortium and enzymes is crucial to improve substrate utilization and increase the yield of bioethanol [16]. This step is usually achieved using Response Surface Methodology, a multivariate statistical technique that allows the determination of multivariate equations for the experimental data and realizing an optimized experimental design [17]. Therefore, this study focuses on the optimization of bioethanol production from WAHT (Eichhornia crassipes), a pleustophytic ecological plague and noxious weed found in frost-free water bodies globally. In the lentic waters of Lake Victoria (East Africa), WAHT has presented various challenges. For example, it has been cited to constrain navigation, water treatment, electricity generation and irrigation operations as well as enhancing the spread of waterborne diseases [18]. This study proposes to pretreat WAHT using boiling water with NaClO2, followed by fermentation with a thermophilic microbial consortium isolated from some selected environmental matrices of Kenya, East Africa. To the best of our knowledge, no previous study has used this pretreatment combination for optimized bioethanol production via partially consolidated bioprocessing approach.
2. Materials and methods
2.1. Feedstock collection
The WAHT feedstock for this research was manually harvested from Ahero irrigation scheme in the propinquity of River Nyando (0°11′ 0°19′S, 34°47′ 34°57′E) on the Kenyan portion of Lake Victoria, East Africa. The plants were collected in bags and transported to the laboratory at Moi University, Kenya. They were cleaned thrice with tap water, and the roots were cut off. The feedstock was left to dry at room temperature under shade for a fortnight, and then oven-dried for 3 days at 105 °C to constant weight [19]. Thereafter, the feedstock was ground to a final particle size of 0.2 mm using a NutriBullet® 600 Series electric grinder (Capbran Holdings, LLC Los Angeles, USA).
2.2. Feedstock pretreatment and charcterization
Accordingly, WAHT was subjected to thermochemical pretreatment with boiling water only or with NaClO2 solution. Precisely weighed 3.0 g of WAHT powder was dissolved in 100 mL of a 1 mg/L NaClO2 solution and the mixture kept in a boiling water bath for 4 h. Measured 2 mL of the hydrolysate was drawn every one hour to quantify the TRS. After 4 h, the entire sample was centrifuged at 6000 rpm for 30 min, and the supernatant was used to quantify the TRS.
To characterize the feedstock, both untreated and pretreated WAHT were subjected to Fourier-transform infrared (FTIR) spectral analysis using an IRAffinity-1S FTIR spectrophotometer (Shimadzu Corporation, Japan) in the attenuated total reflectance mode (4 cm−1 spectral resolution scanning between 4000 and 400 cm−1).
2.3. Sampling and isolation of thermophilic microbes
Samples with thermophilic bacteria were obtained in sterilized plastic containers from two different sites. The first sample was taken from a new and an old biodigester at Moi University, Kenya (0°17′3.2′′N 35°17′31.2′′E). The temperature and pH of the digesters were 28 °C and 5.6, respectively. The second site was a hot spring in the Chemurkeu area on the shores of Lake Bogoria (0°13′33′′N and 36°05′41′′E), an East African soda lake. On April 17th 2021, water samples were drawn using sterilized thermal flasks from a hot spring (at 92 °C and pH 8). Similarly, sediments and microbial mats (at 56.7 °C and pH 8.4) were sampled.
To isolate thermophilic bacteria, serial dilution followed by plating on nutrient agar was done on the same day the samples were collected. Measured 1 μL of the inocula were taken from all the dilutions, transferred onto prepared media and then incubated at 50 °C for 48 h. Thereafter, they were subcultured to obtain pure cultures.
2.4. Microbial profiling of the isolates
Morphological characterization of the microbial isolates was achieved through microscopic observation of the colonies, texture as well as pigmentation [20]. Gram stains of each isolate was examined under a microscope, and this was done in duplicate [21]. Gram staining result was repeated with potassium hydroxide test. Physiological tests were based on the growth of the bacteria at various sodium chlorite concentrations (2–10% w/v), pH ranges (5.5–8.5) and incubation temperatures (22–60 °C).
Further, the isolates were subjected to different biochemical tests—namely, glucose fermentation [19], Triple Sugar Iron, starch hydrolysis [22], catalase test, MacConkey agar [23], eosin methylene blue agar [24], oxidase test [25], methyl red test [26], mannitol salt agar [27], Simmon’s Citrate agar [28] and Kligler Iron Agar test [29].
2.5. Feedstock utilization spectrum and microbial consortium development
A total of eight pure bacterial isolates were obtained through serial dilution technique, and were separately tested under the same conditions for their ability to utilize different substrates. The fermentation broth medium was prepared according to previous authors [30] with slight modifications. It contained (per liter) 1 g of NH4SO4, 1 g of peptone, 2 g of MgSO4⋅7H2O, 0.1 g FeSO4 and 0.1 g CaCl2, 2 g of trisodium citrate, 1 g of K2HPO4, 5 g of yeast extract and 0.5 g of KH2PO4. The experiment was conducted at pH 7 and 50 °C. The pH was adjusted by addition of either 1M hydrochloric acid or 1M sodium hydroxide solution. Isolates were grown separately on a medium containing: 10 g/L of glucose, 20 g/L of starch, Whatman filter paper (cellulose) and WAHT separately as the sole carbon (energy) source. The Whatman paper consisted of 99% cellulose [31]. Growth of bacteria in the soluble substrate was monitored by optical density of the cultures (OD600) using ultraviolet visible spectrometry [14, 32] whereas the OD600 for insoluble substrate (filter paper and WAHT) were determined from the supernatant, after centrifugation at 6000 rpm for 20 min. Further, the TRS was also quantified from clear supernatant to establish if there were any degradation of polysaccharides.
For the development of microbial consortium, three out of the eight isolates (coded OL, BO1 and BO2) which possessed cellulolytic activities were selected for consortium development. Further, the three bacterial isolates were separately grown at 50 °C in broth media containing 10 g/L of untreated WAHT powder. The microbial consortium was developed using two isolates from the three isolates. To obtain a stable consortium, they were repeatedly cultured in the broth medium with WAHT five times with the same condition as that of the individual strains.
2.6. Optimization of bioethanol production from WAHT feedstock
Bioethanol was produced in a 250 mL conical flask with a working volume of 100 mL. The fermentation was carried out using sugar hydrolysate obtained from WAHT and the broth medium. The medium was then sterilized and its pH adjusted to 7. The fermentation experiment was based on partially consolidated bioprocessing using the thermophilic microbial consortium, rather than a single microbe, because it increases the yield of the finished product and more efficiently consumes the substrate [33].
Process parameters for the partially consolidated bioprocessing approach were optimized using central composite design of response surface methodology. The model was built with three factors and three levels to explore their effects and interactions on bioethanol yield. These factors, namely, fermentation temperature (X1), fermentation time (X2) and inoculum dosage (X3), were optimized. Experimental designs were performed using Design–Expert statistical software for Windows (version 13.0.5.0, Stat-Ease Inc., USA). The parameters included temperature (40–60 °C), time (48–96 h) and inoculum ratio (8–12% v/v). A total of 20 experimental runs were conducted. Experimental significance of the obtained model was checked by F-test (calculated P-value) while goodness of fit was assessed using multiple correlations and determination of R2 coefficients. Analysis of Variance (ANOVA) was used to estimate the statistical parameters for maximum bioethanol yield. Statistical significance was considered at P < 0.05.
Growth on the different substrates was determined based on the OD600 using DU 720 General Purpose UV/Vis spectrophotometer. The optimal pH was measured using a digital pH meter. The TRS were determined at 540 nm using 3,5-dinitrocyclic acid (DNS) method with glucose as the standard [34].
Ethanol concentration was determined by back titration with acidified potassium dichromate. When an alcohol vapor makes contact with the orange dichromate, the color changes from orange to green. The degree of colour change is directly related to the level of alcohol in the samples. The ethanol concentration was analyzed via the spectrometric method by dissolving 7 g of K2CrO7 in 5M sulphuric acid at a working volume of 250 mL as described by previous authors [35]. To prepare the dichromate–alcohol reaction, 300 μL of alcoholic samples were mixed with 3 mL of dichromate solution and then incubated at room temperature for 30 min. The absorbance was measured at 590 nm, and the ethanol content was calculated using an ethanol standard curve.
3. Results and discussion
3.1. Pretreatment and FTIR spectra of WAHT feedstock
The effect of pretreating WAHT in boiling water with and without NaClO2 was investigated. Results (Figure 1) show that the amount of TRS increases from the start of the experiment up to 2 h, and does not show any appreciable increase after 3 h, i.e., the maximum TRS yield of 155 mg/g of WAHT is realized at 2 h for the pretreated WAHT biomass. This result is expected since the use of a delignifying agent reduces the amount of cellulase enzyme adsorbed on lignin while simultaneously improving cellulose digestibility [36]. The obtained yield was higher than 88 and 97 mg/g of WAHT feedstock pretreated with formic and acetic acids [37] as well as 22.41 and 99.12 mg/g of WAHT after alkaline and microwave/alkaline combined pretreatments reported by previous authors [19]. Compared to the other pretreatment methods, lower-cost chemicals were used and there was no loss of polysaccharides. In addition, the obtained TRS in the hydrolysate was directly fermented without washing and no inhibitory effects were observed possibly due to very low concentration (10 mg/L) of the acid used during the pretreatment. Thus, a combination of boiling water and low concentration of acidified sodium chlorite solution as a pretreatment condition herein is a promising approach. The mechanism of WAHT treatment involving NaClO2 occurs via its reaction with acetic acid produced during fermentation process, resulting into the production of chlorine dioxide (ClO2) which is a strong delignifying agent [38]. In addition, the sodium ions that are released into the fermentation medium enhance the catalytic activity of hydrogen-producing bacteria [39].
Yield of total reducing sugars from untreated and pretreated WAHT.
FTIR spectroscopy was harnessed to confirm if any changes occurred in the chemical composition and structure of WAHT before and after pretreatment (Figure 2). The spectra obtained suggest that structural changes in WAHT occurred upon pretreatment. For instance, the peak at 895 cm−1 for C–H deformation is associated with β-glycosidic linkages and monosaccharide units in saccharides and cellulose. This confirms that the cleavage of β-glucoside bond (considered a rate-limiting step in lignocellulosic biomass destructuring) occurred following pretreatment [40], giving rise to the peak that was not present in the untreated WAHT.
FTIR spectra of untreated and pretreated WAHT feedstock.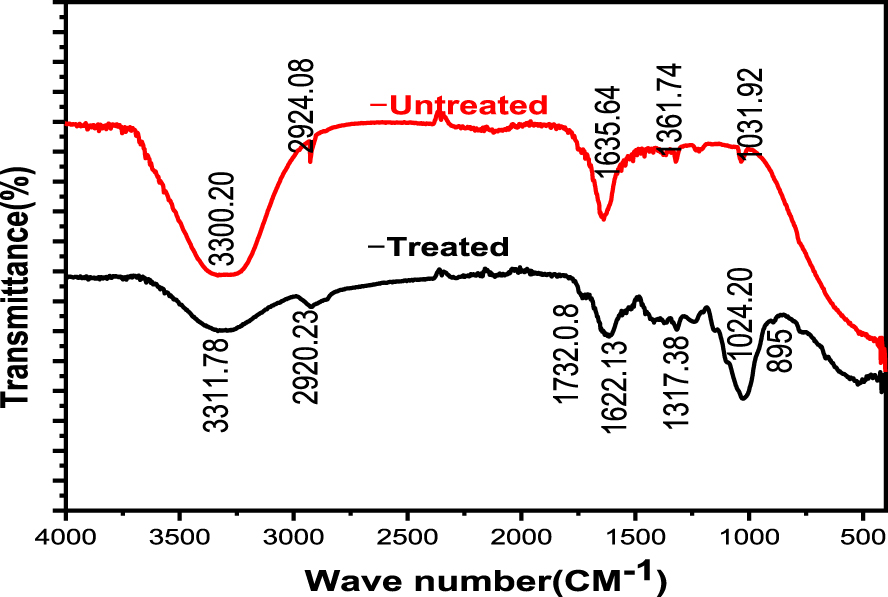
On the other hand, the wavenumbers ranging from 1000 to 500 cm−1 are from cellulose and hemicelluloses [41]. Upon pretreatment, these absorption bands were broadened, particularly for 1024 cm−1. In this range, a slight increase in the number of peaks was also observed, and this results from an increase in the content of cellulose and hemicellulose in the lignocellulose [41]. The FTIR peaks at 1361 cm−1 and 1317 cm−1 are associated with cellulose, while 2900 cm−1 is C–H stretching vibration band of cellulose [42]. The band around 3300 cm−1 corresponds to the stretching vibration and overlapping of O–H, which is recognized as the main infrared sensitive group in lignocelluloses [40]. At the 3300 cm−1 band, both treated and untreated sample had almost the same wavenumber but the pretreated sample had a broader band.
3.2. Characteristics of isolated thermophilic bacteria
A total of eight thermophilic bacterial strains were isolated and coded as BO1, BO2, BOY, BOW, OL, NW, CF and YF. One of these strains (BO2) which was a bioethanol-producing and lignocellulose-degrading thermophilic bacteria isolated at 50 °C is shown in Figure 3.
Bacterial isolate, BO2 (a) on nutrient agar and (b) gram-stained smear under a light microscope.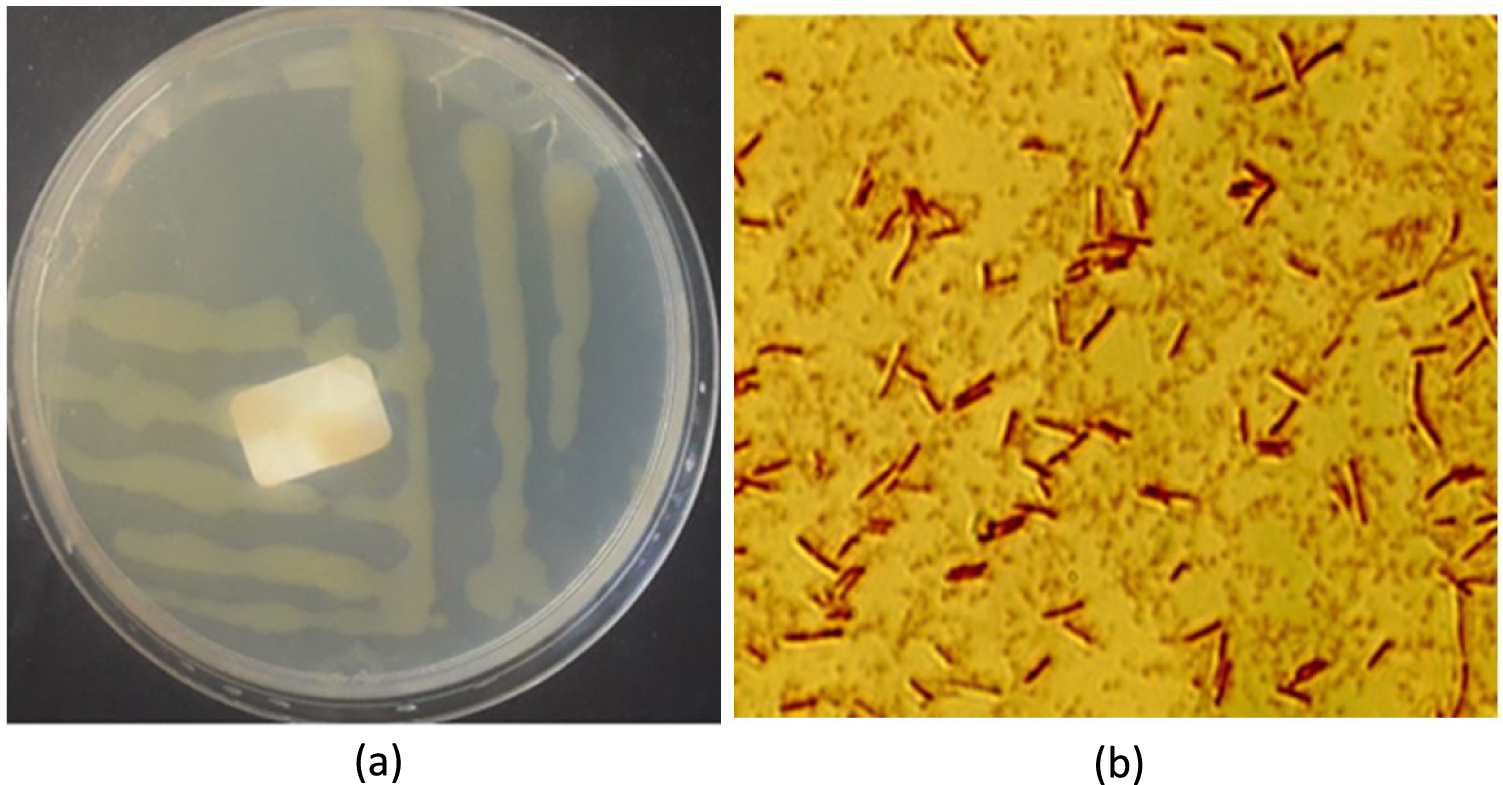
Morphologically, the isolated colonies ranged from white, cream, cream yellow to yellowish in pigmentation. Microscopy revealed that all the isolates from Lake Bogoria were Gram positive, with three rods (BO2, BOY and BOW) and one coccus (BO1). On the other hand, four of the biodigester isolates were Gram negative cocci. Based on Gram staining results, four of the isolates were Bacillus species (one Gram negative and three Gram positive). The remaining five isolates were Gram negative cocci. Bacillus species have straight rod-shaped cells, measuring between 0.5–2.5 × 1.2–10.25 μm and are often clustered [43].
All the isolates from Lake Bogoria resemble the isolates reported previously [44] in terms of color, staining, utilizing most of the carbon sources and a majority of them belong to genus Bacillus. In consonance with the report of Duckworth et al. [45], a majority of soda lakes are mainly associated with bacteria of the Bacillus taxon. Bacillus presence could be due to the genus’ tolerance to harsh environmental circumstances [46].
It is interesting to note that all the isolates were able to grow at 30 °C to 60 °C, though the growth increased between 35 °C and 50 °C in most of the isolates. At room temperature (22 °C), only isolate BOY exhibited some little growth. This indicates that the isolates are heat-loving and can survive from mesophilic to thermophilic conditions. This could be since thermophilic bacteria have different protein structures compared to mesophilic bacteria so that they are able to survive at extreme temperatures [47].
Further, the isolates were subjected to 12 biochemical tests and the results show that they were all amylase-producing thermophilic bacteria. Two (eosin methylene blue and oxidase) tests provided evidence of Enterobacter in the samples. In eosin methylene blue medium, Enterobacter aerogenes grows well and pink in colour without sheen, but Escherichia coli grows with a green metallic sheen [48]. Isolates BO1, BO2, BOW and OL were oxidase-negative. Aerobes and facultative aerobes exhibit oxidase activity whereas Enterobacteriaceae are oxidase-negative [20]. Mannitol Salt Agar (MSA) is a selective differential medium for some gram-positive bacteria (Staphylococcus and Enterococcus) that tolerate high salt concentrations. In this study, only NW was negative for MSA test. Lactose broth was also a differential medium and all the isolates were able to ferment lactose except BOY, whereas BO1 fermented lactose with gas production. Isolates BO1, BOY and BOW were Triple Sugar Iron-negative, BO1 and BO2 were MacConkey-positive, BO1 and BOY were Kligler Iron Agar-positive. Isolates BO1, OL, and SO were catalase-positive, BOY and SO were Simmons’ citrate-positive, and BO2, BOW, YF, and OL were all methyl red-positive.
3.3. Microbial consortium development and substrate utilization property
The ability of the isolated strains to utilize different carbon substrates was tested using broth media supplemented with multiple carbon substrates (glucose, starch, filter paper and untreated and pretreated WAHT) and all of the isolates were positive for glucose, starch and powder WAHT though their substrate utilization rates were different. Further, the ability of a single strain and microbial consortium to produce bioethanol was evaluated. Screening of microorganisms that possess the preferred characteristics is an important prerequisite to eliminate the inclusion of non-essential microbes that do not contribute to the desired product yield [8].
In comparison to the microbial consortium containing two strains, the microbial consortium with three strains shows higher growth and sugar yields from hydrolysis of WAHT (Figure 4). Thus, three isolates (BO1, BO2 and OL) with cellulolytic activity were chosen for microbial consortium development for the purpose of bioethanol production in partially consolidated bioprocessing. Further experiments were conducted using the three bacteria as a microbial consortium and they were cultured multiple times to obtain a stable consortium. The effect of pH on consortium development was studied and it was found that the best pH was 7, with no growth below pH 5. Thus, pH 7 condition was used in all the experiments.
Total reducing sugars obtained from water hyacinth hydrolysed with consortium (BO1 and BO2, as well as BO1, BO2 and OL) with direct supplementation of 8 mg/L NaClO2 (in blue) and 10 mg/L NaClO2 (in red).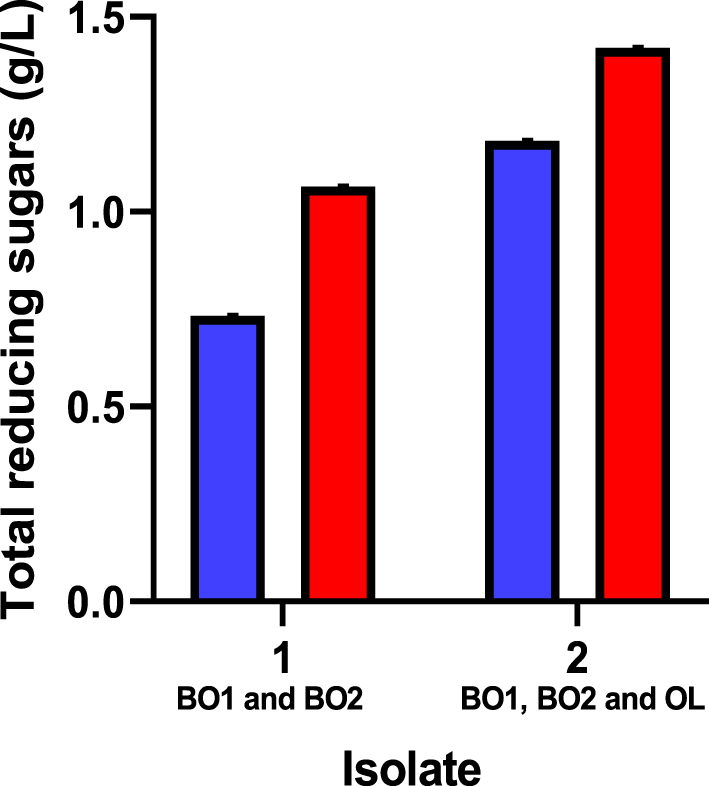
Our results are similar to a previous study [13] which reported that direct supplementation of 8 mg/L NaClO2 increased lignin destruction by about 7.6 times. In fact, our consortium was able to grow in broth media containing 8, 10, and 20 mg/L of NaClO2 but less growth was observed at 20 mg/L. Although higher concentrations of NaClO2 enhanced the amount of TRS produced, there appeared to be a decrease in the number of microbes. Thus, 10 mg/L of NaClO2 was used in the partially consolidated bioprocessing.
3.4. Optimization of bioethanol production
Bioethanol was produced from thermo-chemically pretreated hydrolysate fermented with a locally isolated thermophilic microbial consortium. One of the main reasons for increased interest in using thermophilic bacteria for second generation ethanol is because of their broad substrate spectrum [49]. The production of bioethanol was obtained using central composite design for temperature, time and inoculum dosage. According to the experimental run, the maximum bioethanol concentration was 7.7 g/L, which was achieved at 50 °C and 8% (v/v) inoculum dosage after 72 h of fermentation. Under these conditions, it was expected that it would achieve 7.561 g/L according to the predicted value of the model. On the other hand, according to the model numerical analysis and point prediction, the optimal conditions for maximum ethanol production were: inoculum dosage 8.1% (v/v), temperature 48.8 °C, and time 52.3 h with a predicted bioethanol concentration of 7.192 g/L. The actual yield is closer to response surface methodology yield; this indicates the reliability of the presented model. The actual ethanol concentration obtained and the predicted ethanol concentration for 20 runs are presented in Table 1.
Experimental design matrix prepared using central composite design with the experimental and predicted responses
| Run | Temperature (°C) | Incubating time (h) | Inoculum (%, v/v) | Actual ethanol (g/L) | Predicted ethanol (g/L) |
|---|---|---|---|---|---|
| 1 | 50 | 72 | 10 | 7 | 6.98 |
| 2 | 40 | 96 | 8 | 6.11 | 6.03 |
| 3 | 60 | 48 | 8 | 5.7 | 5.85 |
| 4 | 50 | 72 | 10 | 6.6 | 6.98 |
| 5 | 66.82 | 72 | 10 | 4.3 | 4.05 |
| 6 | 50 | 72 | 6.64 | 7.7 | 7.56 |
| 7 | 50 | 72 | 10 | 7.1 | 6.98 |
| 8 | 50 | 72 | 10 | 6.9 | 6.98 |
| 9 | 50 | 72 | 13.36 | 6.33 | 6.44 |
| 10 | 60 | 96 | 12 | 5.3 | 5.32 |
| 11 | 60 | 48 | 12 | 5.8 | 5.89 |
| 12 | 40 | 48 | 8 | 6.23 | 6.23 |
| 13 | 33.18 | 72 | 10 | 3.6 | 3.82 |
| 14 | 40 | 48 | 12 | 5.7 | 5.55 |
| 15 | 50 | 72 | 10 | 7.3 | 6.98 |
| 16 | 50 | 112.36 | 10 | 6 | 6.03 |
| 17 | 60 | 96 | 8 | 5.8 | 5.97 |
| 18 | 50 | 31.64 | 10 | 6.73 | 6.68 |
| 19 | 50 | 72 | 10 | 6.96 | 6.98 |
| 20 | 40 | 96 | 12 | 4.8 | 4.66 |
Our optimum bioethanol concentration is higher than concentrations reported for some of the wild-type strains of thermophilic cellulolytic bacterium C. thermocellum, an extensively researched candidate for thermophilic consolidated bioprocessing: strain ATCC 27405 in fermenter (4 g/L of ethanol obtained) [49], Thermoanaerobacter J1 from hydrolysates obtained from different lignocellulosic biomass with the highest ethanol concentration 1.56 g/L [50], Bacillus paranthracis and Bacillus nitratireducens microbial consortia with the highest bioethanol concentration of 0.39 g/L from 7.5 g/L of substrate [8].
On the other hand, Sato et al. [51] reported a higher ethanol concentration of 23.1 g/L under optimized medium after 168 h of fermentation with Clostridium thermocellum wild-type strain I-1-B from cellulolytic biomass. These differences in yields with previous studies could be attributable to the type of biomass, the effectiveness of the microbial consortium, the type of strain used in the consortium development, and most importantly, the fermentation techniques used and other factors influencing fermentation.
3.5. Mathematical modelling and significant test of bioethanol yield
To assess the effect of different reaction parameters on bioethanol production, quadratic models were selected based on the suggested model, lack-of-fit test and model summary statistics (Table 2). The actual concentrations of bioethanol obtained varied from 3.6 to 7.7 g/L. ANOVA indicated a model F-value of 42.02, which implies that the model is significant. Values of “Prob > F” less than 0.05 indicate that the factors B, C, AC, A2 and B2 are significant terms in the model that affect the production of bioethanol (Equation 1). The Lack-of-fit F-value of 0.94 implies the lack of fit is not significant relative to the pure error. There is a 52.5% chance that a “Lack-of-fit F-value” this large could occur due to noise. The model-predicted R2 of 0.8856 is close to the adjusted R2 of 0.9511 and the model’s adequate precision of 23.1632 indicates that the model can be used to navigate the design space. High R2 value (0.9742) shows that the model described 97.42% of the variation in the response variable, leaving only 2.58% to the residuals. It was shown that the regression model was highly significant (P < 0.05).
| (1) |
Analysis of variance and the quadratic model for total bioethanol production
| Source | Sum of squares | df | Mean square | F-value | P-value (Prob > F) |
|---|---|---|---|---|---|
| Model | 19.72 | 9 | 2.19 | 42.02 | <0.0001 |
| A-temp | 0.0643 | 1 | 0.0643 | 1.23 | <0.2926 |
| B-time | 0.5133 | 1 | 0.5133 | 9.85 | <0.0105 |
| C-inoculum | 1.51 | 1 | 1.51 | 29.00 | <0.0003 |
| AB | 0.0480 | 1 | 0.0480 | 0.9218 | <0.3597 |
| AC | 0.2592 | 1 | 0.2592 | 4.97 | <0.0499 |
| BC | 0.2381 | 1 | 0.2381 | 4.57 | <0.0583 |
| A2 | 16.66 | 1 | 16.66 | 319.58 | <0.0001 |
| B2 | 0.7062 | 1 | 0.7062 | 13.55 | <0.0042 |
| C2 | 0.0010 | 1 | 0.0010 | 0.0198 | <0.8910 |
| Residual | 0.5213 | 10 | 0.0521 | - | - |
| Lack of fit | 0.2530 | 5 | 0.0506 | 0.9427 | <0.5250 |
| Pure error | 0.2683 | 5 | 0.0537 | - | - |
| Cor total | 20.24 | 19 |
Figure 5 shows a three-dimensional (3D) response surface graphical diagram depicting the effect of temperature, inoculum dosage, time and their mutual interactions on bioethanol production. Figure 6 is a counter plot representing the interactive effects of the optimal conditions. According to the obtained results, Equation (1) represents the effect of the different factors and interacting factors on bioethanol concentration (in terms of the coded factors).
Response surface plots showing the effect of (a) temperature, (b) inoculum dosage, and (c) time, and their mutual interactions on production of bioethanol in 3D.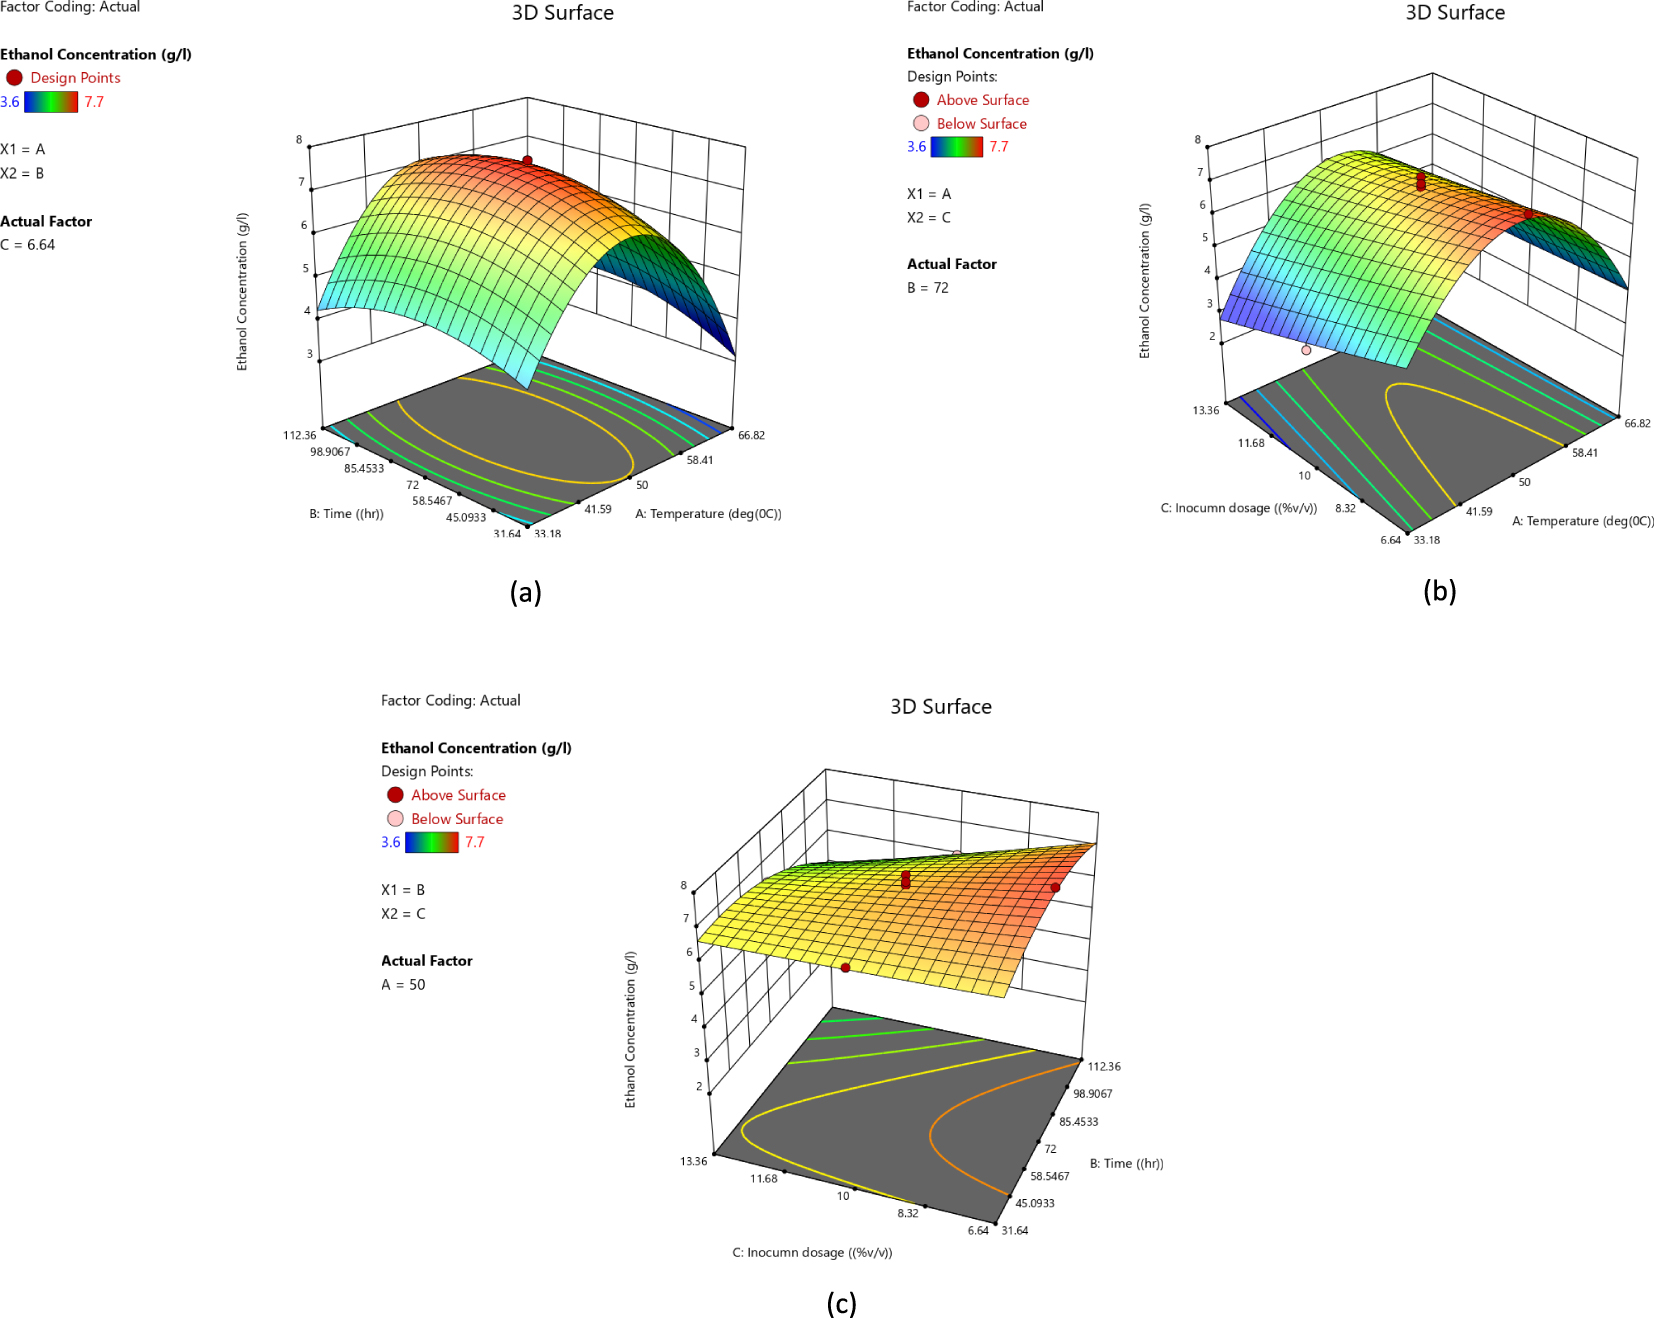
Response of bioethanol production to fermentation time, inoculum dosage and fermentation temperature in 2D.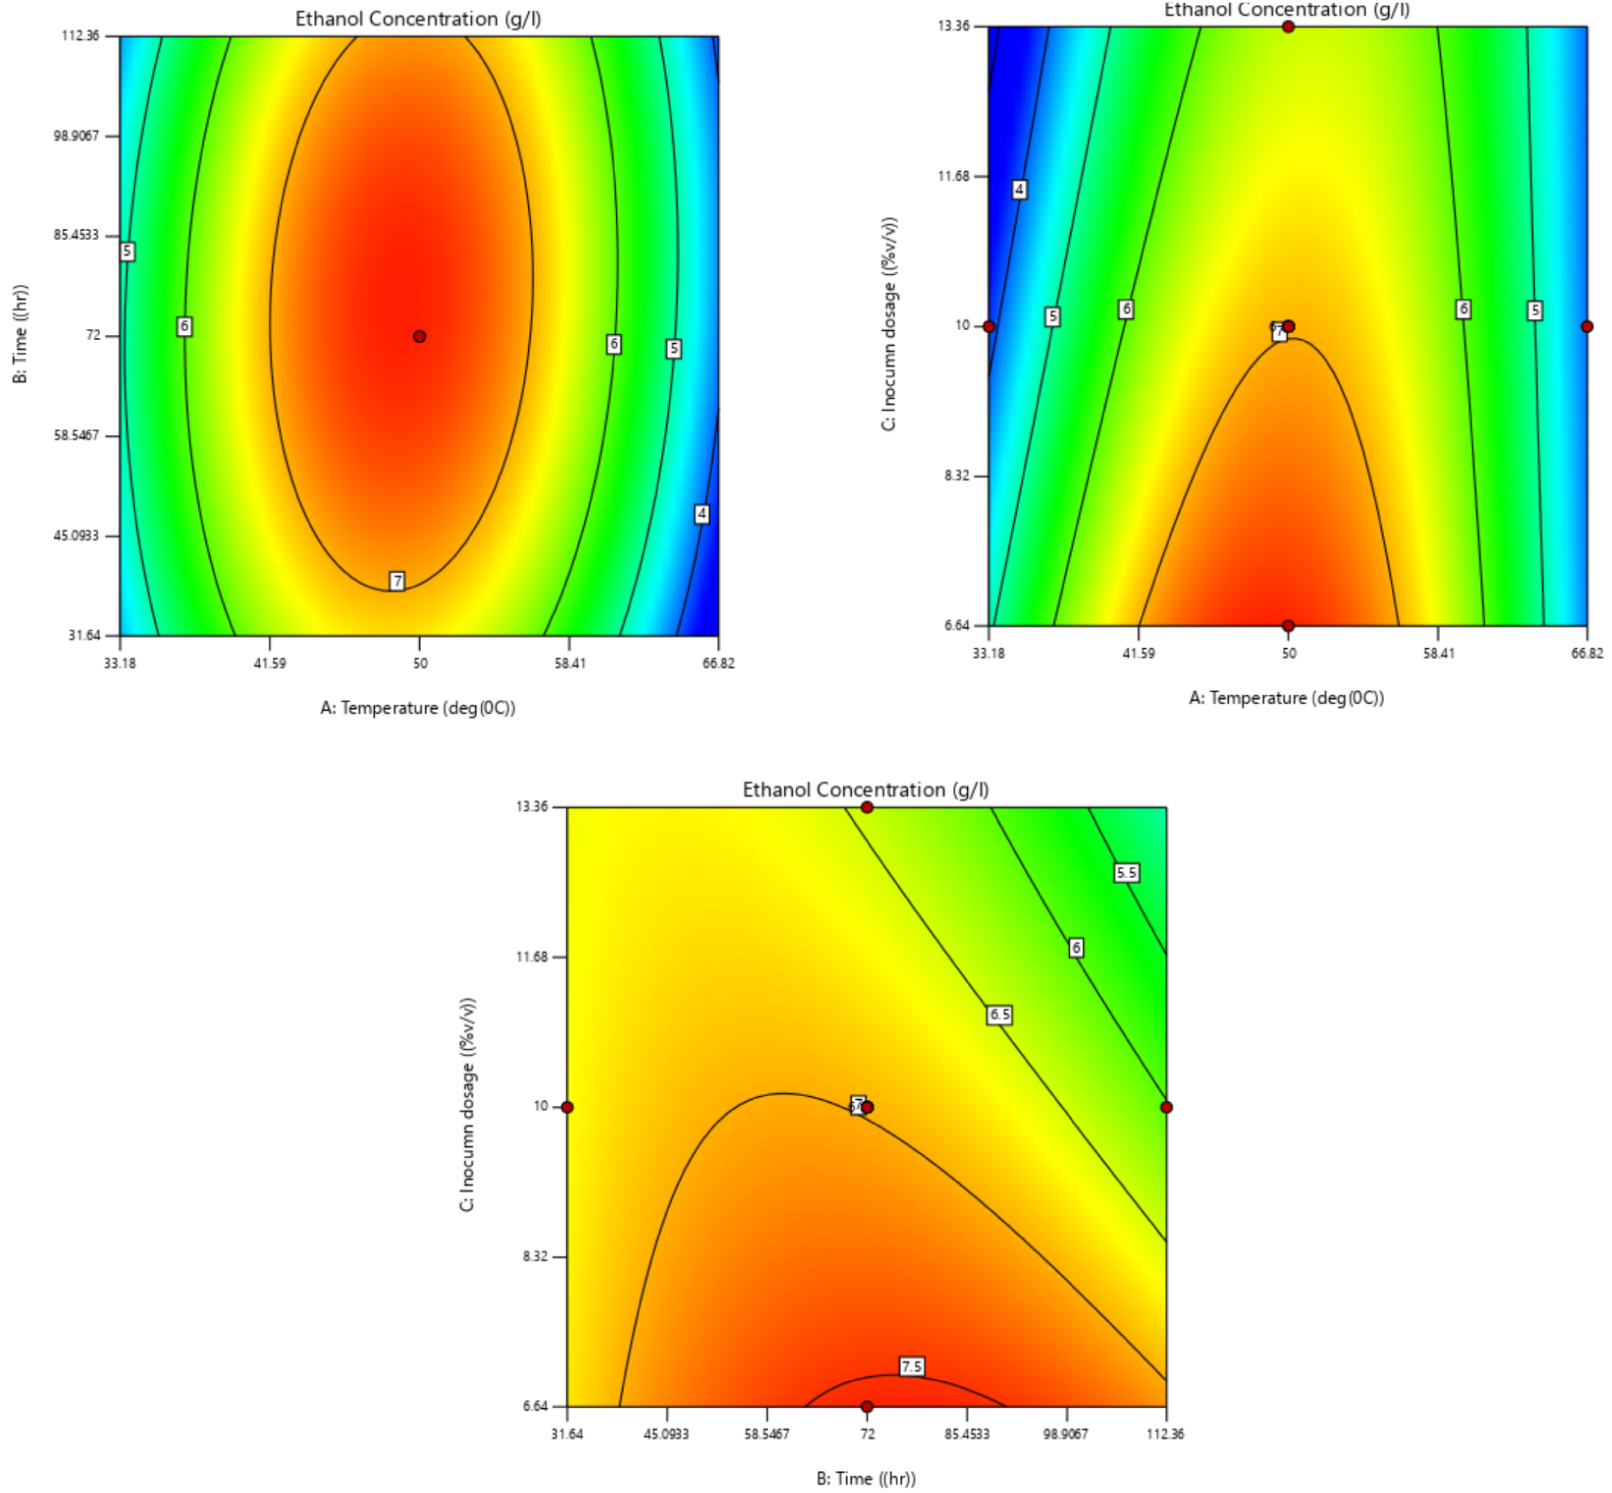
3.6. Effect of mono-culture and co-culture fermentation
Both the single strain and the microbial consortia were examined separately for ethanol production from glucose. The microbial consortium has obtained the highest ethanol concentration of 9.01 g/L, which is 88.3% of the theoretical yield. The highest concentration from a single strain was 3.22 g/L which was obtained during fermentation with strain BO1. Microbial consortium produced 2.8 to 4 times the amount of bioethanol produced by a single strain from glucose (Figure 7). A previous study [50] which constructed dual Caldicellulosiruptor and Thermoanaerobacter co-cultures revealed up to 8-fold increased ethanol yields compared to the monocultures of Caldicellulosiruptor strains and Thermoanaerobactor. But the ethanol produced from WAHT was lower as compared to ethanol from glucose. This behavior is because glucose can easily be utilized by microbes, whereas WAHT contains a lignocellulose component which is not easily degraded by microbes. Ethanol production by co-cultures was strongly dependent on the composition of the substrate [50].
Ethanol production from glucose fermentation with single strain and microbial consortium.
4. Conclusions
The obtained results suggest that WAHT pretreated with boiling water/NaClO2 enhanced the yields of TRS (155 mg/g of WAHT). This relatively high amount of TRS is a promising outcome as it is less costly and the hydrolysate is directly fermented to bioethanol without washing. The resulting hydrolysate was fermented to bioethanol by a locally isolated thermophilic microbial consortium in a partially consolidated bioprocessing process, which reduced the cost of enzyme synthesis as well as the risk of contamination. A maximum experimental bioethanol yield of 7.7 g/L was obtained at 50 °C, 72 h of fermentation and 6.64% (v/v) inoculum dose. This fact suggests that WAHT has a promising potential to be embraced for more enhanced bioethanol production.
Declaration of interests
The authors do not work for, advise, own shares in, or receive funds from any organization that could benefit from this article, and have declared no affiliations other than their research organizations.
Funding
This research was funded by the Africa Centre of Excellence II in Phytochemicals, Textile and Renewable Energy (ACE II PTRE), Moi University, Kenya (Credit No. 5798-KE).