


 CC-BY 4.0
1. Introduction
Dealing with excess sludge in a way that is both economically and ecologically responsible is a growing concern. Hydrothermal carbonization (HTC) is a thermochemical conversion technology that can convert biomass into a combination of carbon materials and liquid phase products under autogenous pressure with water as the reaction medium [1]. Unlike conventional pyrolysis processes [2, 3], its reaction conditions are mild and there is no need for pre-drying biomass waste, leading to considerable energy conservation [4]. Additionally, HTC can dramatically decrease the amount of sewage sludge (SS), improve the dewatering capability of sludge considerably, and convert it into high-value products (hydrochars) in the field of fuels [5, 6], agricultural applications [7, 8, 9], and adsorbents [10, 11]. Consequently, hydrochars have a promising future as a fuel source, in agricultural applications, and for water resource restoration.
Altering sludge characteristics (major component and water content) or HTC parameters (HTC temperature and residence time) will generate diverse physicochemical characteristics of hydrochars, thus affecting their potential applications. Previous research revealed that the ash content of sludge-derived hydrochars from different production areas was significantly dissimilar [12, 13]. The greater the solid content of sludge, the more pronounced the output of hydrochars [14, 15]. HTC processing requires much energy for macromolecular organic matter destruction; thus, the HTC temperature is the primary factor of HTC processing and restrictive factors [16]. Moreover, the residence time is a critical factor in the HTC process, impacting product distribution, chemical properties, and deepening carbonization degree [17, 18]. For industrial purposes, HTC must be conducted with a shorter period of residence to optimize efficiency and reduce costs. Consequently, moisture content, HTC temperature, and residence time all influence the HTC process of sludge, and the characteristics of hydrochars vary accordingly. Most studies have focused on individual or dual parameters and their effects on hydrochar properties. Furthermore, the relationship between these parameters and hydrochars has not been fully explored. To provide a data basis for engineering applications, this work studied the HTC process of sludge by regulating solid content, HTC temperature, and residence time.
HTC has been demonstrated to turn sludge into solid fuels with greater energy density, providing a feasible alternative to combustible fuels while avoiding contamination of the environment. Previous studies indicated that the higher heating value (HHV) and atomic ratios of hydrochars were comparable to lignite [5, 19]. Hydrochar production relies on the ash content of the raw material, and the sludge types have varying ash content. Conversely, hydrochars have abundant nutrients that are helpful for plant growth, such as N, P, and K, and their fertilizer and soil amendment utilization has drawn attention [7, 20, 21]. Hydrochars can be employed as soil conditioners to release nutrient components, which is beneficial for long-term utilization. Due to the presence of certain heavy metals in the sludge feedstock, before applying hydrochars to the soil, it is essential to consider both the regulations regarding heavy metals in soil and the impact of the heavy metal content of hydrochars on soil characteristics [22, 23]. However, most of these works only investigate the sole application of resources in hydrochars without comprehensive evaluation.
In this study, HTC treatment of sludge was conducted by controlling solid content, hydrothermal temperature, and residence time. The properties of hydrochars generated under various conditions were fully compared and analyzed to optimize operational parameters and evaluate the energy recovery efficiency of hydrochars with different hydrothermal strengths. In addition, heavy metal content in hydrochars under different HTC conditions was studied to assess its potential for land use. Few consider hydrochar applications in fuel and land use, with comprehensive consideration given to solid content, hydrothermal temperature, residence time, and heavy metal content to create a data basis for engineering applications.
2. Materials and methods
2.1. Materials
Activated sludge (AS) and dewatered sludge (DS) in this study were collected from the secondary sedimentation tank and mechanical dewatering workshop of a wastewater treatment plant (Nanjing, China). The sludge was dispensed in sealed bags, refrigerated at 4 °C, and used in the HTC process. For the characterization of the samples, AS and DS were further dried in an oven at 105 °C for 12 h, ground to a fine powder, and sealed in a dry glass vial. The basic properties of sludge are listed in Table S1.
2.2. HTC process
The HTC system was implemented by deploying a non-stirred 100 mL stainless steel Teflon-lined reactor. For each experiment, 60 mL of AS (wet volume) or 6 g of DS (dry weight) with a 1:10 solid-to-liquid ratio was loaded into the reactor, and the reactor was then securely closed and placed in the oven. The HTC reaction was maintained for 1, 2, 3, and 4 h at the set temperature of 180, 220, and 260 °C. When the HTC procedure was finalized, the reactor was taken out of the oven and cooled to room temperature. The treated slurry was settled and separated by a 0.45 μm filter membrane. The solid phase of hydrochar was dried, pulverized, and labeled AS/DS-HC-180/220/260-1/2/3/4 for each sample before being analyzed. The AS/DS specified the type of sludge, 180/220/260 indicated the temperature, and 1/2/3/4 represented the retention period in hours.
2.3. Analytical method
The elemental content (C, H, N, S) and ash content of hydrochars were determined by an elemental analyzer (vario EL cube, Elementar, Germany) and the combustion method. Based on the above data, the O content was determined by calculating the difference. The bulk atomic ratios of oxygen/carbon (O/C) and hydrogen/oxygen (H/C) were further calculated to estimate the coalification process of HTC based on the van Krevelen diagram [24]. The hydrochar yield was calculated as in Equation (1). A thermogravimetric (TG; TG 5500, TA Instruments, United States) analysis of hydrochars was conducted in the air atmosphere at a heating rate of 10 °C⋅min−1 from 50 to 800 °C. The recalcitrance index R50 of hydrochars based on TG data was calculated as in Equation (2). The heavy metal content of hydrochars was determined by an inductively coupled plasma mass spectrometer (ICP-OES, PerkinElmer, United States) after being digested according to our previous method [25].
| (1) |
| (2) |
2.4. Data collection and category
An extensive literature search was conducted in the Web of Science using keywords such as “sewage sludge” and “hydrothermal carbonization”. A total of 826 related articles were retrieved. The included literature was further screened to meet the following criteria: (1) the research was about sludge HTC and without any auxiliary condition; (2) the HTC temperature ranged from 140 to 380 °C and the corresponding retention time was from 20 to 1440 min; here, it should be noted that the retention time is influenced by hydrothermal temperature as previous research has highlighted the more pronounced impact of temperature on HTC compared to retention time [27]; (3) the reactor volume utilized for data collection varied between 100 mL and 1 L; and (4) the original data of hydrothermal intensity and physicochemical properties of hydrochars were measured. The information pertaining to (1), (2), (3), (4) could be found in the manuscript or supporting information of the screened articles. Hydrothermal intensity, a function of hydrothermal temperature (T, °C) and retention time (𝜏, min), was recommended as a valuable parameter for interpreting results from hydrochar production performed at different temperatures and reaction times. It was calculated using Equations (3) and (4) [27, 28, 29, 30]. From the 10 selected research articles, the highest frequency of hydrothermal intensity (lnR0) is in the range of 12–14.
| (3) |
| (4) |
3. Results and discussion
3.1. HTC operation and hydrochar yields
To ensure the successful implementation of HTC technology, as shown in Figure S1, efficient carbonization and the possibility of prolonged production are necessary. According to our data, if the hydrothermal intensity is insufficient, the raw material cannot be completely carbonized, leading to difficulties in solid–liquid separation (data not shown). The study of He et al. reported that the solid–liquid separation was similarly difficult after sewage treatment with HTC at 200 and 220 °C [31]. Therefore, adjusting the appropriate hydrothermal intensity for continuous production is essential to ensure complete carbonization and efficient solid–liquid separation.
The product yield is one of the critical factors that determine the feasibility of HTC technology application. When the retention time was 1 h, the product yields of activated sludge hydrochars (AS-HCs) were 65.2%, 55.1%, and 53.6% at 180, 220, and 260 °C, respectively (Figure 1a). Meanwhile, when the retention time was 3 h, the product yields of dewatered sludge hydrochars (DS-HCs) were 66.6%, 61.7%, and 49.8% at 180, 220, and 260 °C, respectively (Figure 1a). In addition, He et al. discovered that the product yields of hydrochars declined from 66.6% to 43.1% when the temperature rose from 200 to 380 °C (lnR0 = 9.78) [31]. In contrast, the product yields of hydrochars decreased as the complete carbonization process progressed at a specific temperature with increased retention time. For example, the product yields of DS-HCs were 68.5%, 65.0%, and 56.1%, respectively, when the retention time was 1, 2, and 4 h at 220 °C. Under these same conditions, the product yields of hydrochars were reported as 71.9%, 68.5%, and 64.9%, respectively, by Ovsyannikova et al. [32]. The same trend was also reported by Malhotra et al. [24] and He et al. [13]. It was noticeable that the hydrochar yields became closer with increasing R0 for the two kinds of sludge and ranged from 52% to 56% at 220 °C (lnR0 = 12.23–13.62) (Figure 1a). The results of He et al. showed that the hydrochar yield remained at about 60% when the retention time was long enough (⩾6 h) at 200 °C (lnR0 ⩾ 12.67) [13]. It can be concluded that the R0 going up by the elevation of reaction temperature or lengthening reaction time can generate an equivalent yield of hydrochars, demonstrating that the hydrothermal intensity can direct the decomposition extent of organics in sludge during HTC.
Effects of hydrothermal intensity (lnR0) on hydrochars’ (a) yields; (b) ash content; (c) C content; (d) H content; (e) O content; (f) N content; (g) correlation analysis. AS-HCs represent the activated sludge hydrochars and DS-HCs represent the dewatered sludge hydrochars.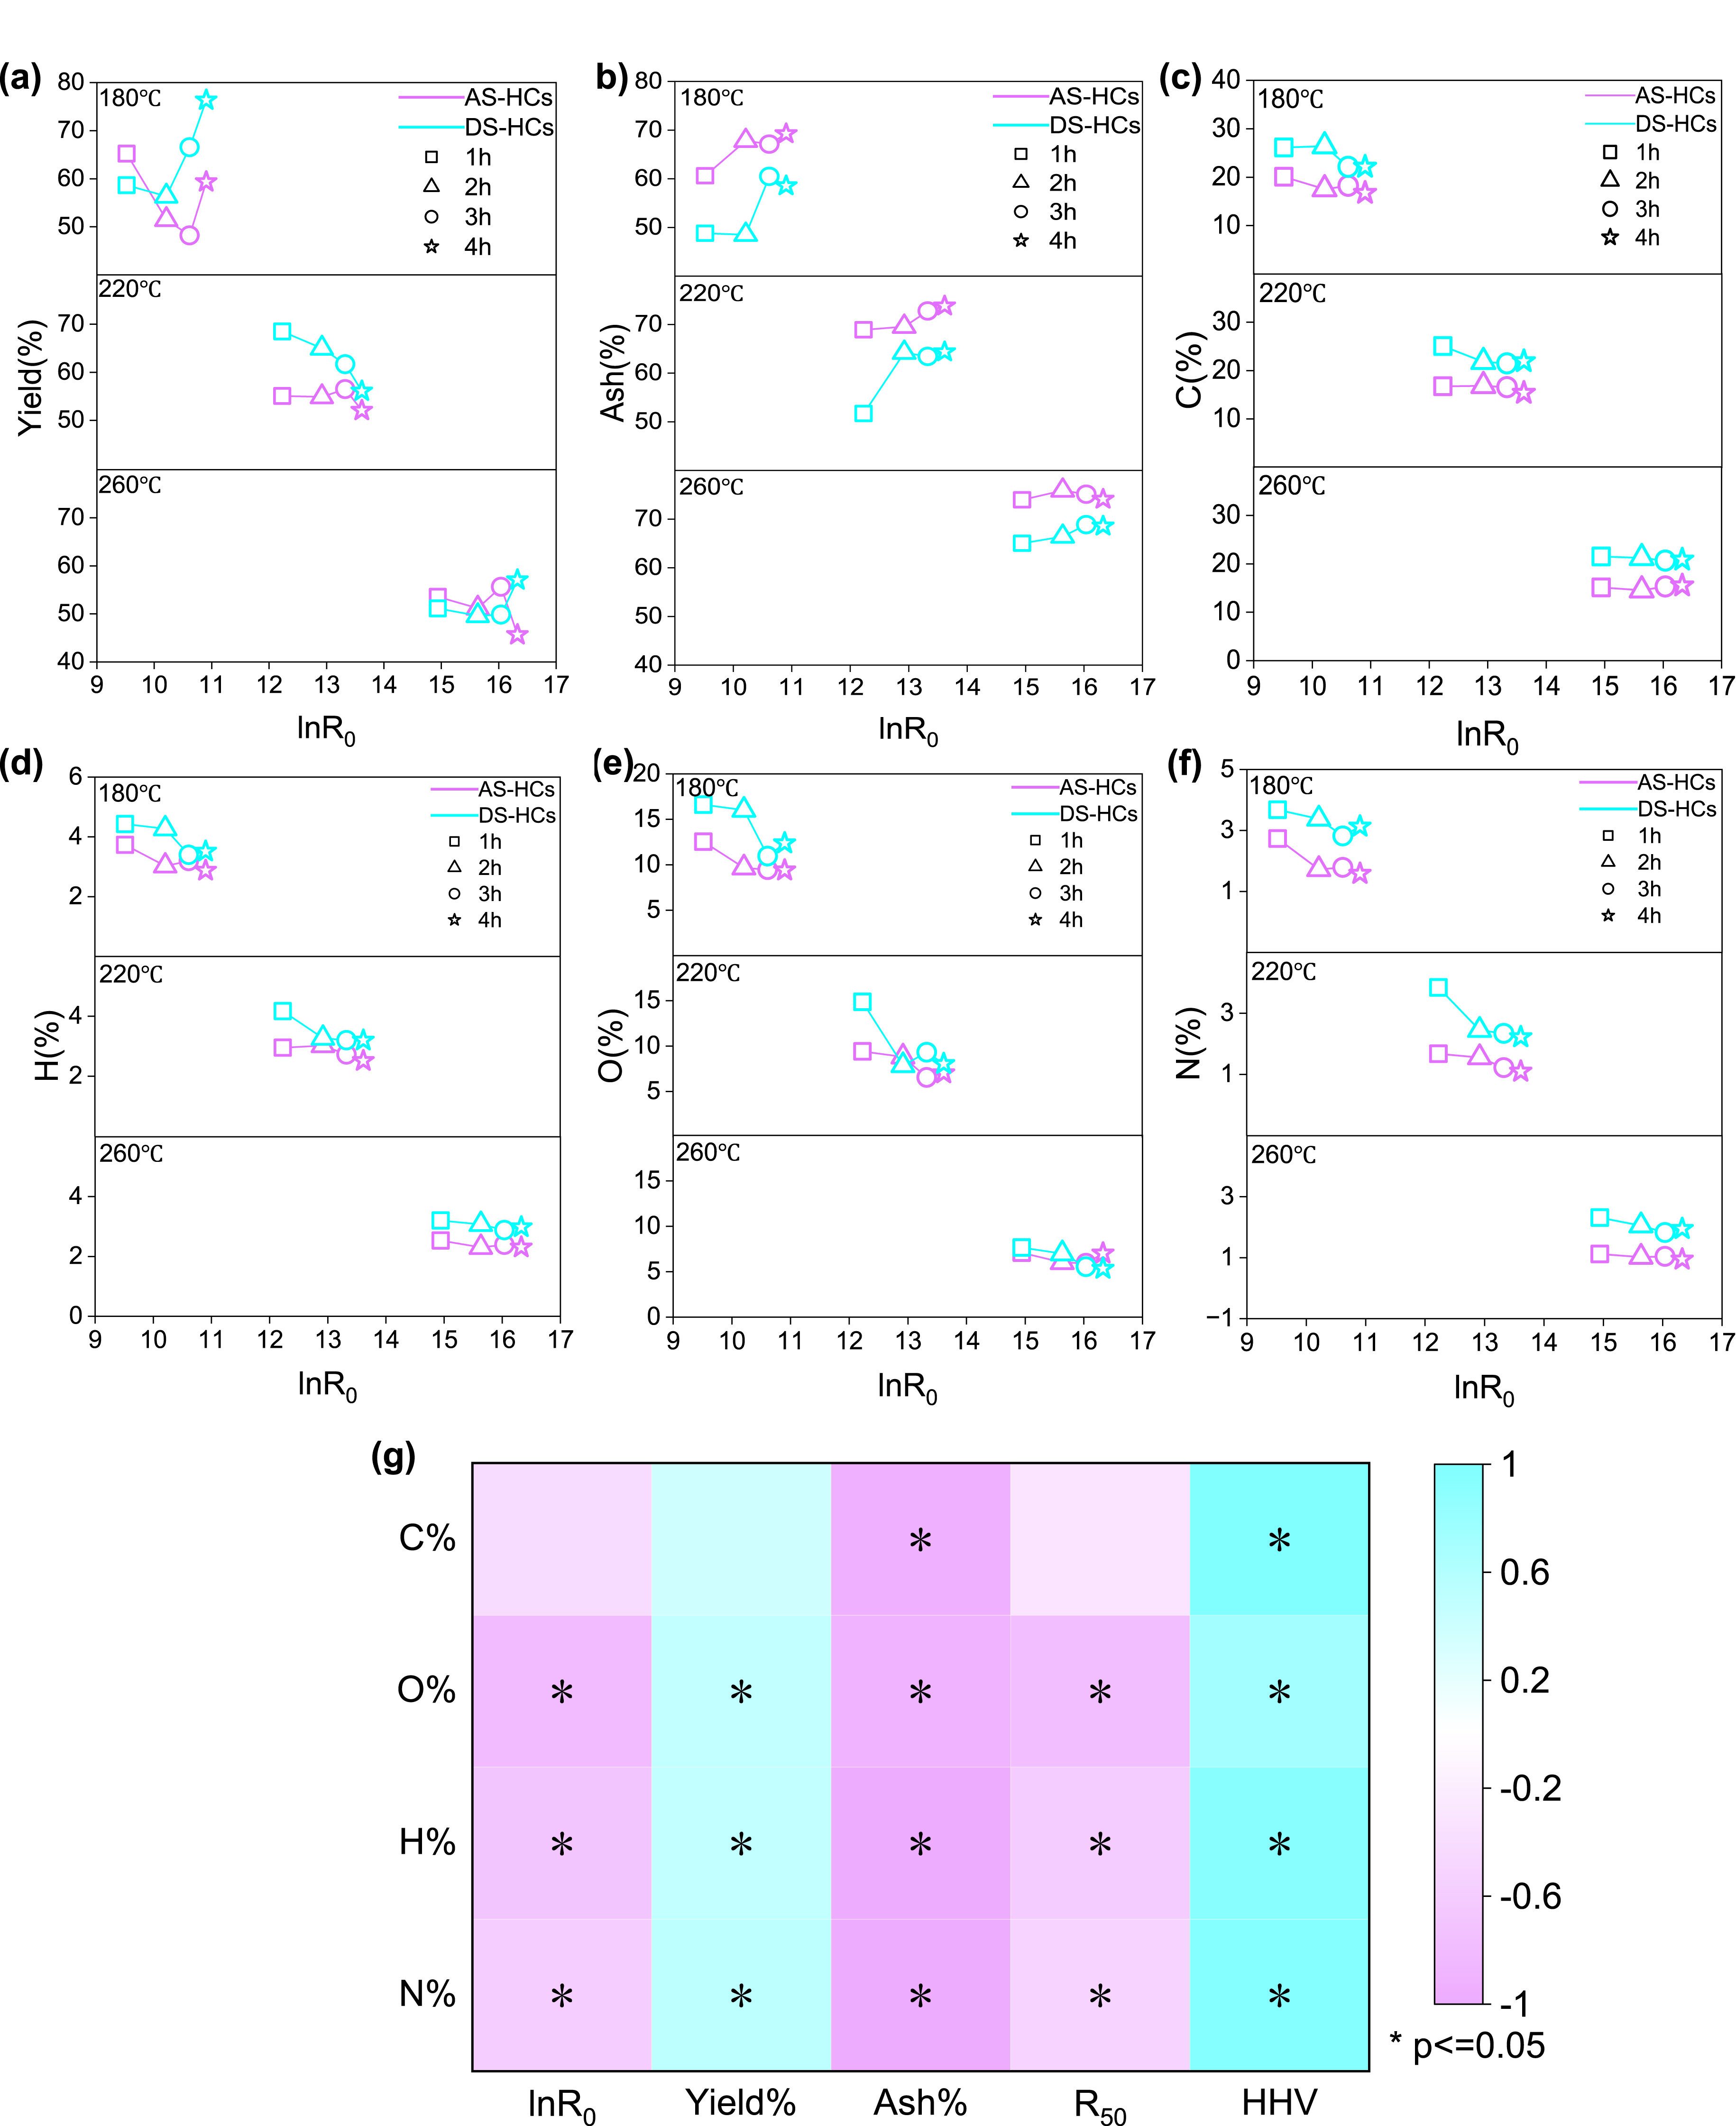
As the hydrothermal intensity is heightened, the yield of hydrochars diminishes and the hydrochars are more carbonized (Figure 2a). Moreover, it can be seen in Figure 2a that the hydrochar yields fluctuated in the range of 35.0–80.0% due to the group data coming from different solid loading and hydrothermal intensity [15]. The study by Aragón-Briceño et al. found that hydrochar yields increased from 67.9% at 2.5 wt% loading to 75.6% at 25.0% wt% loading for sewage digestate at 250 °C, 30 min (lnR0 = 13.57) [15]. In this study, AS with the moisture of 98.4% resulted in a lower AS-HC yield (52.1%) than the yield (56.1%) of DS with a moisture of 80.3% at 220 °C, 240 min (lnR0 = 13.62). Under this condition, the hydrochar yield decreased from 71.7% to 64.9% when the DS-HC/water (w/w) ratio changed from 0.2 to 0.1 [32]. Higher moisture levels would enable the hydrolysis of organic matter and the decarboxylation reactions [31, 33]. Simultaneously, it would be hard to polymerize the small molecules that had decomposed into the aqueous phase into hydrochars because of the low concentration [34]. Therefore, the solid loading in the HTC reactor should be a factor when selecting the parameters.
Investigation on hydrochars’ (a) yields; (b) ash content; (c) C content; (d) H content; (e) O content; (f) N content. A: lnR0 ⩽ 10.99; B: 11.00 ⩽ lnR0 ⩽ 12.49; C: 12.50 ⩽ lnR0 ⩽ 13.49; D: 13.50 ⩽ lnR0 ⩽ 14.99; E: 15.00 ⩽ lnR0 ⩽ 16.99; F: lnR0 ⩾ 17.00. AS-HCs (pink circles) represent the activated sludge hydrochars, DS-HCs (blue circles) represent the dewatered sludge hydrochars, and the data in the literature (yellow circles) represent the hydrochars reported in the published literature.
3.2. Elemental composition of hydrochars
3.2.1. Content of ash in hydrochars
The raw sludge had higher ash content (AS 46.88 wt% and DS 48.19 wt%) than all AS-HCs or DS-HCs. AS-HCs had an ash content of between 60.59 and 75.89 wt%, while the ash content of DS-HCs was between 48.81 and 68.84 wt% in Figure 1b. During the HTC process, the organic matter was partially broken down and dissolved into the aqueous phase, increasing the inert ash component in hydrochars [13]. As the hydrothermal intensity rises, the ash content increases as organic materials are lost in the raw material and minerals present in hydrochars, which is demonstrated in Figure 1b. It is possible that the increased ash content in AS-HCs is a consequence of the accelerated hydrolysis of organic matter and an amplified decarboxylation reaction for treated AS [35]. As depicted in Figure 1b, at relatively low hydrothermal temperatures (e.g., 180 and 220 °C), the ash content in both AS-HCs and DS-HCs is augmented with increased retention time. When hydrothermal intensity/lnR0 exceeded 12.92 (220 °C and 120 min), the changes in ash content of DS-HCs were no longer noticeable, which was in agreement with the data collected by Ekpo et al. [36].
The ash content in hydrochars changed drastically at a specific hydrothermal intensity based on the literature data, as seen in Figure 2b. This is probably due to the significant disparity in the organic matter between various types and regions of sludge [37]. As an illustration, the ash content of dewatered anaerobically digested SS from Singapore was just 21.8%, and the ash content of hydrochars (prepared at 200–380 °C and 20 min) varied from 32.8 to 43.2% [31]. For the dewatered SS with 52.0% ash content located in Guangzhou, China, the hydrochars (at 220 °C and 12 h) achieved 71.8% ash content [38]. Comparable to this, the dewatered SS from Changsha, China, with 49.9% of ash content, yielded a 70.6% ash content in hydrochars after 300 °C and 60 min [39].
3.2.2. Content of C in hydrochars
The C content in hydrochars decreased in comparison to raw materials due to the change of organic carbon-containing compounds (e.g., carbohydrates and lipids) into gaseous products and hydrolysate during the HTC process [38]. Comparatively, the drop of C content in AS-HCs was more marked than in DS-HCs, as Figure 1c shows. The C content in AS was 26.8%, but in hydrochars, it dropped to 20.1–14.6% and kept shrinking as the hydrothermal intensity increased. Nonetheless, the disparity became imperceptible when hydrothermal intensity/lnR0 surpassed 10.2. The C content in DS was 25.4%, whereas the C content in DS-HCs varied between 26.4 and 21.1%. At 180 °C, the C content experienced a slight rise in 2 h and then a notable decrease after 3 h. When the HTC temperature is 220 °C, a significant reduction can be noticed after 2 h. Under vigorous hydrothermal intensity, the final C content in DS-HCs remained at approximately 21%. There was a discrepancy in the literature concerning the impacts of solid loading on the C content in hydrochars. A rise in moisture content from 85 to 95% caused the C content in hydrochars to drop from 42.8 to 37.0% at 380 °C and 20 min [31], in accordance with our result that the C content in AS-HCs was lower than DS-HCs. In the case of sewage digestate (United Kingdom), when the solid loading was 2.5–30% (w/w) at 250 °C for 30 min [15], the C content was kept within 32–34%.
The C content in our experiments was moderate in the collected data (Figure 2c), varying from 11.4 to 44.6%. The C content in hydrochars showed a pattern similar to ash content variation, responding to the type and region of sludge. The C content in hydrochars produced from the dewatered SS in Singapore was approximately 32.8% [13], comparable to the value (33%) in hydrochars from mixed centrifuged sewage sludge from India [24]. The C contents of hydrochars derived from SS in Shanghai [40], Beijing [18], and Dalian [41] in China were high, surpassing 36%. At the same time, Changsha [39], Nanjing [12], and Guangzhou [38] had much lower C content of 22–23%, 16.8%, and 16.5%, respectively. Our experiment and collected data revealed that the C content remained constant when hydrothermal intensity reached a certain degree for the same sludge. As an illustration, hydrochars maintained a C content of 44%, and the HTC temperature had no notable effect when held at 260–340 °C and 20 min for the dewatered anaerobically digested SS (Singapore) [31]. Studies have shown that the primary organic materials present in sludge, such as proteins and polysaccharides, can be broken down significantly even at temperatures below 180 °C [42, 43, 44]. The study by Wang et al. [12] reported that 42% of the volatile matter was degraded at 250 °C and 300 min (lnR0 = 15.9), and due to the interaction of the organic components in the sludge, char formation was affected [12]. Differences in the content and form of organic material in different kinds and areas of sludge could result in distinct behaviors during the HTC process.
3.2.3. Content of H in hydrochars
As the temperature increased, the dehydrogenation response became more intense [31]; thus, the H content in hydrochars was lower than in the raw materials. The H content in AS was 4.43%, but in hydrochars, it dropped to 2.30–3.73%, as shown in Figure 1d. The H content in DS-HCs was in the range of 3.07 to 4.4%, which was slightly lower than in DS. The H content in DS-HC-260 was less than that in DS-HC-180 and DS-HC-220 when held at a specific retention time. As determined by Peng et al., the H content in DS-HCs decreased from 3.3 to 2.3% when the temperature rose from 200 to 300 °C in 60 min [39]. With the hydrothermal temperatures set at 180 and 220 °C, the H content decreased as the retention time increased. However, when the temperature rose to 260 °C, the H content fell steadily with the hydrothermal intensity. Similarly, Zhang et al. observed that the H content decreased from 5.1 to 4.9% when the duration was prolonged from 60 to 720 min at 190 °C, whereas at 260 °C, the H content stayed steady at approximately 5% [18].
The H content of this study was of a medium level, which is in accordance with the data found in the literature (Figure 2d). It has been observed that the H content of sludge can be greater than 5%, such as dewatered anaerobically digested SS (Singapore) [31], dewatered SS (Changsha, China) [40] and municipal sludge (Beijing, China) [18]. However, the H content can be less than 2%, such as in SS (Guangdong, China) [45]. There was no noticeable change in the H content of hydrochars when solid loadings were taken into consideration for sludge of the same type [15, 31].
3.2.4. Content of O in hydrochars
As a consequence of the decarboxylation and dehydrogenation reaction, the oxygen content of hydrochars was significantly diminished from that of the raw material, ranging from 16.81% in AS to 12.53–5.93% in AS-HCs and from 17.28% in DS to 16.61–5.33% in DS-HCs. It decreased with increase in hydrothermal intensity as shown in Figure 1e. By increasing the hydrothermal time at low HTC temperatures, the oxygen content in hydrochars is reduced. As an illustration, the oxygen content in DS-HCs decreased from 14.86 to 8.04% when the retention time was increased from 60 to 240 min at 220 °C. It was also found by Malhotra et al. that the oxygen content decreased from 17.4 to 14.5% when the duration of the process was increased from 60 to 300 min at 200 °C when the mixed centrifuged sludge was treated with HTC [24]. As the temperature increased, the effect of retention time became diminished. The O content in DS-HCs decreased from 7.7 to 5.3% when the time was extended from 60 to 240 min at 260 °C. Zhang et al. reported similar results; the O content in hydrochars only reduced from 4.3 to 4.0% when handling municipal sludge with HTC at 260 °C, extending the time from 60 to 360 min [18].
Data analysis of the literature revealed that the O content of hydrochars varied from 1.6 to 18.5%, as shown in Figure 2e. Higher levels of O content (16.9–18.5%) appeared in hydrochars prepared from dewatered SS (Singapore) at low intensity (200 °C and 240–720 min) [13]. The temperature significantly affected dewatered anaerobically digested SS from Singapore, leading to a decrease in the O content of hydrochars from 10.6 to 1.6% when the temperature increased from 200 to 360 °C [31]. In milder conditions, the O content of DS-HCs exceeded that of AS-HCs. However, this divergence nearly disappeared when hydrothermal intensity/lnR0 ⩾ 13 showed that the solid loading has no distinct influence on the O content in hydrochars under these conditions. Aragon-Briceno et al. obtained comparable results, and it was determined that the O content varied between 10.5 and 8.7% when solid loading changed from 2.5 to 30% at 250 °C for 30 min (lnR0 = 13.57) [15].
3.2.5. Content of N in hydrochars
There was a decrease in N content from AS to AS-HCs, from 4.64 to 2.73–0.94%, and from DS to DS-HCs, from 4.21 to 4.38–1.82% (Figure 1f) when compared to raw materials. This could be attributed to the dissolution, hydrolysis, and disintegration of nitrogen-containing organic compounds, such as proteins [24, 31, 46]. As shown in Figure 1f, the N content in hydrochars declined in line with a growing hydrothermal intensity/lnR0. For example, the N content decreased from 2.73% in AS-HC-180-1 to 0.94% in AS-HC-260-4 due to intense amide hydrolysis and decarboxylation at 260 °C [39]. At a constant temperature, the N content decreased with increased retention time; however, this effect was no longer apparent at 260 °C. The results indicated a fluctuation of N content in DS-HCs at 180 °C, possibly due to the complexity of N-containing substances in DS after the mechanical dewatering process. In addition, at 220 °C, the N content in DS-HCs decreased as the duration increased, and a stable level was achieved (2.22–2.45%) after 120 min. Furthermore, He et al. demonstrated that 40% of the N content was retained in the hydrochars. The remaining 60% was released into the gas and liquid phases at 200 °C, with no decrease in nitrogen content when the carbonization period was extended to 4 h [13].
The literature data indicated that the N content in hydrochars was in the range 1.1–5.2% (Figure 2f). A higher amount of N content (5.2%) was found in hydrochars created from dewatered anaerobically digested SS at low intensity (200 °C and 20 min), and the value decreased to 3.9 and 3.2% when the temperatures were raised to 260 and 380 °C, respectively [31]. It was also observed that the N content of hydrochars derived from the mixed centrifuged SS at 200 °C reduced correspondingly, decreasing from 4.8 to 3.1% as the time increased from 60 to 480 min [24]. The N content in hydrochars ranged from 1.8 to 1.9%, with slight variance when the duration of municipal sludge treatment using HTC changed from 60 to 1440 min at 260 °C [18]. This study and literature data demonstrated that if the solid loading were low, the N content of hydrochars would be less than that found in hydrochars with a higher solid loading [15, 31].
3.2.6. Correlation analysis
Figure 1g shows the correlation between hydrothermal intensity and the different parameters (such as yield and components) of AS-HCs and DS-HCs. It can be seen from Figure 1g that the C, O, H, N, and S present in hydrochars are all negatively correlated with the hydrothermal intensity/lnR0, indicating that with increase in hydrothermal intensity, the contents of the five elemental compositions in hydrochars all show a downward trend. Likewise, C, O, H, N, and S components were significantly negatively correlated with ash content but positively correlated with the HHV. The comprehensive analysis shows that the ash content in hydrochars increases with hydrothermal intensity, and it also has some influence on the content of other components in hydrochars and HHV.
3.3. Structural characteristics of hydrochars
3.3.1. Morphology characterization of hydrochars
The scanning electron microscope (SEM) images demonstrated the distinct morphological structure between raw materials and hydrochars (Figure 3). In the HTC process, on the one hand, O and H elements left the surface of the raw materials in the form of CO2 and H2O, creating a surface with more porosity for hydrochars [45]. On the other hand, the large bulk structure in the raw materials was demolished after HTC and small spheres with a coarse surface were formed and collected, with abundant pore and tunnel structures inside the hydrochars [2, 47].
SEM images of (a) AS and typical AS-HCs; (b) DS and typical DS-HCs. AS-HCs represent the activated sludge hydrochars and DS-HCs represent the dewatered sludge hydrochars.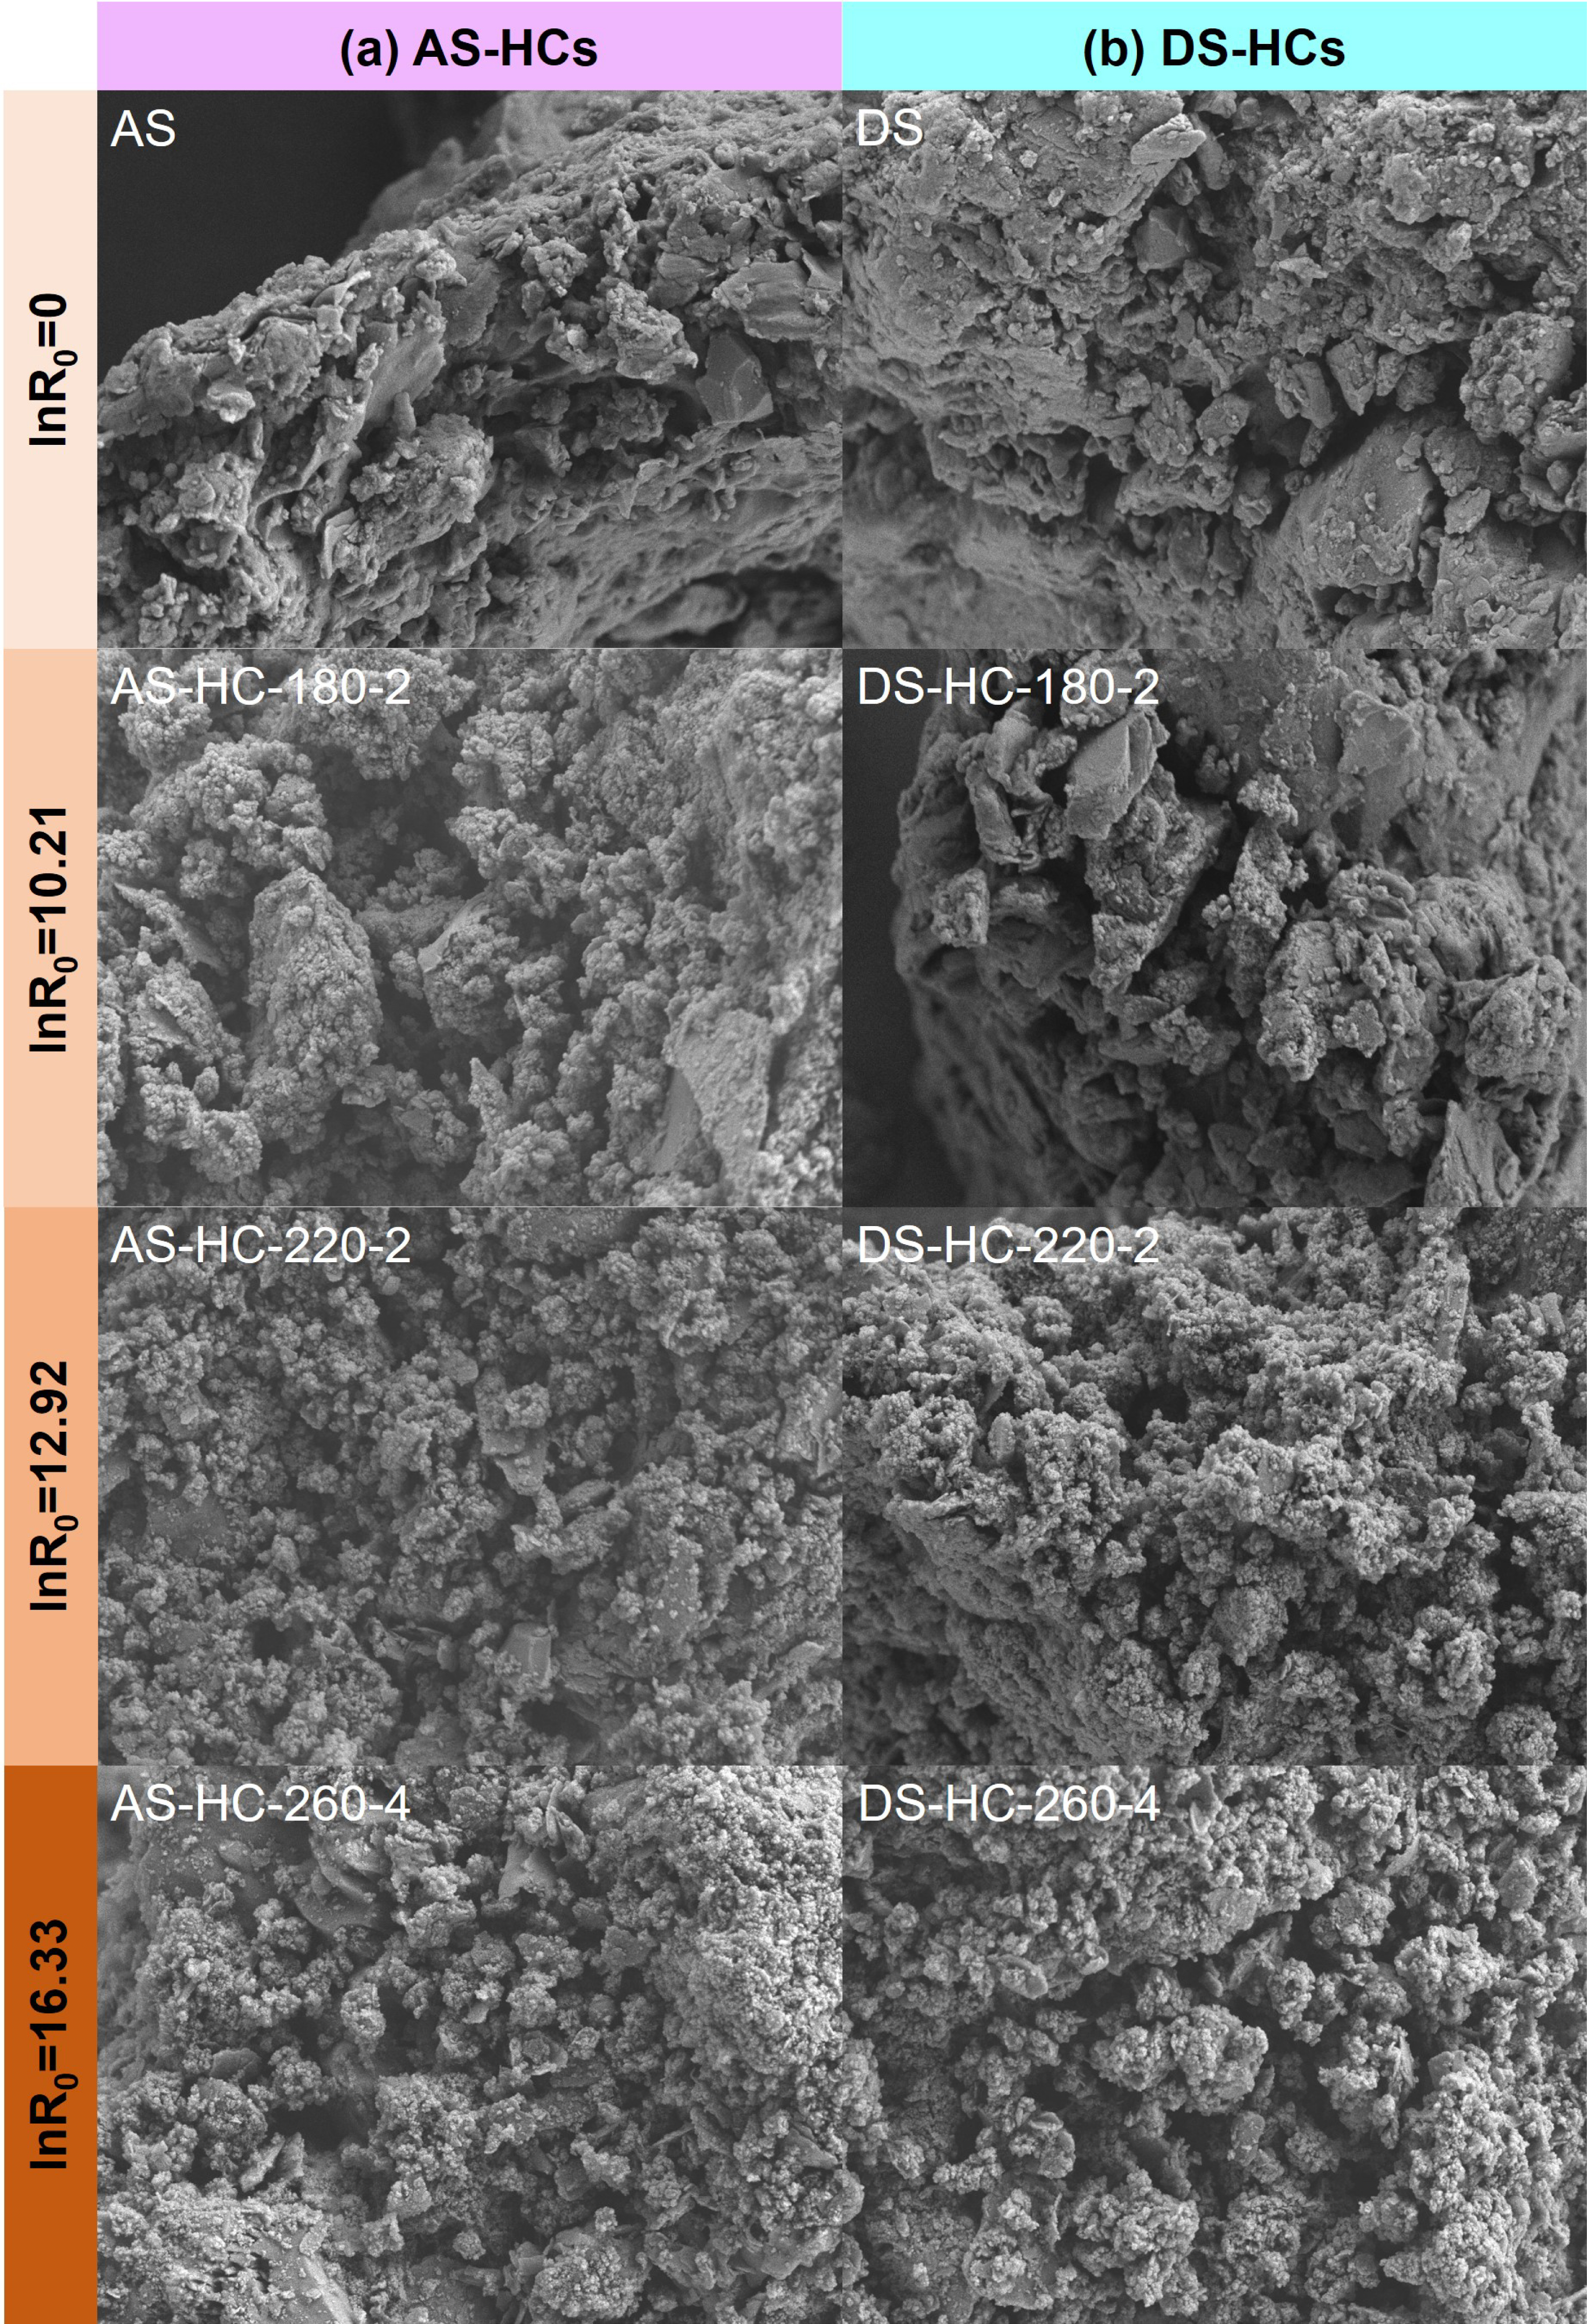
3.3.2. Atom ratios and van Krevelen diagrams of hydrochars
The ratios of H/C, O/C, (O+N)/C, and C/N were typically used to evaluate the aromatization, hydrophilicity, polarity, and source discrimination of biochar, respectively [48, 49]. As Table S2 indicates, the ratio of H/C in hydrochars decreased with increased HTC intensity; the content of H/C in AS-HCs shifted from 2.23 to 1.78, and the content of H/C in DS-HCs shifted from 2.04 to 1.67, which is associated with the enhanced aromaticity of hydrochars [24, 38, 50]. As the hydrothermal intensity increased, the O/C decreased from 0.47 to 0.29 for AS-HCs and from 0.48 to 0.19 for DS-HCs, demonstrating a decrease in their surface hydrophilicity [51]. The van Krevelen diagram, presented by the H/C and O/C ratios, as shown in Figure 4, can distinguish the HTC reaction pathways [12, 52, 53, 54]. For AS, it can be preliminarily deduced that the HTC process was governed by decarboxylation when hydrothermal intensity was low, while dehydration became intense with increased hydrothermal intensity. The high water content in AS could have promoted the hydrolysis of organic matter and increased decarboxylation reactions [31, 33]. For DS, the HTC process mainly followed a dehydration trend, consistent with the results reported by Wang et al. [12], He et al. [13, 38], and Shi et al. [40]. Significant decarboxylation and dehydration reactions produced hydrochars of a higher fuel quality [31], suggesting the possibility of utilizing hydrochars as fuel.
Van Krevelen diagram of AS-HCs and DS-HCs. AS-HCs represent the activated sludge hydrochars and DS-HCs represent the dewatered sludge hydrochars. For AS, the HTC process was mainly governed by decarboxylation and dehydration. For DS, the HTC process was mainly governed by dehydration.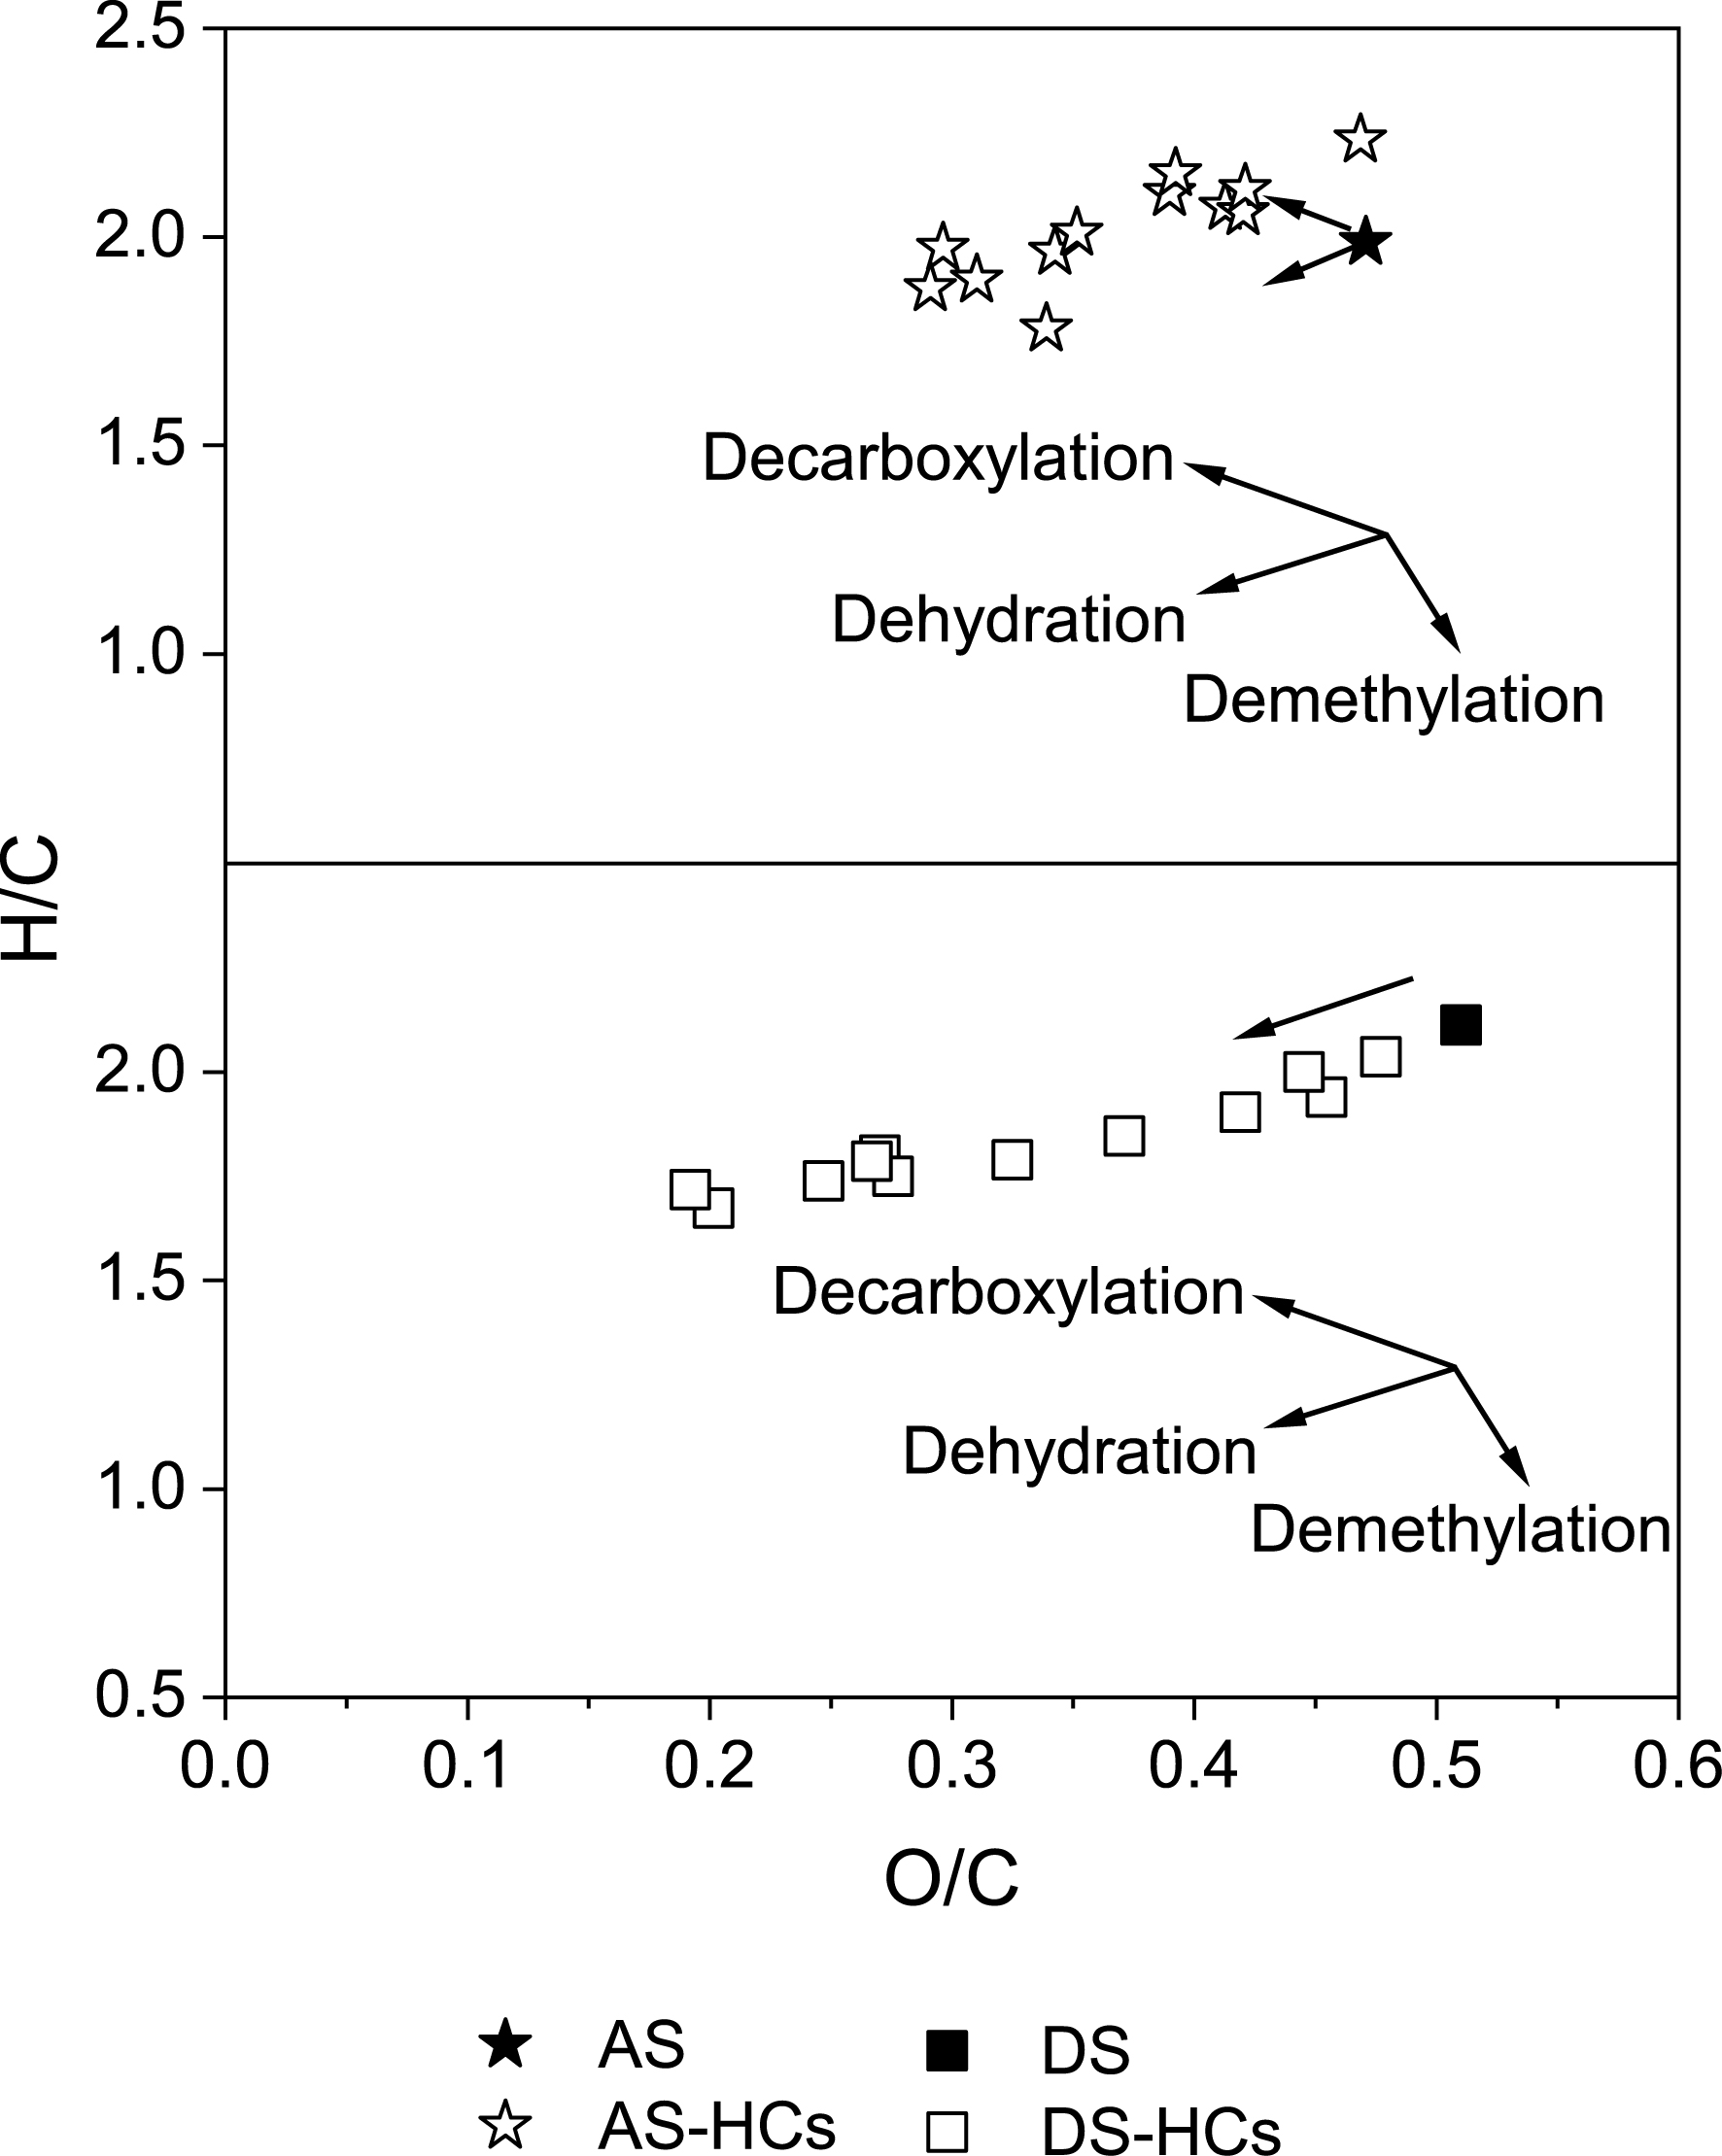
The C/N ratio is a useful parameter, and it was found that many studies use the C/N ratio to assess the contribution of anthropogenic or agricultural sources to aquatic systems. The C/N ratio of hydrochars was significantly higher than that of the sludge, indicating considerable N loss during the HTC process. The C/N values of AS-HCs (8.6–19.3) were appropriately close to the C/N from anthropogenic sources (13.7), and they had similar effects on aquatic systems, suggesting potential for the application of fertilizer to soil [55]. The C/N values of the DS-HCs were in the range of 8.3–12.5, which is comparable to the C/N of the humic substance fraction observed in the soil (9.74) [56]. In addition, they had similar effects on water bodies, indicating that the DS-HCs had potential to be used as a soil amendment. The polarity index (O+N)/C decreased when the hydrothermal intensity value was higher, revealing that the number of polar groups in hydrochars was lower. Polar groups usually function as water-binding sites and contribute to the formation of water clusters [48]. Therefore, it can be concluded that the surface hydrophobicity of hydrochars grows with the rise in hydrothermal intensity, which has a consequent effect on the surface adsorption features.
3.3.3. Functional group characterization of hydrochars
To further investigate the change in functional groups of hydrochars at different hydrothermal intensities, Fourier-transform infrared spectroscopy (FTIR) analysis was employed, which is presented in Figures 5a,b. The peak at 1540 cm−1 (C–N–C bending vibration and/or C=O in –COOH) in hydrochars declined to a weaker shoulder or even disappeared depending on the HTC intensity, which corroborated the hydrolysis of protein and the decarboxylation reaction. Simultaneously, the aromatic structure was observed; for instance, the broader band at 1616 cm−1 and strengthened bands at 1460–1450 cm−1 and 750–780 cm−1 in hydrochars with increasing intensity could be assigned to aromatic C=O, C=C, and C–H, respectively [48], which verified the aromatization of intermediates during the HTC process. Moreover, increased intensity caused the C-aliphatic peaks to become more pronounced, demonstrating the production of more hydrocarbon compounds. The absorption peaks at 2920 and 2850 cm−1 (C–Haliphatic stretching) became stronger with increasing hydrothermal intensity, which indicated that more hydrocarbon compounds formed.
The FTIR curves of (a) AS and typical AS-HCs; (b) DS and typical DS-HCs. The XRD curves of (c) AS and typical AS-HCs; (d) DS and typical DS-HCs. TG and DTG curves of (e) AS and typical AS-HCs; (f) DS and typical DS-HCs. 1-quartz, SiO2 (2𝜃 = 20.6°, 26.6°, and 50.1°); 2-gismondine, CaAl2SiO8 ⋅ 4H2O (2𝜃 = 27.9°). AS-HCs represent the activated sludge hydrochars and DS-HCs represent the dewatered sludge hydrochars.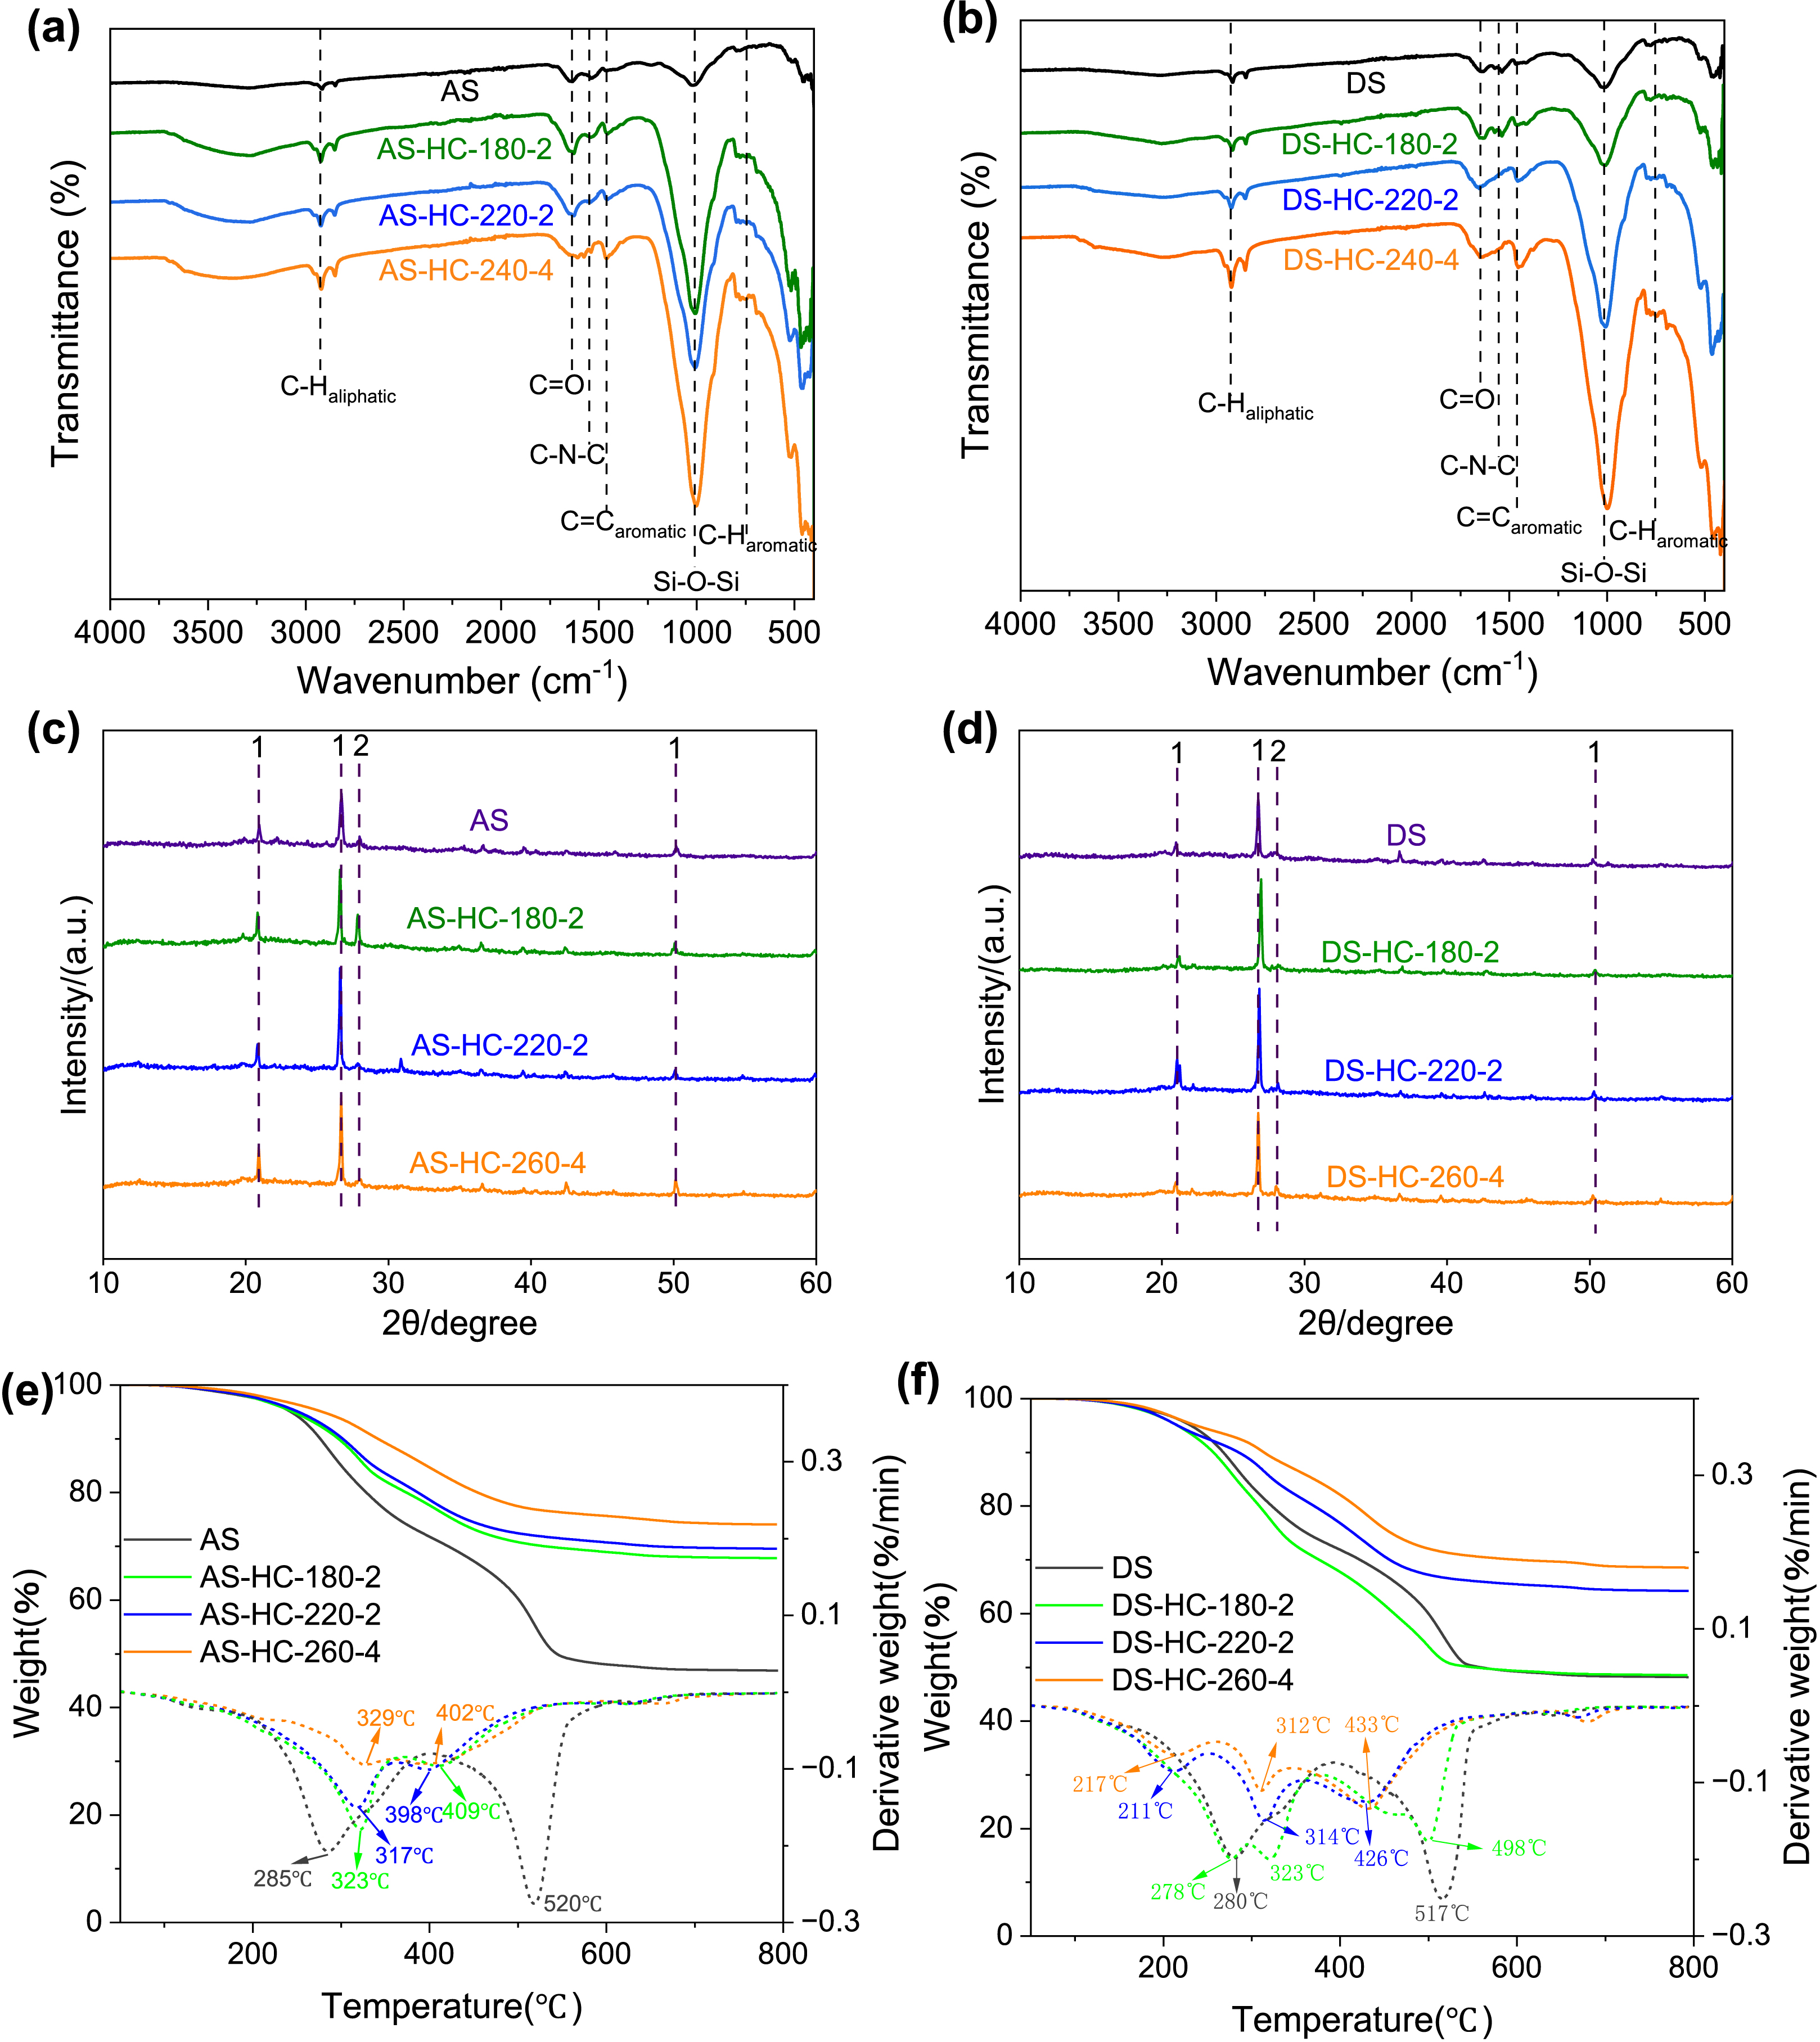
It was noticed that the Si–O stretching band at 1010 cm−1 became much stronger with hydrothermal intensity, which was in line with the rising ash fraction in hydrochars. The X-ray diffraction (XRD) patterns (Figures 5c,d) also revealed that the primary crystal structure of hydrochars was SiO2 (2𝜃 = 20.6°, 26.6°, and 50.1°). As seen in SEM images (Figure 3), the hydrochars have some sheet-like SiO2, which is more obvious in AS-HCs than in DS-HCs, which is in keeping with the higher ash content in AS-HCs. Si is a fundamental element in soil ecosystems due to its abundance in the Earth’s crust, and it is a vital nutrient for the growth of certain species of silicon-loving plants. It has been indicated that Si in biochar could interact with and bind to the carbon fractions, which positively affected carbon fixation and changed the dissolution patterns of carbon and silicon in biochar [57]. The addition of Si-rich biochar has been found to act as a slow-release source of Si, resulting in a noticeable rise in the yield of grain and straw [57]. Additionally, the impact of biochar application in acidic soil had a positive effect as it decreased CO2 and N2O emissions [58]. Therefore, the abundant Si-containing material in hydrochars has become a prominent factor that must be considered when applying hydrochars in soil.
To further investigate the evolution of the functional groups of hydrochars at different hydrothermal intensities, 2D-COS FTIR analysis was employed, which is presented in Figure 6. Autopeaks appeared at 2920 cm−1 and 2850 cm−1 (C–Haliphatic), 1640 cm−1 (C=O), 1540 cm−1 (C–N–C), 1010 cm−1 (Si–O–Si), and 750–780 cm−1 (C–Haromatic) on the diagonal of the synchronous map. The autopeaks are all positive, revealing a consistent tendency in the alterations of their associated functional groups. As hydrothermal intensity increases, the peak of the functional group at 2920 cm−1 and 2850 cm−1 rises, showing that more hydrocarbons are produced. The peak at 1010 cm−1 reveals the most conspicuous growth in the functional group, signifying that the Si–O bond stretching vibration becomes significantly stronger, which is consistent with the enhancement in the ash content of the hydrochars as hydrothermal intensity increases.
2D-COS FTIR analysis of the functional groups of hydrochars at different hydrothermal intensities (lnR0). AS-HCs represent the activated sludge hydrochars and DS-HCs represent the dewatered sludge hydrochars.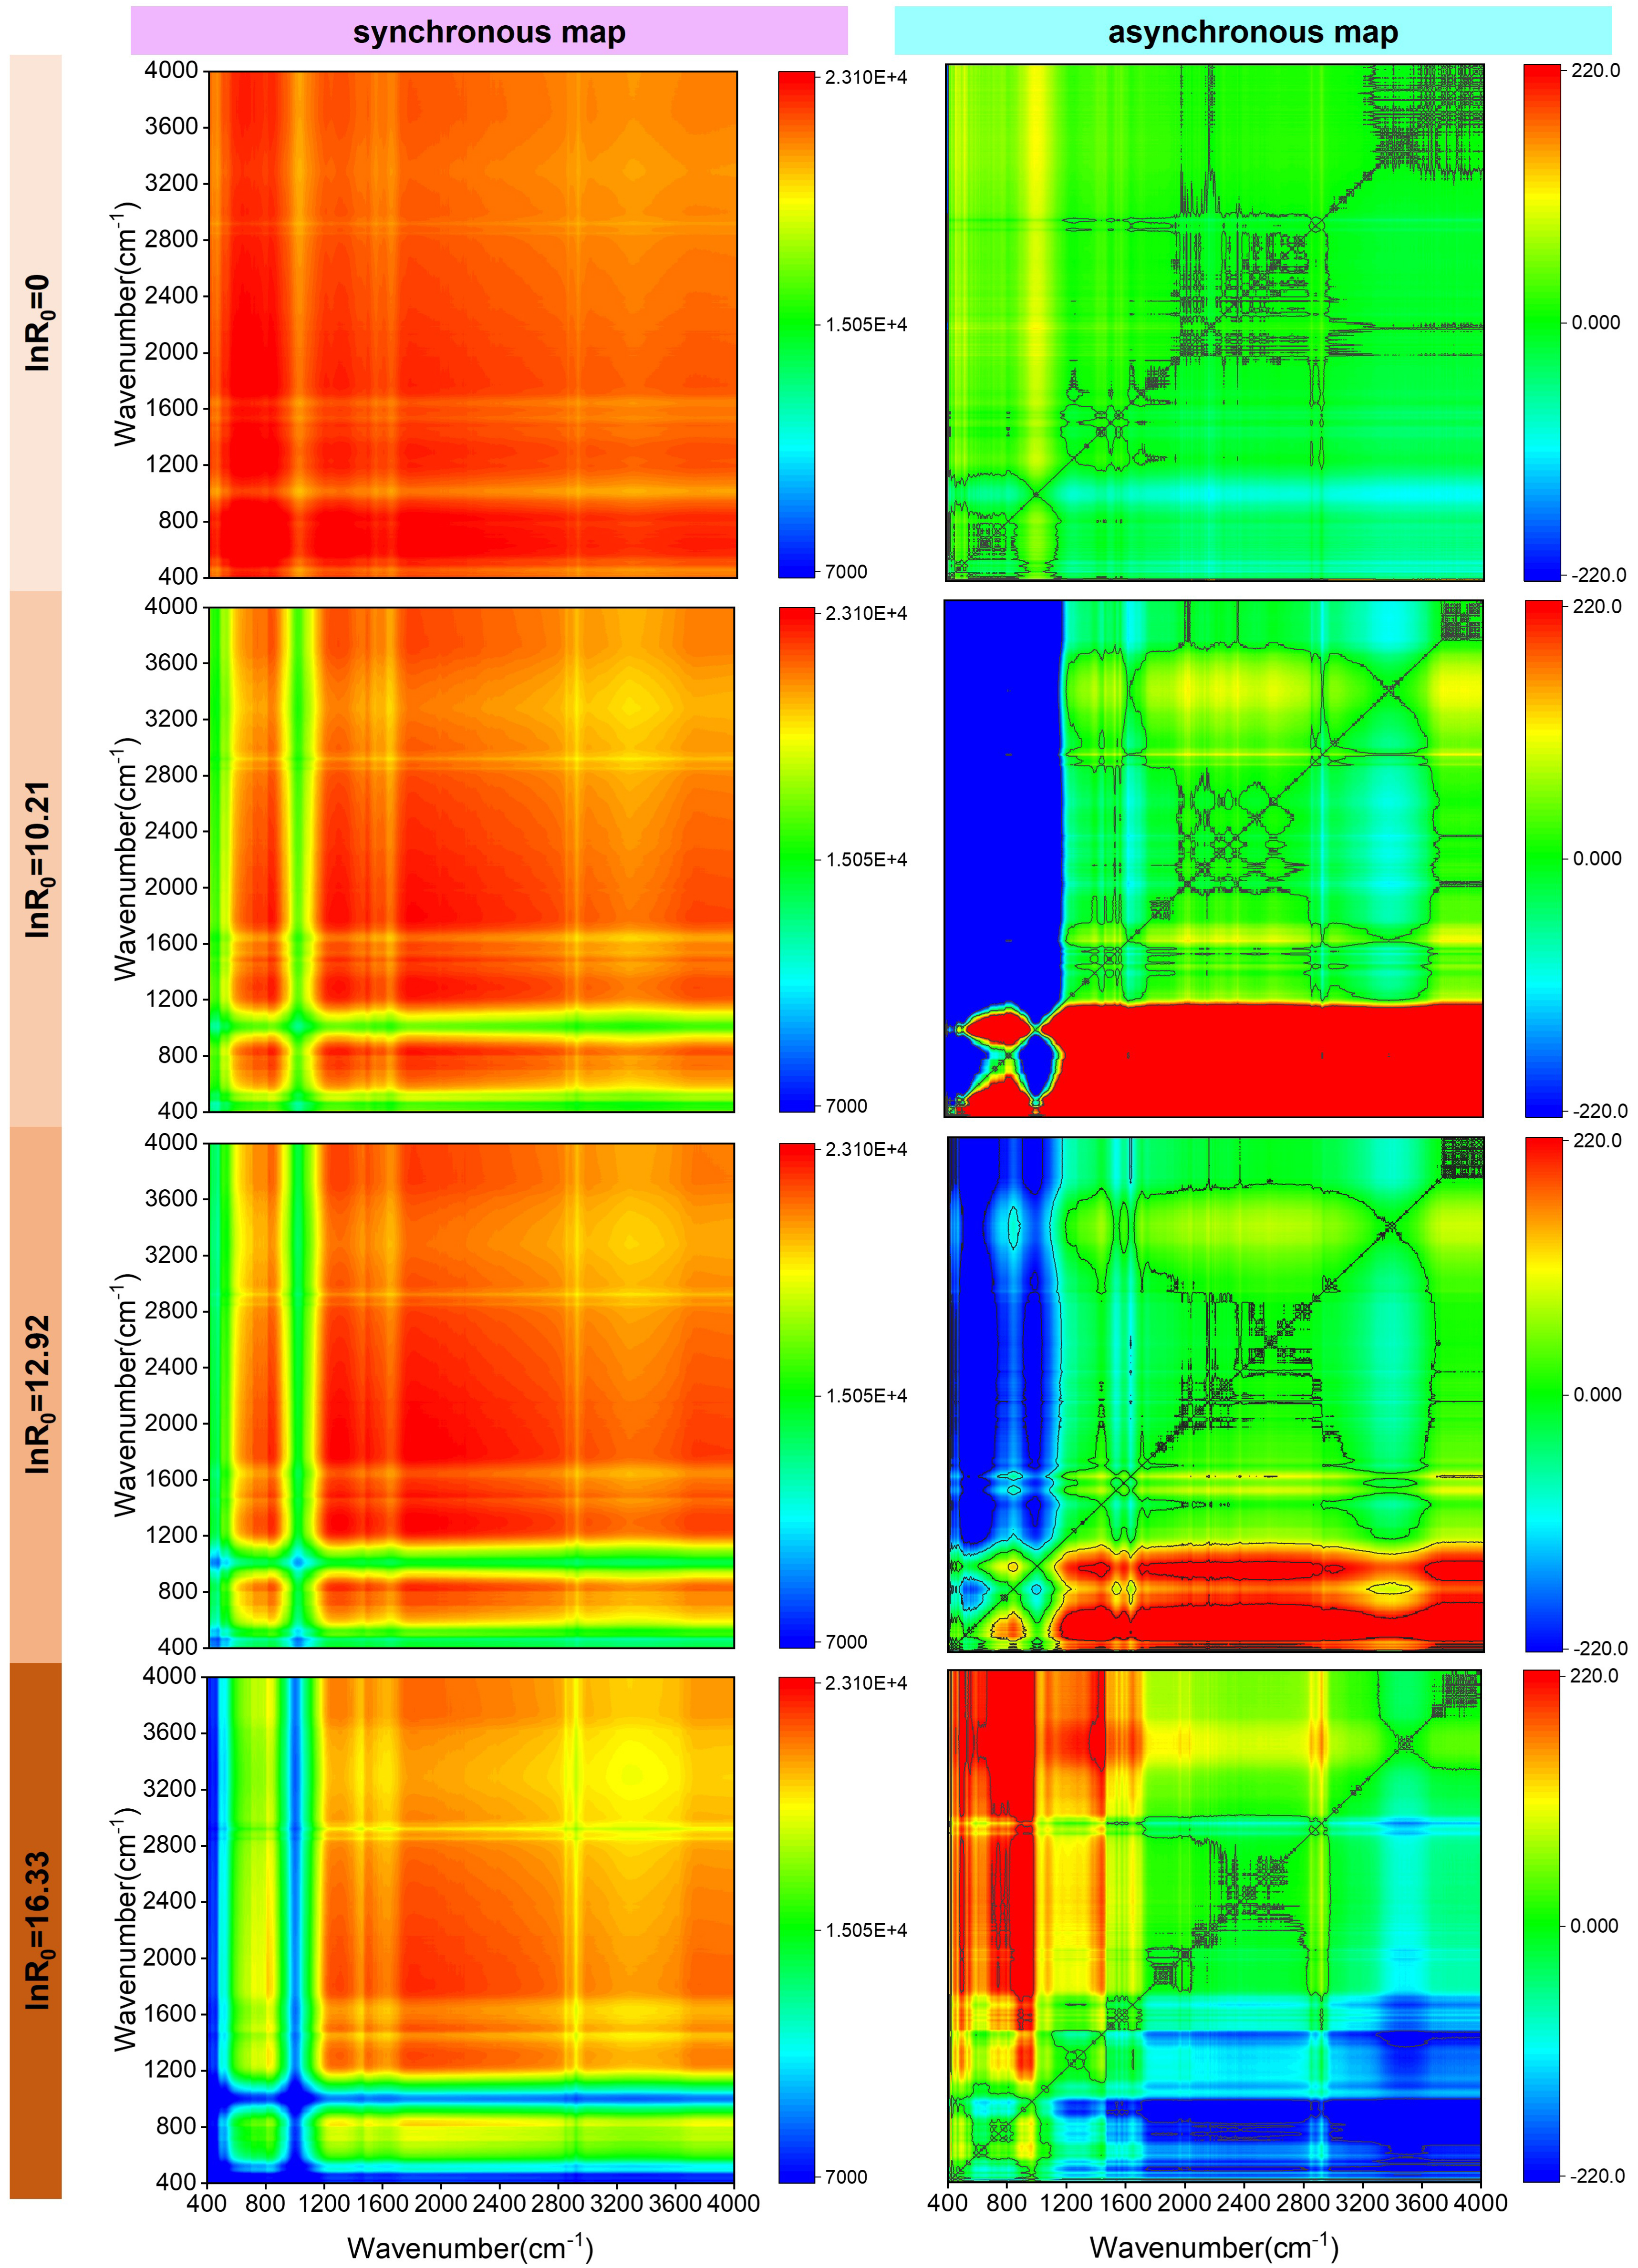
The results of the asynchronous map revealed that the crosspeak signature altered with an increase in hydrothermal intensity, suggesting that the increase in hydrothermal intensity modified the sequence of functional groups that occur during the HTC process. The change in the sign of the crosspeaks in the asynchronous map was consistent at hydrothermal intensities of lnR0 = 10.21 for 180 °C, 2 h and lnR0 = 12.92 for 220 °C, 2 h. The negative value at the crosspeak 𝜓 (1010, Y) suggested that the stretching vibration of Si–O occurred last. The positive value at the crosspeak 𝜓 (1640, 2920/2850) demonstrated that the aromatization reaction is ahead of the synthesis reaction of hydrocarbons. A positive value at the crosspeak 𝜓 (2920/2850, 1540) revealed that the reaction of hydrocarbons had occurred before the hydrolysis of proteins. Accordingly, at low and medium levels of hydrothermal intensity, the order of functional groups that shift during the HTC process is C=O > C–Haliphatic > C–N–C > C–Haromatic > Si–O–Si. However, as the hydrothermal intensity increased to 12.92 (260 °C, 4 h), a marked change in the order of functional groups was observed compared to low and medium levels of hydrothermal intensity. A positive value at crosspeak 𝜓 (X, 1010) was observed, signifying that the Si–O stretching vibration change occurs first. A positive value at crosspeak 𝜓 (750–780, 1540) demonstrated that the C–H bond aromatization reaction had occurred before the protein hydrolysis reaction. The positive value at crosspeak 𝜓 (1540, 1640) indicated that the protein hydrolysis reaction occurred before the C=O bond aromatization reaction. The negative value of crosspeak 𝜓 (1640, 2920/2850) showed that the C=O bond aromatization occurred before the synthesis of hydrocarbon compounds. Consequently, as the hydrothermal intensity increased, the order in which the functional groups transform during HTC is Si–O–Si > C–Haromatic > C–N–C > C=O > C–Haliphatic.
3.3.4. Thermal stability of hydrochars
The TG and derivative thermogravimetric (DTG) analyses of sludge and hydrochars helped investigate their thermal stability, as depicted in Figures 5e,f. Under different values of low (lnR0 = 10.21 for AS-HC-180-2), medium (lnR0 = 12.92 for AS-HC-220-2), and high (lnR0 = 16.33 for AS-HC-260-4) hydrothermal intensities, hydrochars derived from AS exhibited similar TG curves with increasing residual amounts, which was in agreement with the ash content of the hydrochars. The DTG curves of AS-HCs indicated that the first maximum weight-loss rate appeared at 317–329 °C, which was higher than the corresponding rate in AS. The volatiles in AS were removed and carbonaceous components were generated simultaneously by HTC, leading to a new peak at higher pyrolytic temperatures [45]. At HTC temperatures ranging from 520 to 409, 398, and 400 °C, the second peak gradually widened and weakened, signifying that the AS-HCs had higher thermal stability and better fuel quality [12]. In the DTG curves of DS-HCs, two peaks were observed in the first region (180–400 °C) and moved to a lower temperature as the hydrothermal intensity increased. For example, the first peak corresponding to the peak at 280 °C in DS shifted to 278, 211, and 217 °C with a reduced intensity at low, medium, and high levels of hydrothermal intensity, respectively. Like AS-HCs, a new peak appeared at higher pyrolytic temperatures of 312–323 °C due to the carbonaceous components formed during HTC. The peak of 517 °C in the DS shifted to a lower temperature of 498 °C for DS-HC-180-2, 426 °C for DS-HC-220-2, and 433 °C for DS-HC-260-4. The magnitude of migration was not as pronounced for DS-HCs as it was for AS-HCs, illustrating that the pyrolysis morphology of DS-HCs was different from that of AS-HCs. It could be that the organic components in AS underwent a change after dehydration treatment and impacted their transformation during the HTC process.
The recalcitrance index (R50) was proposed to quantify biochars’ degradability [26]. With increasing hydrothermal intensity, the R50 for AS-HCs gradually increased from 0.38 to 0.43 and DS-HCs from 0.39 to 0.44. O/C can also be used as a stability index of biochar in soils. The two groups are Class 1 with a half-life greater than 1000 years (O/C < 0.2) and Class 2 with a half-life from 100 to 1000 years (0.2 < O/C < 0.6) [59]. DS-HC-260-4, with an O/C of 0.19, was designated to Class 1, and the other hydrochars were designated to Class 2. To conclude, hydrochars under high hydrothermal intensity conditions may possess greater resistance to deterioration and a longer life span in the soil system, suggesting their potential use as agents for soil remediation and carbon sequestration.
3.4. Potential application of hydrochars
3.4.1. Energy recovery as fuel
A major potential utilization of hydrochars is as a fuel source for energy recovery. The HHV and the lower heating value (LHV) are the critical fuel properties that determine the energy content of charred materials and can be evaluated as in Equations (5) and (6) [13, 60].
| (5) |
| (6) |
According to Table S2, the HHV and LHV values of hydrochars were usually lower than those of raw materials. For instance, the HHV decreased from 11.87 (AS) and 11.37 MJ/kg (DS) to 5.86 (AS-HC-260-4) and 8.81 MJ/kg (DS-HC-260-4), respectively, when the hydrothermal intensity (lnR0) was 16.3. As a whole, the energy recovery ratio decreased with growing hydrothermal intensity in accordance with the conclusions of He et al. [13, 31]. The HHV had a strong relationship with C and H contents; thus, the influence of HTC parameters on HHV followed a similar trend to that of C and H contents (Figure 1g). The HHV had a negative correlation with the ash content, which signified that the rise in ash content during HTC would have a detrimental effect on the HHV [24, 61]. The HHV/LHV values of DS-HCs were higher than those of AS-HCs. According to the HHV, DS-HCs kept 66.60–37.70% of the energy from the raw material compared to AS-HCs, which only held 48.60–22.50%. Regarding fuel utilization, DS was the better option for constructing hydrochars. Assuming the HTC process to be energy-demanding, the effect of HTC parameters on the process energy needs to be considered.
Considering the above results, the utilization of DS is proposed. Therefore, this study was conducted using DS with a moisture content of 80.3%, a density of 1.13 × 10³ kg/m3, and a volume of approximately 4.64 m3 based on 1 t of absolute dry sludge. At a reactor filling ratio of 70% in the HTC process, the required vapor volume is 1.98 m3. Using Equation (7), the vapor pressure can be calculated for the corresponding temperature, and the vapor density and mass can be seen in Table S3. The process in the reactor is simplified without considering the energy transformation resulting from the molecular decomposition of raw materials. The heat needed for the temperature elevation and phase transition in the HTC process can be determined using Equation (8), and the results are listed in Table S3.
| (7) |
| (8) |
The recoverable energy (calculated by LHV) of hydrochars that were applied to combustion to retrieve energy is stated in Table S3 [62]. From the data in Table S3, it is evident that the energy available for recovery in hydrochars is sufficient to fulfill the heat needs for a material temperature increase and phase transition. Especially when the HTC temperature is low (180 and 220 °C), the energy available for recovery is abundant. DS-HC-260 has less energy conservation; however, its elemental composition (O/C: 0.20–0.38 and H/C: 0.65–1.65) is comparable to lignite [12]. It can be succinctly stated that as the hydrothermal intensity heightened, the energy recovery rate decreased; yet, the fuel quality of hydrochars was higher [31]. It was also observed by researchers that hydrochars from SS with high ash content cannot adequately support energy utilization via combustion [38]. In this way, hydrochars produced under high hydrothermal intensity could be combined with lignite for combustion [12]. Furthermore, the data demonstrate that the majority of energy was used to heat the water, which suggests that solid loading affects hydrochar performance and substantially impacts the energy consumption of the HTC process.
3.4.2. Land application
High ash in sludge can impede the coalification process during HTC, decrease C content in hydrochars, and adversely affect energy utilization [38, 45, 53]. Thus, it is essential to investigate other feasible uses for this kind of hydrochar. In China, it is suggested to use stabilized sludge products for fertilizers or soil amendments to improve greening, abandoned mine sites, saline-alkaline soil, and desertified lands. The above analysis of R50, (O+N)/C, FTIR, and XRD suggests hydrochars derived from sludge could be used for practical purposes. The content of heavy metals in products is a significant factor regarding land use [63]. The utilization of sewage and its derivatives poses a significant risk due to heavy metal contamination. Figure 7 and Table S4 indicate the content of heavy metals in the representative samples of this study. The Cd content was below the detection limit in all samples. The hydrochars possess more Zn, Ni, and Cr than the raw materials, but the amount of Cu has decreased. Generally, the hydrochars produced by sludge in this study have levels far below the heavy metal index (Cr 0.15 mg/g) outlined in NY/T 3618-2020, suggesting that its land use is viable. This might result from the sewage treatment plant dealing with municipal sewage and the residual sludge containing a low level of heavy metals. Therefore, it is essential for the specified application to be aware of the heavy metal content in the raw materials. Besides, our previous research revealed that after the amendment of sludge-derived hydrochars into the soil, the porosity, O abundance, and ash content of hydrochars increased with aging time, resulting in improved Cd sorption. The ash content was a critical factor in the heterogeneity of Cd sorption sites [64]. Thus, hydrochars have potential as a soil amendment because it positively affects soil properties but depends on the soil type. Therefore, before large-scale land use of hydrochars, it is necessary to comprehensively evaluate all aspects.
Concentrations of different heavy metals in (a) AS and typical AS-HCs; (b) DS and typical DS-HCs. AS-HCs represent the activated sludge hydrochars and DS-HCs represent the dewatered sludge hydrochars.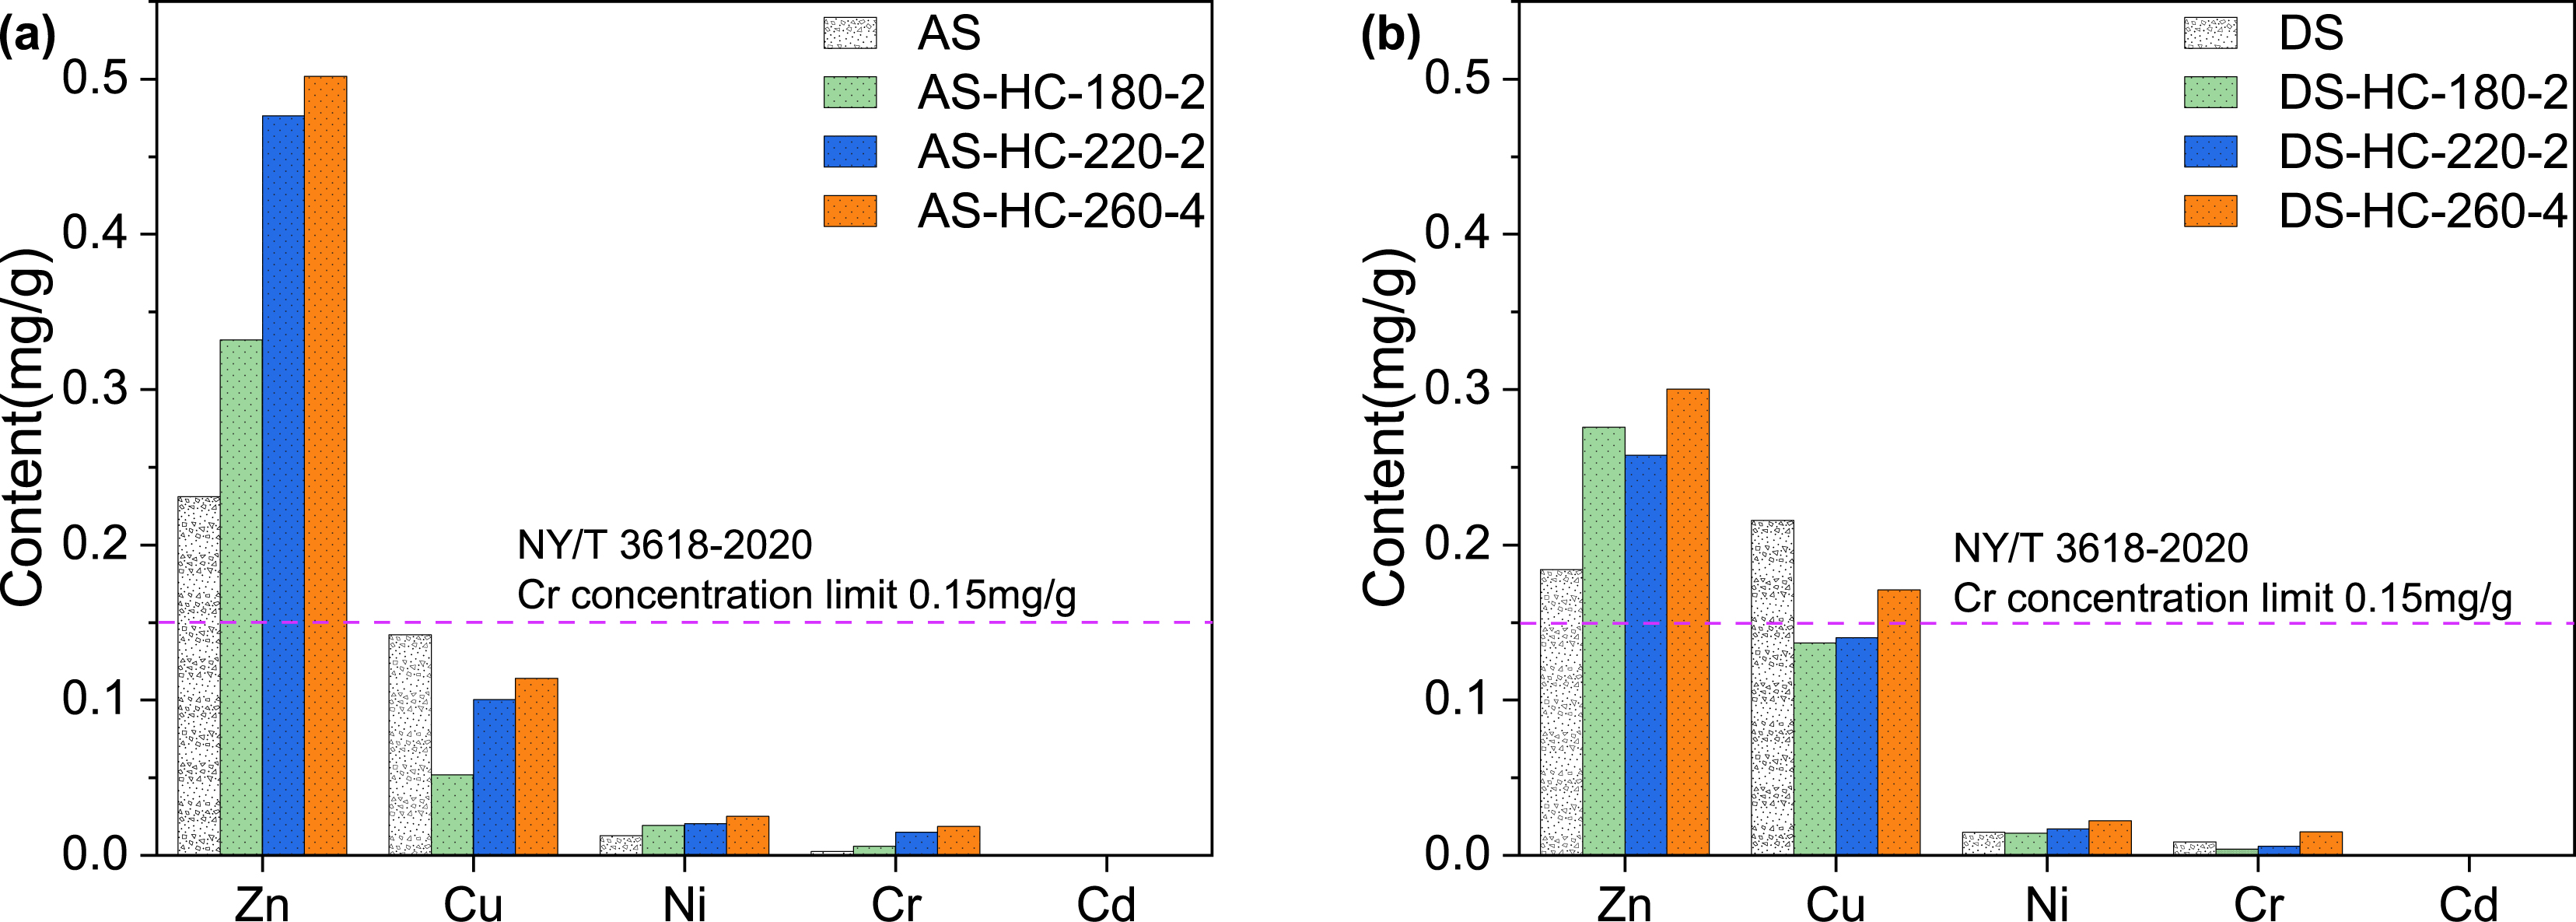
4. Conclusion
The discrepancies in sludge properties in various regions lead to differences in hydrochars, which should be thoroughly evaluated when selecting the process and utilization, emphasizing the organic matter and heavy metal content as it will affect the yield of products and potential resource application methods. The study showed that the hydrothermal intensity influenced the yield, ash content, and elemental composition of hydrochars. An upper limit of hydrothermal intensity was necessary for treating a particular sludge via HTC. The upper limit could be used as the criteria for constructing and operating the widespread implementation of HTC. The findings showed that an appropriate hydrothermal intensity could be selected, and the reaction time is crucial since a short period would minimize the reactor volume necessary for continuous production, thus decreasing the capital costs of such a process. To optimize energy use in the HTC process, selecting a higher solid loading as much as possible is essential. Using the product as fuel requires more heat and time to raise its coal rank, but it will not retain heat. Incorporating hydrochars as a secondary fuel or using co-HTC technology to boost the calorific value of products is part of current strategies. This study allows us to fully understand the differences in the structure and properties of hydrochars obtained under different solid contents and hydrothermal intensities. At the same time, it not only provides specific ideas for the design, parameter selection, and optimization of the sludge HTC treatment process but also provides a basis for the resource utilization of hydrochars.
Declaration of interests
The authors do not work for, advise, own shares in, or receive funds from any organization that could benefit from this article, and have declared no affiliations other than their research organizations.
Funding
This work was funded by the National Natural Science Foundation of China (Nos. 42107398 and 42277332), the Natural Science Foundation of Jiangsu Province (BK20210358 and BK20221428), and the China Postdoctoral Science Foundation (2020M68618). Y. F. Feng thanks the support of “333” High-level Talents Training Project of Jiangsu Province (2022-3-23-083).