


 CC-BY 4.0
1. Introduction
Solid waste management is an enormous challenge for contemporary human civilization as the increasing accumulation of solid waste harms the environment and human health. In this context, recovery is a step toward a circular and sustainable economy. Among these waste products, agricultural residues are considered particularly significant [1, 2, 3]. Their global volume has witnessed a steady rise, propelled by rapid population growth and heightened by agricultural demands. Despite their natural biodegradability, these wastes are frequently considered environmentally harmful, and their degradation rates are generally insufficient [4, 5]. Therefore, the reutilization of agricultural waste appears to be a possible solution to this problem. Due to its lignocellulosic nature, agricultural waste can be used to produce energy [5], sequester carbon [6], and significantly contribute to the creation of carbonaceous materials and biofuels through various thermochemical techniques, including pyrolysis, gasification, combustion, torrefaction, and hydrothermal carbonization (HTC) [7]. The HTC stands out as a thermochemical process that modifies the original structure of biomass through a series of chemical reactions that occur in the presence of water under subcritical conditions (180–250 °C) and under autogenous pressure (10–40 bar) [1]. This process can be considered a form of moderate-temperature carbonization, making it more energy-efficient compared to other thermochemical techniques like pyrolysis [8, 9, 10]. In particular, this process converts wet precursors (biomass and agricultural wastes) into gas, liquid, and a carbon-rich solid called hydrochar (HC) [11, 12]. The HC presents several benefits over its initial biomass, including higher carbon content, specific surface morphology, increased oxygenated functional groups, such as hydroxyl and carboxyl groups, and higher calorific value [5, 13]. Kabakci and Baran [14] investigated the fuel and surface characteristics of HCs derived from various lignocellulosic biomasses. They showed that HTC significantly increases the higher heating value (HHV) and carbon content of agricultural residues, although the biomass type also had a significant impact on HC properties [14]. Si et al. [6] evaluated the liquid–solid ratio impact during HTC and demonstrated its high effect on HC properties. Bourafa et al. [3] studied the HTC of olive and date stones at different times and temperatures. They found that all generated HCs present high mass yield, many acidic and basic functional groups, and relatively low porosities, although the effect of time and temperature parameters was also very important.
In recent years, bio-based HCs have been further processed to tune them up, mainly through physical or chemical activation, to produce activated carbons (ACs) with very interesting results [4, 15, 16, 17]. This process significantly increases the pore volume of HCs by selectively removing the condensed matter that blocks microporosity [18, 19, 20]. Activated HCs have been investigated for different end uses, including energy storage [16, 21] and adsorbents for wastewater treatments [17, 19].
This work focused on two main objectives. The first is the preparation and fuel characterization of HCs made from two local wastes: date palm pines (DPPs) and pine nut shells (PNSs). Particular attention was paid to the effects of biomass type and solid/water ratio (SWR) on the final properties. Second, the produced HCs were steam-activated to generate ACs with a well-developed surface and porosity to be used in further applications.
2. Materials and methods
2.1. Raw feedstock collection
In this study, DPPs and PNSs were used as raw precursors for HC production. The former are the residues of date obtained from date palm (Phoenix dactylifera L.) produced in the southwest region of Tunisia, and the latter are collected from Pinus pinea trees from Ain Draham in the north of Tunisia. The collected biomass was washed with distilled water to eliminate undesirable substances and naturally dried at ambient temperature for 2–3 days until a constant humidity value was achieved. Then, the biomass was crushed using a high-speed rotary cutting mill, sieved to a desired particle size between 1.6 and 3.15 mm, and then dried in an oven at 105 °C for 24 h. The dry biomass was stored in closed flasks and placed in a desiccator for further use.
2.2. HC preparation
The HC was prepared in a 1.8 L autoclave (Parr 4848 model) equipped with a controller, which allows the programming of the experiments, autonomous heating, and sensors for measuring pressure (P) and temperature (T). The HTC runs were carried out at a temperature of 250 °C for 90 min with different SWRs. Weights of 12.5, 50, and 75 g of precursors were mixed separately with 600 g of water to obtain SWRs of 1/48, 1/12, and 1/8, respectively. The operational conditions were chosen based on prior methods of HC production from agricultural residues [22]. At the end of the HTC process, the autoclave was immediately placed in a cold-water bath and allowed to cool down to room temperature. The solid phase was then separated from the liquid phase by simple filtration, washed many times with distilled water until neutral pH was attained, and dried at 105 °C overnight to remove residual moisture. The obtained HCs were referred to as “HC-P-R”, where P represents the precursors (DPP and PNS) and R the solid/water ratio of HTC. For example, “HC-DPP-1:8” denotes “HC based on DPP with an SWR of 1/8.
The solid yield (SY) values of the prepared HC (SY (%)) were calculated according to the following expression (dry basic):
| (1) |
2.3. Activation process
The obtained HCs were then used to prepare ACs by physical steam activation. To this end, the precursor was introduced into a stainless-steel reactor placed in a vertical automated furnace equipped with a temperature controller, with an initial mass equal to 70 g. Activation was performed in the presence of a continuous flow of purified nitrogen gas with a flow rate of 70 mL/min until a temperature of 700 °C with a heating rate of 10 °C/min was attained. At this temperature, steam water (70 vol% H2O in N2) was introduced and the activation continued for 1 h until the temperature increased to 850 °C. These optimal values were deduced from previous research [23]. The reactor was then slowly cooled down while maintaining the nitrogen flow. The obtained ACs were denoted as HCA-DPP and HCA-PNS for activated HCs from DPP and PNS, respectively.
The burn-off values of the synthesized ACs (BO (%)) were calculated according to the following expression:
| (2) |
2.4. Adsorption process
2.4.1. Solution preparation
Diclofenac sodium salt (DCF) is a common anti-inflammatory nonsteroidal medicament detected in many waste water effluents from the pharmaceutical industry and hospital and municipal sewage [24], which was used as an adsorbate in our work. The DCF was of analytical grade with purity higher than 99% and obtained from Prolabo. Its principal characteristics are listed in Table 1. The DCF solution was prepared by accurately weighing 1 g of salt and dissolving it in 1 L of distilled water. Then the solution was diluted to obtain the target concentrations.
Chemical properties of DCF
| Chemical name | 2-[2-(2,6-dichlorophenyl) aminophenyl] ethanoic acid |
| Molecular formula | C14H10Cl2NNaO2 |
| pKa | 4.15 |
| Molar mass (g/mol) | 296.149 ± 0.017 |
| Fusion temperature (°C) | 283–285 |
| Water solubility (g/L) | 2.37 mg⋅L−1 (water, 25 °C) |
| Maximum absorbance (λ, nm) | 275 |
2.4.2. Batch adsorption test
The DCF adsorption experiments by HC-PNS-1:8 and HC-DPP-1:8 were carried out in a series of 100 mL glass Erlenmeyer flasks. A stock solution of 1 g/L of DCF was used for the preparation of 10–200 mg/L DCF solution by diluting with double-distilled water. An amount of 0.1 g of AC was added to each flask at a fixed temperature of 25 °C and the pH of solution. The solutions were stirred for 24 h to achieve thermodynamic equilibrium. The initial and residual DCF concentrations were measured using UV spectroscopy at a wavelength of 275 nm, corresponding to the maximum absorbance. The amount of DCF adsorbed onto activated HC, qe (mg/g), was calculated using the following equation:
| (3) |
2.4.3. Isotherm models
The experimental data were fitted to widely used isotherm models such as Langmuir, Freundlich, and Temkin.
The Langmuir isotherm model is given as [15]
| (4) |
The Freundlich equation is given as [15]
| (5) |
The Temkin equation is written as follows [25]:
| (6) |
2.5. Material characterization
2.5.1. Elemental analysis
Elemental analyses (C, H, and N) were carried out using an automatic elemental analyzer EA-1108 CHNS (LECO Instruments, Germany) to quantify the carbon, hydrogen, and nitrogen contents using the standard specification CEN/TS 15104 (2005). The specification CEN/TS 15289 (2006) method was used to determine the sulfur content, which was in all cases very low (<0.01% by mass). The oxygen content was determined from the difference.
2.5.2. HC higher heating value
The HHVs of both the raw material and HCs were measured in a Parr 1351 Adiabatic Oxygen Bomb Calorimeter (norm ISO 1928) according to the technical specification CEN/TS/14918, fitted with continuous temperature recording. Before the HHV analysis, samples of 0.4–0.5 g were dried at 105 °C for 24 h.
2.5.3. Textural characterization
Nitrogen adsorption isotherms at 77 K were generated by Autosorb equipment (Quantachrome). Before analyses, the selected samples were outgassed at 250 °C for 12 h. The apparent Brunauer–Emmett–Teller (BET) surface area SBET (m2⋅g−1) was estimated using the BET theory. The t-plot method was used for measuring the micropore volume Vmic (cm3⋅g−1) and the external surface SEXT (m2⋅g−1). The BJH method was used for calculating the mesopore and total pore volume (Vme and Vt, cm3⋅g−1, respectively).
2.5.4. Surface morphology
The surface morphology of HCs was determined via scanning electron microscopy (SEM, Quanta 3D FEG, FEI). The samples were prepared by depositing about 50 mg of the sample on an aluminum (Al) stud covered with conductive adhesive carbon tape and then coated with Rh–Pd for 1 min to prevent charging during observations. Imaging was performed under high-vacuum conditions (<6 × 10⁻⁴ Pa) at an accelerating voltage of 30 kV using secondary electrons for high vacuum [22].
2.5.5. X-ray diffraction
An X-ray diffraction (XRD) apparatus was used to study the structure of the obtained materials and identify the crystalline phases present in the prepared materials. Analyses were carried out using a Cu K radiation source operating at a voltage of 40 kV. The diffraction angle (2Θ) was changed from 5 to 90° for HC and activated HC.
2.5.6. Surface chemistry
Functional group spectra of selected samples were investigated using a Fourier transform infrared (FTIR) spectrometer. The FTIR absorption spectra of the samples were recorded with a Perkin Elmer apparatus (Nicolet iS5) operating in the wavenumber range between 400 and 4000 cm−1. The bands were assigned using suitable bibliography.
3. Results and discussion
3.1. Fuel characteristics of HCs
Ultimate analysis, moisture and ash contents, HHV, and SY were determined for the two raw materials (DPP and PNS) and their corresponding HCs prepared at different SWRs. The results are presented in Table 2.
Ultimate analysis and HHV of raw materials and their corresponding HCs
| Precursor | %C | %H | %O∗ | %N | O/C | H/C | Moisture (%) | Ash (%) | HHV (MJ/kg) | SY (%) |
|---|---|---|---|---|---|---|---|---|---|---|
| DPP | 47.2 | 7.22 | 44.55 | 1.02 | 0.71 | 1.83 | 13.88 | 1.15 | 19.91 | - |
| HC-DPP-1:8 | 71.2 | 5.61 | 21.34 | 1.84 | 0.22 | 0.95 | 4.40 | 0.42 | 28.21 | 39.46 |
| HC-DPP-1:12 | 69.2 | 6.07 | 22.86 | 1.87 | 0.24 | 1.05 | 3.60 | 0.55 | 28.73 | 38.20 |
| HC-DPP-1:48 | 70.4 | 6.46 | 21.26 | 1.88 | 0.22 | 1.10 | 3.00 | 0.63 | 29.77 | 37.20 |
| PNS | 50.9 | 6.14 | 42.71 | 0.23 | 0.63 | 1.45 | 9.95 | 1.68 | 20.24 | - |
| HC-PNS-1:8 | 70.3 | 5.00 | 24.28 | 0.41 | 0.26 | 0.85 | 3.00 | 1.33 | 26.54 | 48.8 |
| HC-PNS-1:12 | 67.7 | 5.40 | 26.48 | 0.42 | 0.29 | 0.95 | 2.30 | 1.29 | 26.84 | 46.34 |
| HC-PNS-1:48 | 68.4 | 5.25 | 25.94 | 0.41 | 0.28 | 0.92 | 3.00 | 1.21 | 27.32 | 42.4 |
Compared to raw materials, all HCs showed higher carbon and nitrogen contents and lower oxygen (%O) and hydrogen (%H) contents. In the precursors, H and O were removed in the form of H2O and CO2 due to reactions of dehydration and decarboxylation, respectively, during HTC [14]. The carbon enrichment was related to the decrease in the other elements (especially O) and to the aromatization during HTC [26]. The change in carbon contents from the biomass to HC products was more pronounced for DPP than PNS. The elemental analysis showed that the increase in carbon contents was greater for HC produced from DPP with a percentage increase equal to 50% while that of PNS HC was equal to 30%. The oxygen and hydrogen contents decreased by 52% and 22%, respectively, for DPP, whereas for PNS, the decrease was less significant with percentages that did not exceed 43% and 18%, respectively. This behavior can be explained by the distinct original composition of the biomass samples. Previous studies proved that the type of biomass significantly affects the chemical composition of the obtained HC [3, 25]. This finding is supported by our investigation, and could be explained by the specific reactivity in dehydration and decarboxylation reactions of each biomass [14]. Moreover, the differences in the type and concentration of degradation fragments may affect the extent of recombination processes and the formation of any HC that also accounts for SY and C capture [27].
Decreasing the HTC SWR of both DPP and PNS at the same time and temperature conditions had little effect on the atomic content of the produced HC. For example, C, O, H, and N contents in HC-DPP or -PNS-1:8 and HC-DPP or PNS-1:48 were very similar despite the large difference between the two ratio values, indicating that a sixfold reduction in water consumption generates an equivalent characteristic of HC, with environmental and economic benefits in reducing wastewater discharge and improving carbon yield per unit volume. Si et al. [6] studied the effect of SWR on corn straw HC production and showed that reducing 80% of water consumption produced HCs with the same performance.
Atomic ratios H/C and O/C are significant indicators of aromaticity stability and maturity of HCs [1, 28]. The change in H/C and O/C was evaluated using the Van Krevelen diagram, which crossplots the hydrogen/carbon atomic ratio as a function of oxygen/carbon atomic ratio [1, 12] (Figure 1). The evolution of O/C and H/C ratios reveals the degree of deoxygenation of the precursors obtained through dehydration and decarboxylation [3]. These processes enable the removal of hydrogen and oxygen in the form of H2O and CO2 [3, 29]. As can be seen in Figure 1, the HTC decreases the O/C and H/C atomic ratios of DPP and PNS, and all HCs show comparable values. The Van Krevelen diagram confirms that the hydrothermal process significantly affects the elemental composition of the products. The evolution of the HC O/C and H/C atomic ratios suggests that the removal of oxygen in the form of water through the dehydration process was the primary mechanism for the HTC process. Our results are consistent with previous research indicating that the biomass loses groups, such as carboxyl, hydroxyl, and carbonyl, leading to the breakage of aliphatic side chains and an increase in aromaticity of carbon materials [9].
Van Krevelen diagram of raw materials and their corresponding HCs.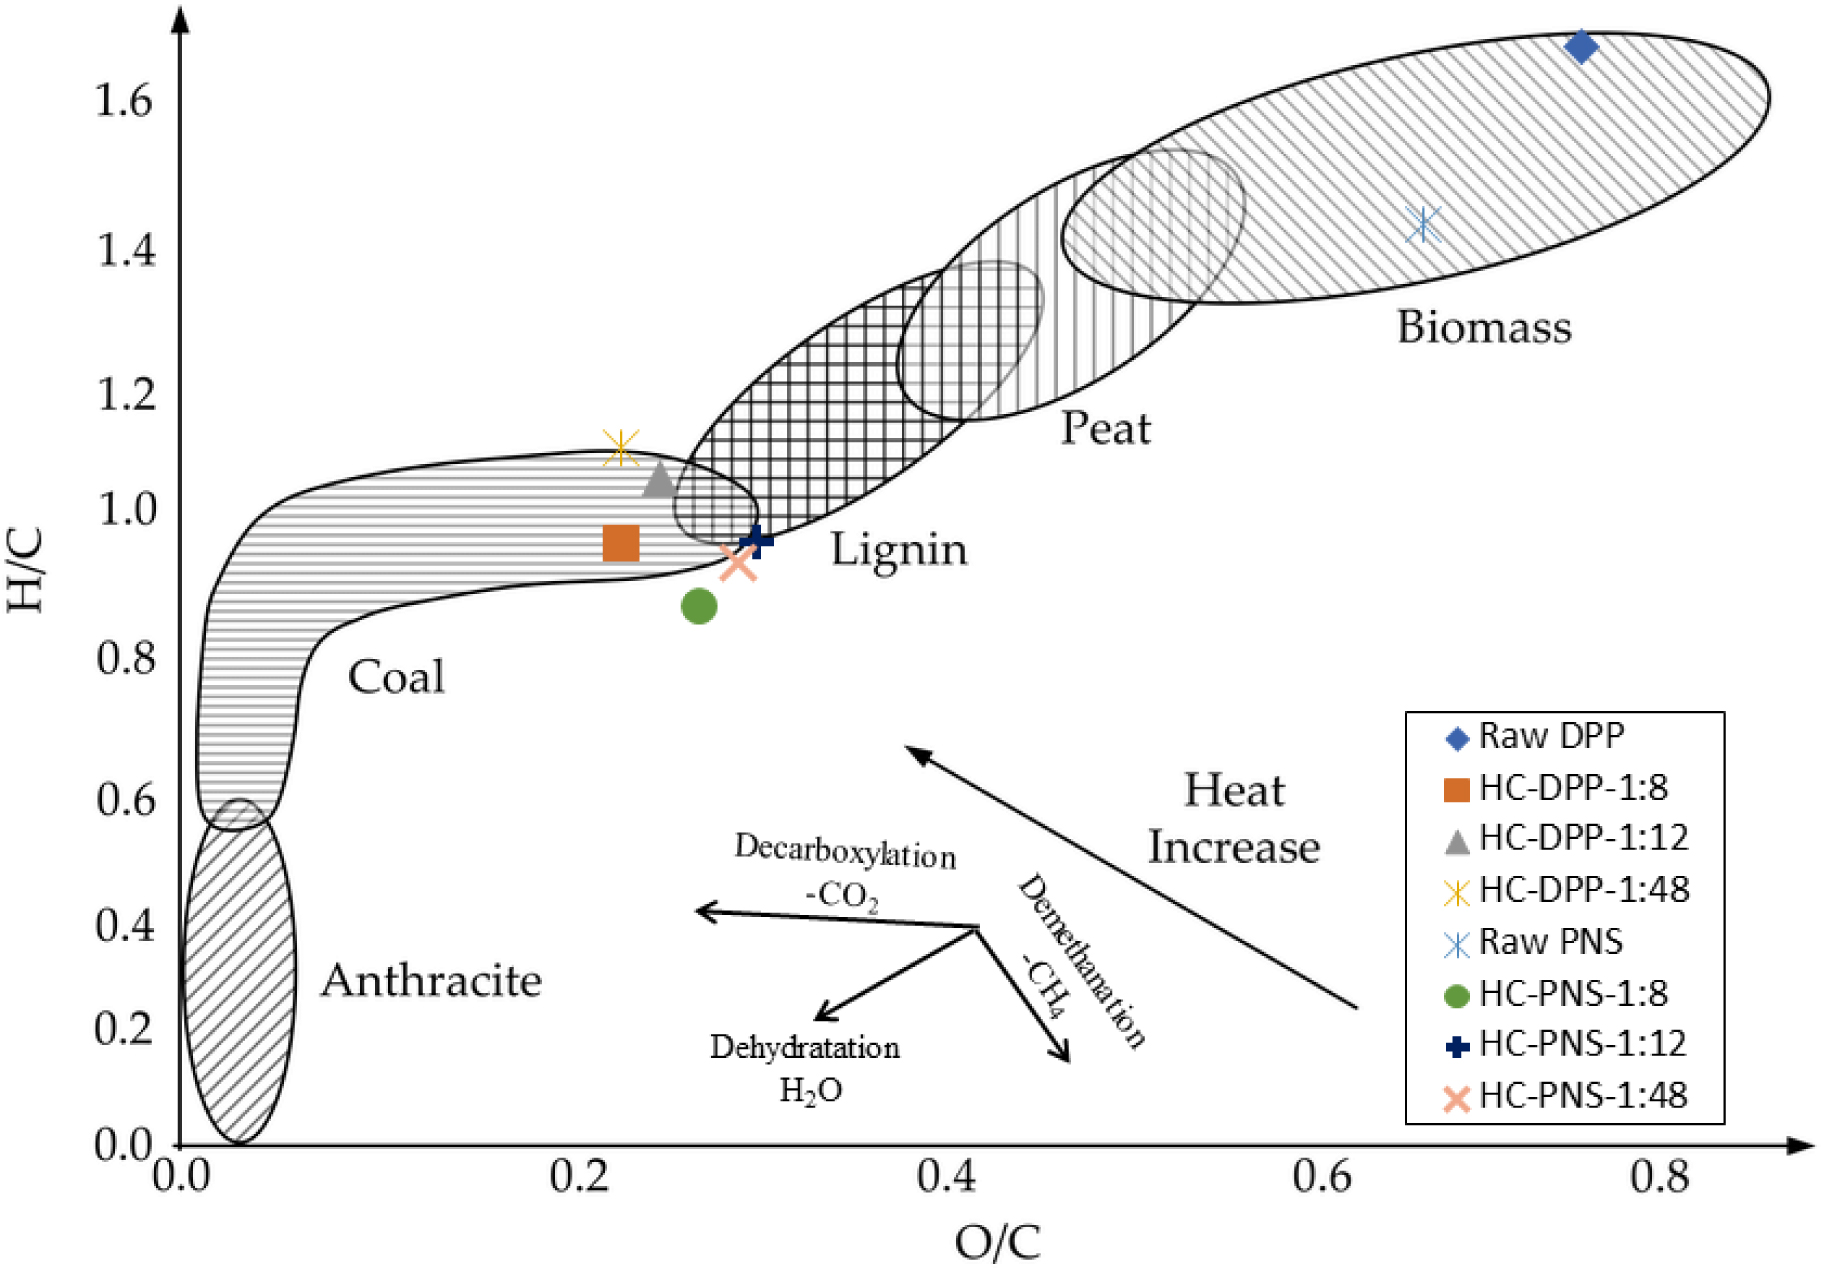
The H/C and O/C ratios of HC-DPP and HC-PNS obtained under different SWRs ranged from 0.95 to 1.1 and 0.22 to 0.24 for HC-DPP and from 0.85 to 0.95 and 0.26 to 0.29 for HC-PNS, respectively. The maximum difference between H/C values was 0.07, and the maximum difference between O/C values was 0.03. The small difference indicates that reducing the SWR will neither significantly affect Van Krevelen ratios nor the HHV. Along these lines, it would be interesting to investigate the thermal stability of these materials as secondary HC contribution could be modified with the SWR.
Compared to the four typical materials (anthracite, bituminous, sub-bituminous, and lignite coal), the H/C and O/C atomic ratios of the obtained HCs were found to be near those of the lignite and sub-bituminous regions [30, 31].
Another obvious effect is the absence of SWR influence on ash proportion in HC as this could have been expected as a result of enhanced demineralization.
On the other hand, the HC HHVs determined (Table 2) were higher than their corresponding raw precursors [14]. Similar results were found by Park et al. [31] and Boutaeib et al. [32] who carbonized algal and pine cone biomass, respectively, and showed that greater heating values were associated with higher fixed carbon content. It is worth noting that all the HCs had heating values as high as bituminous coal [6]. Such results indicate that the prepared HCs have the potential to be used as solid fuels for combustion applications [14, 22].
Additionally, the SY of the HC (Table 2) was unaffected by the SWR. For example, it ranged between 37.2% (SWR 1:48) and 39.46% (SWR 1:8) for HC-DPP while HC-PNS ranged between 42.4% (mass ratio 1:48) and 48.8% (mass ratio 1:8). A more intense effect was observed for the biomass type as related to their distinct composition that influences hydrothermal reactions differently [5, 33].
3.2. HC and activated HC surface properties
3.2.1. Textural properties
The N2 adsorption–desorption isotherms of the activated HC derived from DPP and PNS are shown in Figure 2. The associated textural parameters of HCs and their corresponding activated HCs are illustrated in Table 3. Furthermore, the properties of ACs obtained via steam activation of DPP biochars, as obtained from previous studies, are also reported in Table 3 for comparison purposes.
Nitrogen adsorption–desorption isotherms for activated HC.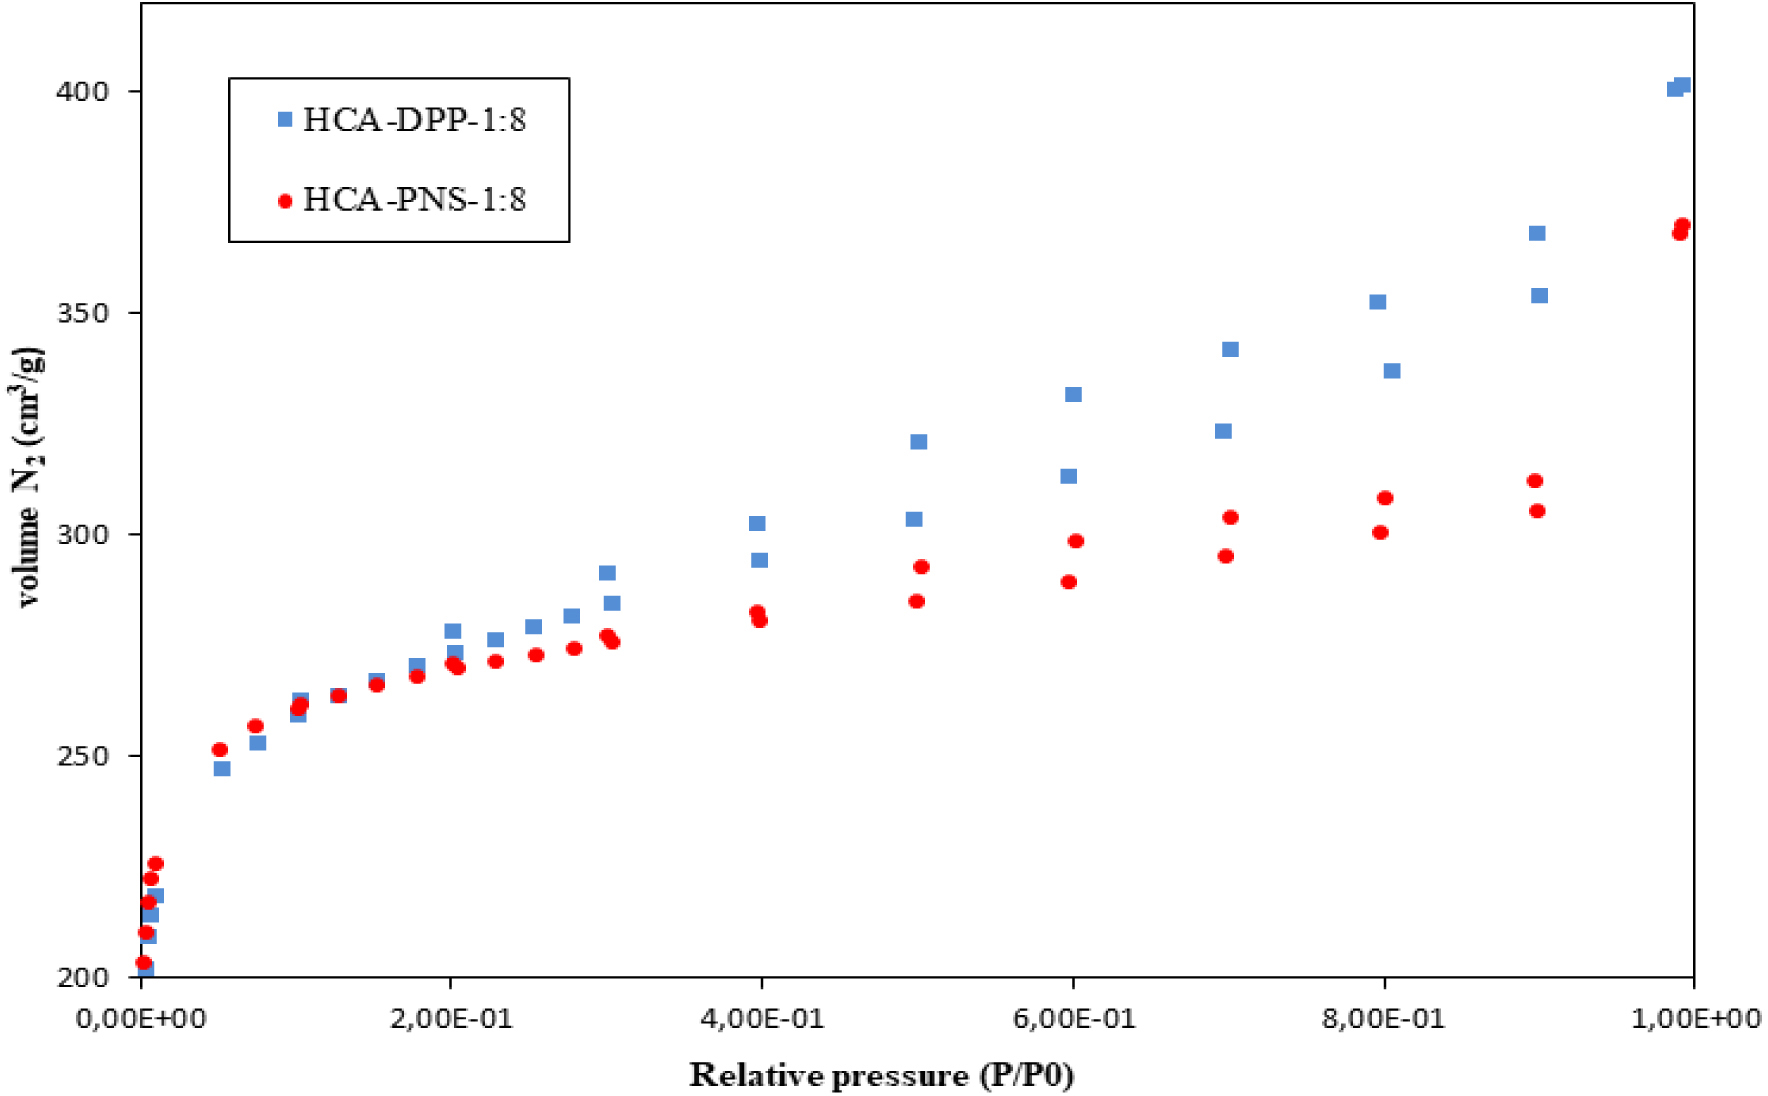
BET surface areas and micro- and mesopore volumes of activated HCs
| Precursor | Sample | BO(%) | SBET (m2/g) | VT (cm3⋅g−1) | Vmicro (cm3⋅g−1) | Vmeso (cm3⋅g−1) |
|---|---|---|---|---|---|---|
| HC-DPP | HC-DPP-1:8 | - | 14.92 | - | - | - |
| HC-DPP-1:12 | - | 16.59 | - | - | - | |
| HC-DPP-1:48 | - | 20.60 | - | - | - | |
| HC-PNS | HC-PNS-1:8 | - | 41.83 | - | ||
| HC-PNS-1:12 | - | 43.12 | - | - | - | |
| HC-PNS-1:48 | - | 47.05 | - | - | - | |
| AC-DPP | HCA-DPP-1:8 | 20.32 | 857.07 | 0.582 | 0.372 | 0.210 |
| BCA-DPP | 52.9 | 524.02 | 0.420 | 0.182 | 0.238 | |
| AC- PNS | HCA-PNS-1:8 | 22.01 | 827.82 | 0.541 | 0.377 | 0.164 |
All HC samples had low BET surface areas (Table 3). Previous studies agree about the low BET surface area of HC and attribute it to pore blockage caused by volatile matter, which fails to reach the liquid phase during the HTC treatment, as well as condensed or repolymerized matter [3, 20, 34].
The BET surface area very slightly increases with decreasing SWR, with values ranging between 14.92 and 20.60 m2⋅g−1 for the HCs derived from DPP and between 41.83 and 47.05 m2⋅g−1 for those from PNS. The oxygen and hydrogen contents decrease for DPP by 52% and 22%, respectively, whereas the decrease for PNS is less significant not exceeding 43% and 18%, respectively.
In contrast, steam-activated HCs exhibit high N2 adsorption (Figure 2). The resulting isotherms have the same shape (type I according to Langmuir classification), which is typical of microporous materials, and have mesopores as indicated by the presence of a hysteresis loop. As can be seen in Table 3, the surface area of the activated HC significantly increases compared to raw HC. The BET surface areas reach quite high values (857 m2/g for DPP and 827 m2/g for PNS). This finding reveals the significant role of the activating agent in porous structure development. These results are consistent with those reported in previous studies. Using potassium oxalate and melamine as activating agents, Sevilla et al. [35] enhanced the pore volume (from 0.7 g/cm3 to 1.6 g/cm3) and SBET (from 1300–1600 m2/g to 1800–3000 m2/g) for the eucalyptus HC. Hsini et al. [36] increased the BET surface area of HC made from prickly pear seed waste from 0.19 to 389 m2/g using CO2 as the activating agent. Furthermore, Liu et al. [34] found activating HCs brought about an improvement in their apparent surface as compared to those of raw HC, with SBET values reaching 367.3 m2/g for corn straw and 142.6 m2/g for corncob. To highlight the significance of HTC before activation, the textural properties of activated biochars were also evaluated (Table 3). As mentioned above, the activated biochar (BCA-DPP) was obtained via steam activation of conventional chars by simple pyrolysis [23]. According to Table 3, the SBET of HCA-DPP-1:8 increased by approximately 63%, and Vmic exhibited an increase of 38% as compared to BCA-DPP under the same activation conditions. The Vmes value remained relatively constant while the Vtot value increased. It could be concluded that HTC before activation highly enhances the porous structure of ACs. These findings are supported by previous works that compared hydrothermal and conventional processes for activated carbon production [3, 14]. Additionally, under the same activation conditions, BCA can reach 50% of burn-off while activated hydrochar only reaches 20% for the two biomasses. The biomass type effect is more pronounced for HC than activated HC. This outcome is consistent with the elemental analysis and HHV results, showing that the type of biomass affects the atomic and energetic properties of HCs. The BET surface area of HC-PNS is larger than that of HC-DPP. However, the SBET values of HCA-DPP and HCA-PNS are similar. This finding is inconsistent with those of previous studies, proving the significant impact of biomass type on textural characteristics of activated HCs [14, 31].
3.2.2. Surface morphology
The SEM images of the produced HC-DPP-1:8, HC-DPP-1:12, HC-DPP 1:48, HC-PNS-1:8, HC-PNS-1:12, and HC-PNS-1:48 are depicted in Figure 3. The SEM images show that the surface of HC presents a large number of carbon microsphere structures.
SEM images of HC-DPP-1:8, HC-DPP-1:12, HC-DPP-1:48, HC-PNS-1:8, HC-PNS-1:12, and HC-PNS-1:48.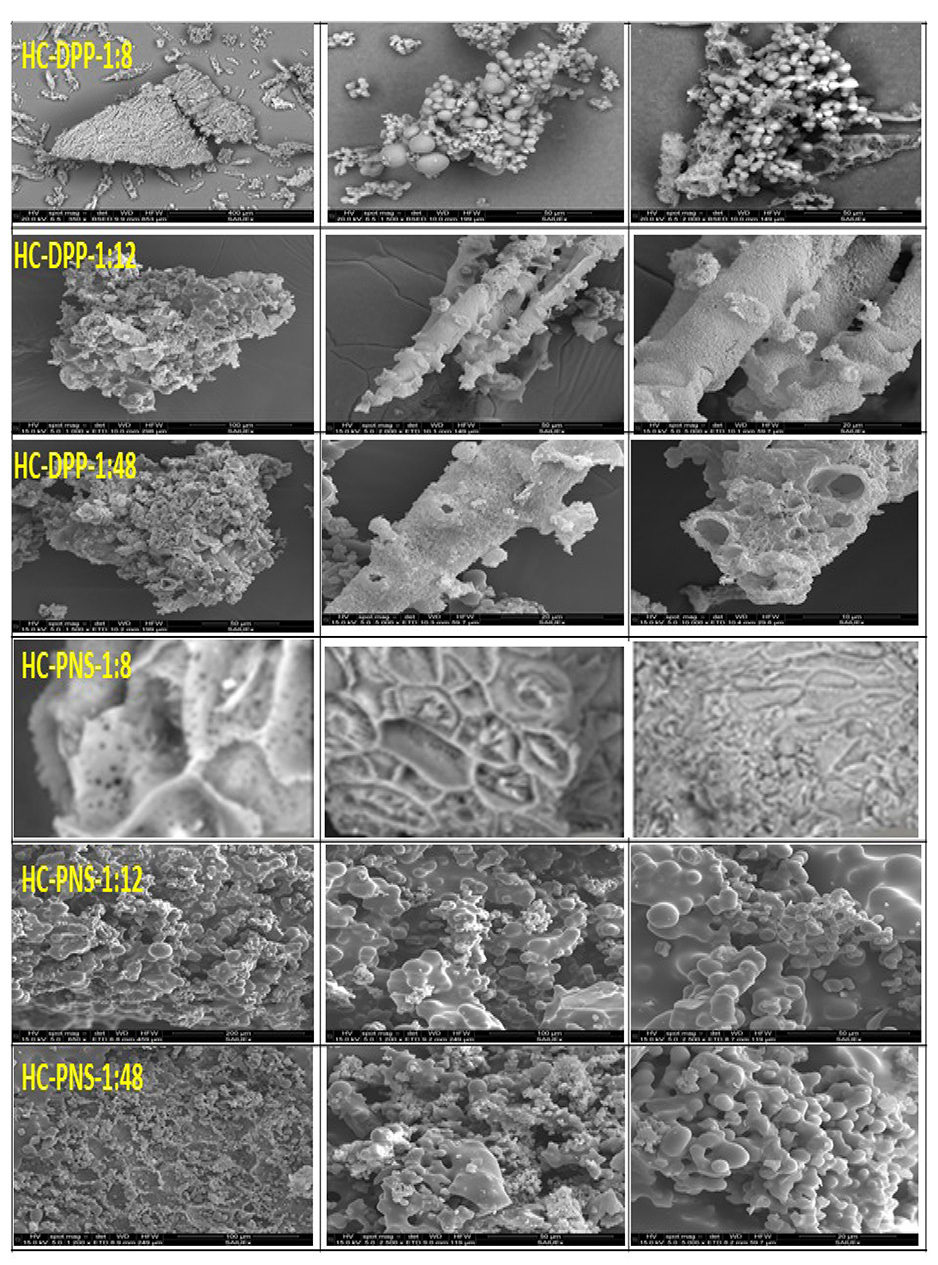
For both precursors, it is observed that most of the spheres of HC-DPP and HC-PNS are grouped confirming that the generated HC spheres have not fully developed into complete individual spheres, and they have a wide range of sizes. Si et al. [6] showed that the type of biomass presents a determining factor in the surface morphology of HC.
Generally, mechanisms of nucleation and growth are often involved in the production of carbon microspheres. When HTC intermediate fragments approach critical saturation concentration, carbon nuclei are produced. The resulting carbon nuclei grow isotopically to eventually produce homogeneous carbon spheres, which is beneficial for producing precursors with high specific surface areas [37], leading us to conclude that our conditions of the hydrothermal process did not reach their optimum [38].
A decrease in SWR from 1:8 to 1:48 leads to the continued development of carbon microspheres. This finding could be attributed to the nucleation and generation of extended concentrations. Si et al. [6] demonstrated that the lower the SWR, the better the microsphere development. They also proved that the surface is relatively smooth for an SWR of 1:1 [6]. In our case, it seems that a lower SWR also corresponds to a better isolation of these spheres, which is seen for both feedstocks in the case of the 1:8 ratio. This might suggest that because the concentration of degradation fragments is lower, the spheres do not fuse with the other spheres. In a previous work, it was postulated that spheres are placed in layers; in this work, it seems that for larger concentrations they fuse [27]. This in turn corresponds to images where spheres allow a better identification of the cellular structure of the parent material that is especially unique to PNS.
A bursting of specific spheres is detected for HC-DPP-1:48 (Figure 3). However, the microspheres of HC-PNS-1:48 retain their form. This finding could be linked to biomass structure given that the particles that are most likely produced from the transformation of cellulosic fractions maintain their cellular structure. Generally, the development of spherical particles is commonly related to the lignocellulosic nature of precursors that contain lignin, cellulose, and hemicellulose [1, 12]. These carbohydrate polymers are composed of monosaccharides, hexose, and acidic polysaccharides. Therefore, during the HTC process, these basic units form microspherical particles via dehydration, decarboxylation, condensation, and polymerization reactions [33].
3.2.3. XRD analysis
The XRD patterns are essential for evaluating the carbon accumulation state. Figure 4 illustrates the XRD spectra of the HCs and their corresponding activated DPP and PNS HCs. The spectra of HCs show a diffraction peak at 2Θ ∼ 22°, indicating stable cellulose and lignin phase structures, which suggests that the degradation of organic components during the HTC process was incomplete [3].
XRD spectra of HC and the corresponding activated HCs of (a) DPP and (b) PNS.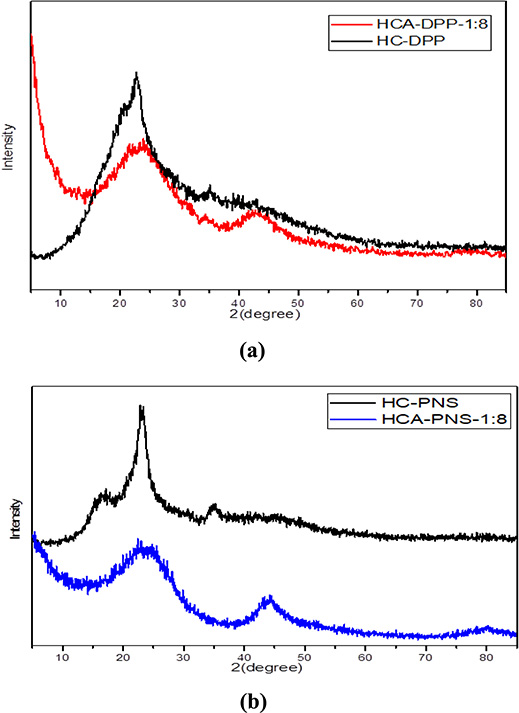
The spectra of HCA-DPP and HCA-PNS exhibit two asymmetric peaks corresponding to 2Θ ∼ 24° and 2Θ ∼ 43°. Following HC activation, the amorphous carbon peak changed from 2Θ ∼ 22° to 24° as the aromatization degree increased, confirming the rearrangement reaction of carbon subsequent to cellulose and lignin degradation [4]. The diffraction peak at 2Θ ∼ 43 reveals the amorphous structure of the precursor and indicates the aromatization degree [39]. The results illustrate the evolution of disordered carbon from hydrothermal carbonization to the activation process.
3.2.4. FTIR analysis
The FTIR spectra of raw materials, HC, and activated HC are pictured in Figure 5a, b, and c. As can be seen in Figure 5a, the raw DPP and their corresponding HCs present the same absorption bands with a higher intensity compared to HC. The FTIR analysis of all samples reveals a distinctive absorption band observed between 3393 and 3438 cm−1, associated with the vibration of –OH groups present in carboxylic and hydroxyl groups [3, 15]. The two peaks detected between 2849 and 2927 cm−1 mainly result from the C–H stretching vibrations of aliphatic molecules from the cellulose-hydrolyzed oligomers [3, 33]. A peak is discernible between 1710 and 1749 cm−1, corresponding to the vibrations of the C=O bonds due to the carboxyl group of the cellulose [40]. Additionally, the spectrum exhibits almost a peak at 1606 cm−1 primarily due to C=C bond stretching vibrations. Several peaks between 1445 and 1470 cm−1 are mostly attributed to the stretching C=N bond [40].
FTIR analysis of (a) HC-DPP, (b) HC-PNS, and (c) activated HC (HCA-DPP-1:8 and HCA-PNS-1:8).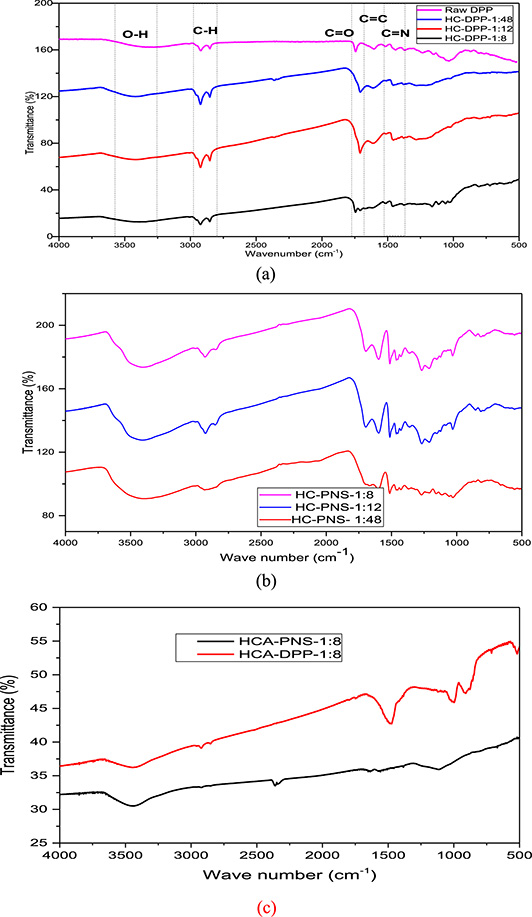
The peak at 1030 cm−1 attributed to C–O bond stretching vibration in cellulose and hemicellulose [15] appeared only for the raw precursors. The disappearance of the C–O group from the HC surface demonstrated that the hemicellulose was degraded. This result was already verified by elemental analysis (Table 2) and by fast hemicellulose hydrolysis [14].
By investigating the impact of solid/water variation, the spectra of HC-DPP-1:12 and HC-DPP-1:48 show the disappearance of peaks between 1000 and 1100 cm−1 observed in HC-DPP-1:8 and assigned to C–O bond stretching vibration in cellulose and hemicellulose. Regarding PNS HCs (Figure 5b), the spectrum of HC-PNS-1:48 shows the absence of the peak at 830 cm−1 already observed for HC-PNS-1:8 and HC-PNS-1:12 and ascribed to the aromatic ring’s out-of-plane C–H bond bending. The intensity of peaks at 1602 and 1705 cm−1 attributed to the vibrations of the C=O bonds and C=C bond stretching vibrations, respectively, significantly decreases for HC-PNS-1:48.
The FTIR results showed that the HC still contained most of the ether functional groups under these hydrothermal conditions and the variation in SWR is not very noticeable.
Most functional groups have disappeared for activated HCs (Figure 5c). It may produce carbon-containing gas, which would increase the organic matter’s condensation and show that the lignin structure was degraded under the activation process [4]. This behavior may be attributed to the high activation temperature (850 °C); only the most stable groups are conserved at this temperature [41, 42]. The FTIR spectrum shows only an absorption band at 3490 cm−1 related to O–H vibration and a weak band around 1126 cm−1 for HCA-DPP with a lower intensity than the HC, which is attributed to the vibration of C–O bonds in lactones, epoxides, and ether structures [43]. The HCA-PNS spectrum exhibits additional peaks at 1500, 1089, and 890 cm−1, which are absent for HCA-DPP. Tu et al. [4] attributed the band at 1500 cm−1 to a C=C polyaromatic bond, which further improved aromaticity for activated HC. Saputra et al. [43] related the peak between 1109–1114 cm−1 with a high intensity to the C–O group and the peak between 871–873 cm−1 to C–H alkene groups.
4. Batch adsorption test
Adsorption isotherms describe the equilibrium and interaction of the adsorbate and adsorbent. Equilibrium occurs when the adsorbate concentration in the solution is in dynamic equilibrium with the adsorbent concentration. The isotherm adsorption constants indicate the affinity of the activated HC adsorbent surface characteristics for DCF.
Figure 6 presents experimental adsorption isotherms of DCF onto HCA-PNS-1:8 and HCA-DPP-1:8 and a comparison between isotherm models Langmuir, Freundlich, and Temkin described by Equations (4)–(6).
Adsorption isotherms of DCF on activated HC adsorbents: HCA-PNS-1:8 and HCA-DPP-1:8 at temperature 25 °C.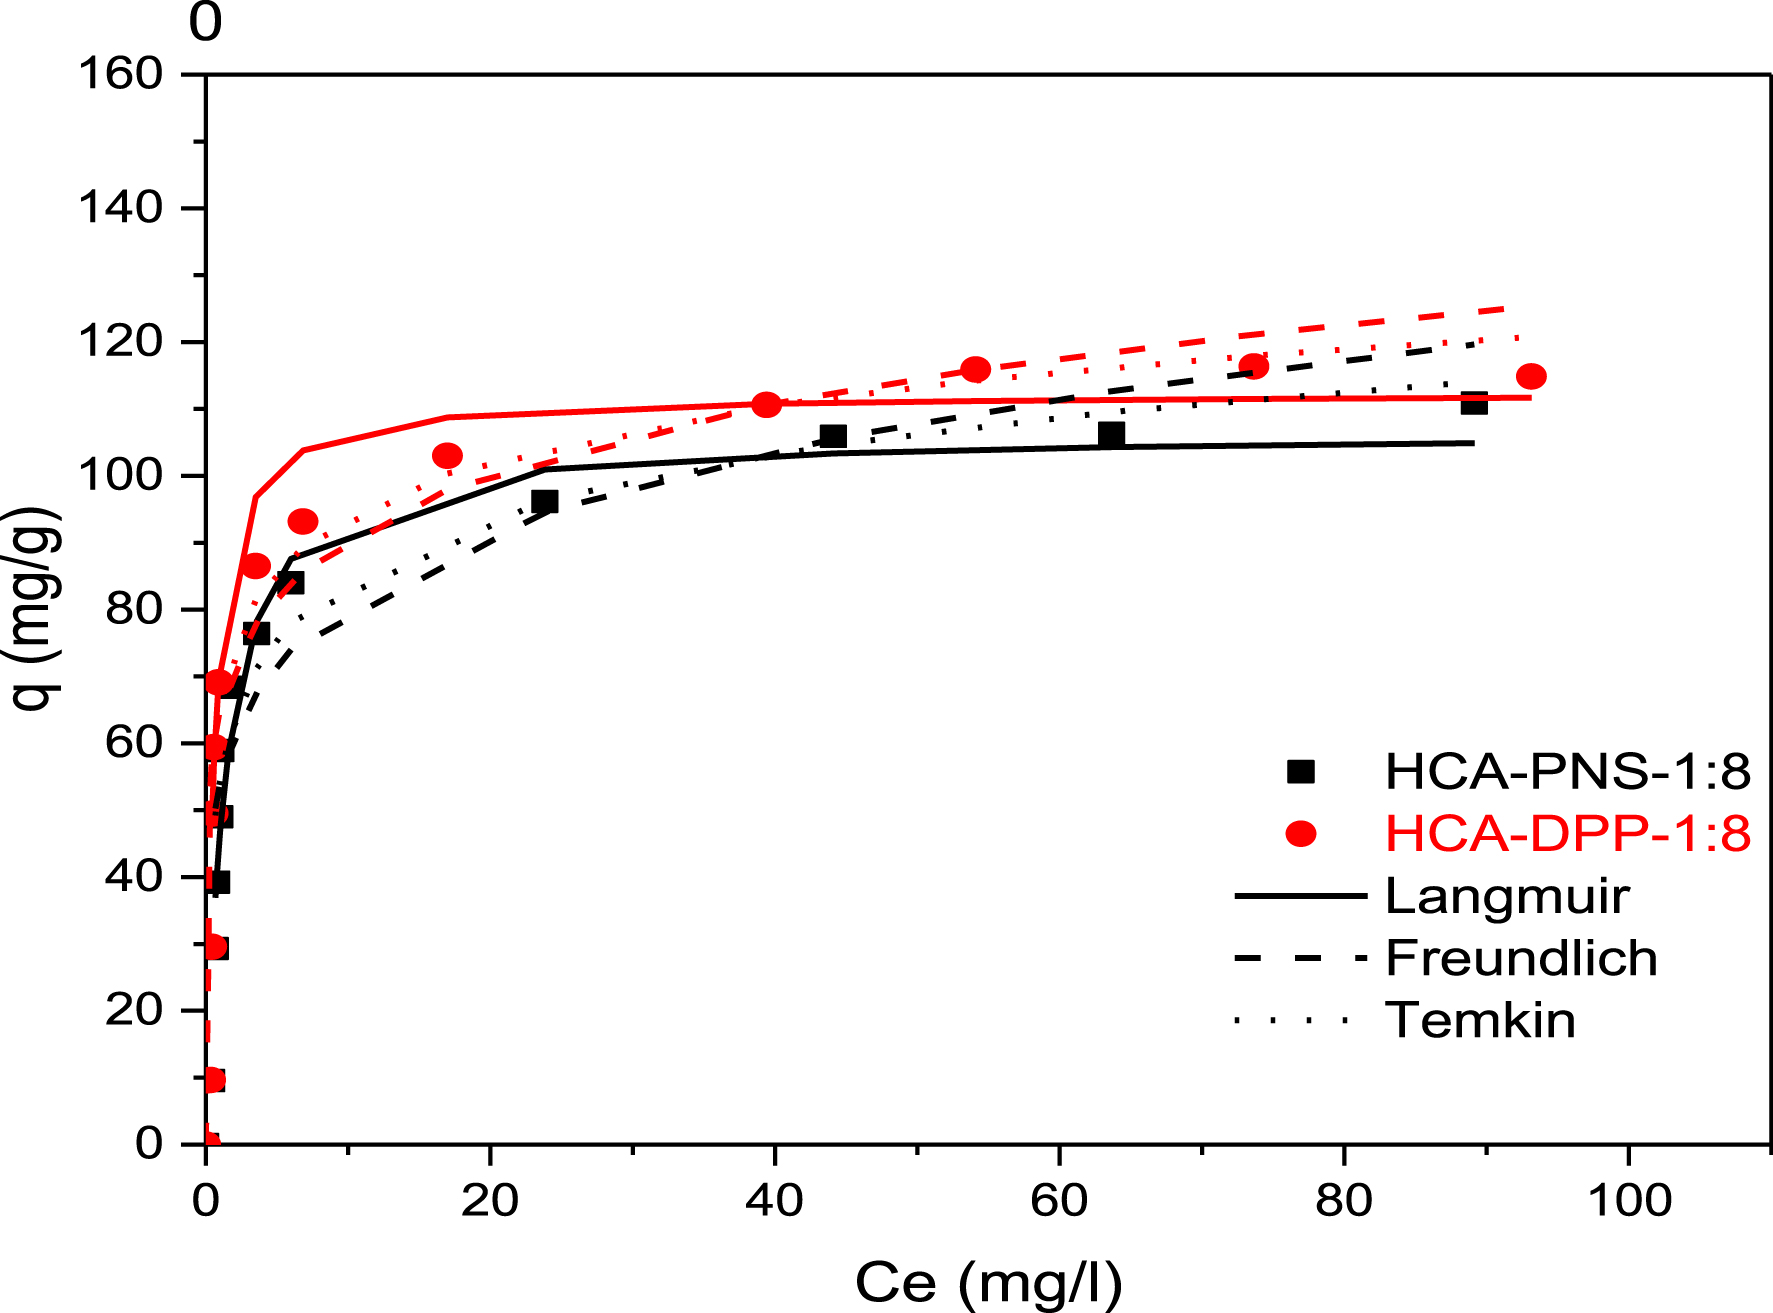
The plots of experimental data show that the two isotherms have a similar shape. According to the Giles classification, the obtained adsorption isotherms are of type H (high affinity), indicating that the quantity adsorbed increases with equilibrium concentration. The amount of DCF adsorbed increases from 9.57 to 110.84 mg/g for HCA-PNS-1:8 and from 9.64 to 110.58 mg/g for HCA-DPP-1:8. The DCF amounts adsorbed by HCA-DPP-1:8 are slightly more than that adsorbed by HCA-PNS-1:8, which is in agreement with the textural properties already found for these produced activated hydrochars.
By comparing the regression coefficients R2 from Table 4 and from the plotted isotherm model curves shown in Figure 6, the DCF adsorption on two activated HCs in this study is best fitted to the Langmuir model. The regression coefficient is R2 = 0.99 and the maximal adsorption capacity of the Langmuir model is 112.359 mg/g for HCA-DPP-1:8. The Freundlich model is the least fitted model to experimental data as it diverges from the experimental data at higher DCF concentrations.
Langmuir, Freundlich, and Temkin isotherm model constants for DCF adsorption on activated HC
| Langmuir | qmax (mg/g) | KL | R2 | |
| HCA-PNS-1:8 | 106.383 | 0.777 | 0.991 | |
| HCA-DPP-1:8 | 112.359 | 1.769 | 0.971 | |
| Freundlich | Kf | 1/n | R2 | |
| HCA-PNS-1:8 | 53.801 | 0.178 | 0.864 | |
| HCA-DPP-1:8 | 64.955 | 0.145 | 0.922 | |
| Temkin | B | AT | R2 | |
| HCA-PNS-1:8 | 13.309 | 59.013 | 0.944 | |
| HCA-DPP-1:8 | 12.010 | 250.276 | 0.967 |
5. Conclusions
Date palm pits and pine nut shells were hydrothermally carbonized at 250 °C for 90 min for different SWRs of 1:8, 1:12, and 1:48. All HCs have high carbon contents, high SYs (near 40%) and HHV, and low ash contents. HC-DPP-1:48 presents the highest HHV with a value of 29.7 MJ/kg and a low ash content of 0.63%. Surface properties were evaluated through SEM images, BET analysis, and FTIR spectra. HCs show a large number of carbon microsphere structures, a significant number of oxygen groups, and a low BET surface area. The effect of biomass type on HC properties was more pronounced than that of SWR evolution, which was very slight for the properties evaluated. Steam activation of HCs for 1 h at 850 °C led to high BET surface areas, reaching 857 m2/g and 827 m2/g for HCA-DPP-1:8 and HCA-PNS-1:8, respectively. Activated biochars prepared under the same activation conditions had a BET surface area of 524 m2/g. These outcomes demonstrate the role of HTC prior to activation. The fuel qualities of HCs and the textural characteristics of activated HCs produced from DPP are better than those derived from PNS.
Nomenclature
| HC | hydrochar |
| HTC | hydrothermal carbonization |
| DPP | date palm pit |
| HC-DPP | hydrochar from date palm pit |
| HCA-DPP | activated hydrochar of date palm pit |
| BCA-DPP | activated biochar of date palm pit |
| PNS | pin nut shell |
| HC-PNS | hydrochar from pine nut shell |
| HCA-PNS | activated hydrochar of pine nut shell |
| SY | solid yield |
| SWR | solid/water ratio |
| DCF | diclofenac sodium salt |
Declaration of interests
The authors do not work for, advise, own shares in, or receive funds from any organization that could benefit from this article, and have declared no affiliations other than their research organizations.
Acknowledgment
The authors are grateful to Agencia Española de Investigación for financial help through project (PID2020-116144RB-I00/AEI/10.13039/501100011033) to the Servicios de Apoyo a la Investigación de la UEX (SAIUEX) for their support on characterization analysis.