


 CC-BY 4.0
1. Introduction
Over the past two decades, nanoscience has undergone explosive growth with miniaturization becoming increasingly important in fields such as computing, sensing, and biomedicine. This tendency is expected to significantly improve the already excellent reputation of nanotechnology. To advance these domains, it is crucial to be able to successfully synthesize nanoparticles of different materials, sizes, and forms and to put them together into intricate structures [1, 2, 3]. The unique structural properties of nanoparticles have recently led to a wide range of applications. Meanwhile, scientists are concentrating on materials with superior physicochemical properties that make them more appropriate for nanoscience and technology. Graphene and its polymer nanocomposites are among these materials that have had a major influence on nanoscience and hence on contemporary technology and scientific study. Because of its numerous beneficial qualities, scientists and engineers have long been fascinated by carbon. Graphene, a unique form of carbon, consists of a two-dimensional arrangement of sp2-bonded carbon atoms in a hexagonal lattice [4]. The remarkable surface area, mechanical strength, photocatalytic qualities, electrical and thermal conductivity, and antibacterial properties of graphene oxide (GO) make it a very sought-after material [5]. Known for its honeycomb structure of nanoscale sheets of sp2 carbon atoms, GO exhibits impressive molecular barrier capabilities, electrical conductivity, and mechanical strength among other advantageous features. Because of these characteristics, several research projects have focused on creating polymer-based nanocomposites that include graphene [6]. Graphene oxide’s versatility extends to its role in composite materials, where it improves properties such as lubrication, thermal conductivity, and mechanical strength [7].
As environmental concerns grow, there is increasing interest in biopolymer mixtures and nanocomposites as sustainable alternatives [8]. In several industries such as packaging, agriculture, and medicine, biopolymers made from renewable resources have more advantages than their petroleum-based equivalents [9]. Recently, there has been a lot of interest in GO as a possible component for 2D nanomaterials that resemble graphene. Graphene oxide typically has a carbon-to-oxygen atomic ratio of between 2:1 and 3:1 and comprises a carbon framework modified with residual oxygen-containing groups. These materials exhibit unique chemical and physical properties, including high electrical conductivity, a tunable degree of functionalization, and a large surface area, making them attractive for various applications [10, 11]. The improvement of GO preparation methods and the exploration of its potential applications have been the focus of extensive experimental research.
Recently, there has been a surge in research on nanocomposites that integrate GO with polymers and inorganic nanoparticles [12]. For instance, red seaweed is the source of carrageenan, a biopolymer with special qualities for a range of uses. Kappa-carrageenan (KC) is a common thickening agent in the food industry because of its gelling properties [13]. Its counterpart iota-carrageenan (IC) is a water-soluble, biodegradable polymer, making it suitable for a variety of applications including as a host matrix in this study. The synergy between inorganic components and organic polymers is driving innovation in materials science. The mechanical, thermal, and electrical properties of graphene-based polymer nanocomposites are better than those of new polymers and traditional filler-based composites [14]. Because of their many uses, GO and polymer composites have attracted a lot of interest from a variety of industries, such as high-strength materials, catalysts, energy-related systems, and energy storage and conversion devices. Revolutionary breakthroughs in materials science and technology are anticipated because of the exceptional qualities of GO and the adaptability of polymer matrices [15].
This study aims to synthesize and evaluate novel biopolymer composite (bioC)–GO nanocomposites by incorporating a mixture of fish scale powder, KC, and IC into GO. The research explores the potential of these materials to develop advanced composites with enhanced thermal and electrical properties, such as resistivity, heat stability, and breakdown strength. To the best of our knowledge, this is the first time this unique combination of biopolymers and GO has been utilized, offering promising insights into the development of multifunctional materials for diverse applications.
2. Materials and methods
2.1. Preparation of fish scale powder
Biowaste Tilapia fish scales (FS) were sourced from the local fish market in Riyadh, Saudi Arabia. The scales were thoroughly cleaned, first being rinsed with tap water to get rid of any surface dirt and tissues that could have stuck. The cleanliness of the scales was then guaranteed by carefully removing any unnecessary elements. After that, the scales were carefully cleaned with deionized water to get rid of any remaining contaminants. The cleaned fish scales were sun-dried until they were crisp and brittle to maintain quality and avoid microbial contamination. To improve use, the scales were coarsely crushed into a powder after drying. To guarantee uniformity of the finished product, the powdered fish scales were then sieved to remove big particles and obtain consistent particle size. Then, 15–50 ml of a boiling mixture of ethanol and deionized water (1:9 v/v) was used to dissolve 30–75 mg of finely powdered fish scales. The mixture was stored at 4 °C until it was needed again, guaranteeing its preservation and preparedness for further research.
2.2. Preparation of bioC–GO nanocomposites
We procured GO, KC, and IC from Sigma-Aldrich for our experimental investigations. Fish scale powder (30 mg) from biowaste sources was dissolved in boiling ethanol and deionized water. Then, 100 mg of IC and 30 mg of KC were combined with 20 ml of the biowaste solution, and the combination of bioC was stirred constantly for 3 h at around 70 °C. A digital sonicator fitted with a 10 mm diameter probe was used to treat the final solution, known as bioC–GO, to guarantee complete homogeneity of the bioC solution and GO dispersions (150 mg). The sonicator was programmed to run in pulse mode at a frequency of 20 kHz and an ultrasonic output of 750 W. To keep the level of the solutions constant during the sonication procedure, the sample beakers were carefully positioned in a water bath. After sonicating the solutions, we dried them for 24 h at 35 °C using the evaporative-casting procedure. The mixes were then transferred to Petri dishes. This procedure made it easier for the solutions to form films (see Figure 1), which allowed for more research and testing.
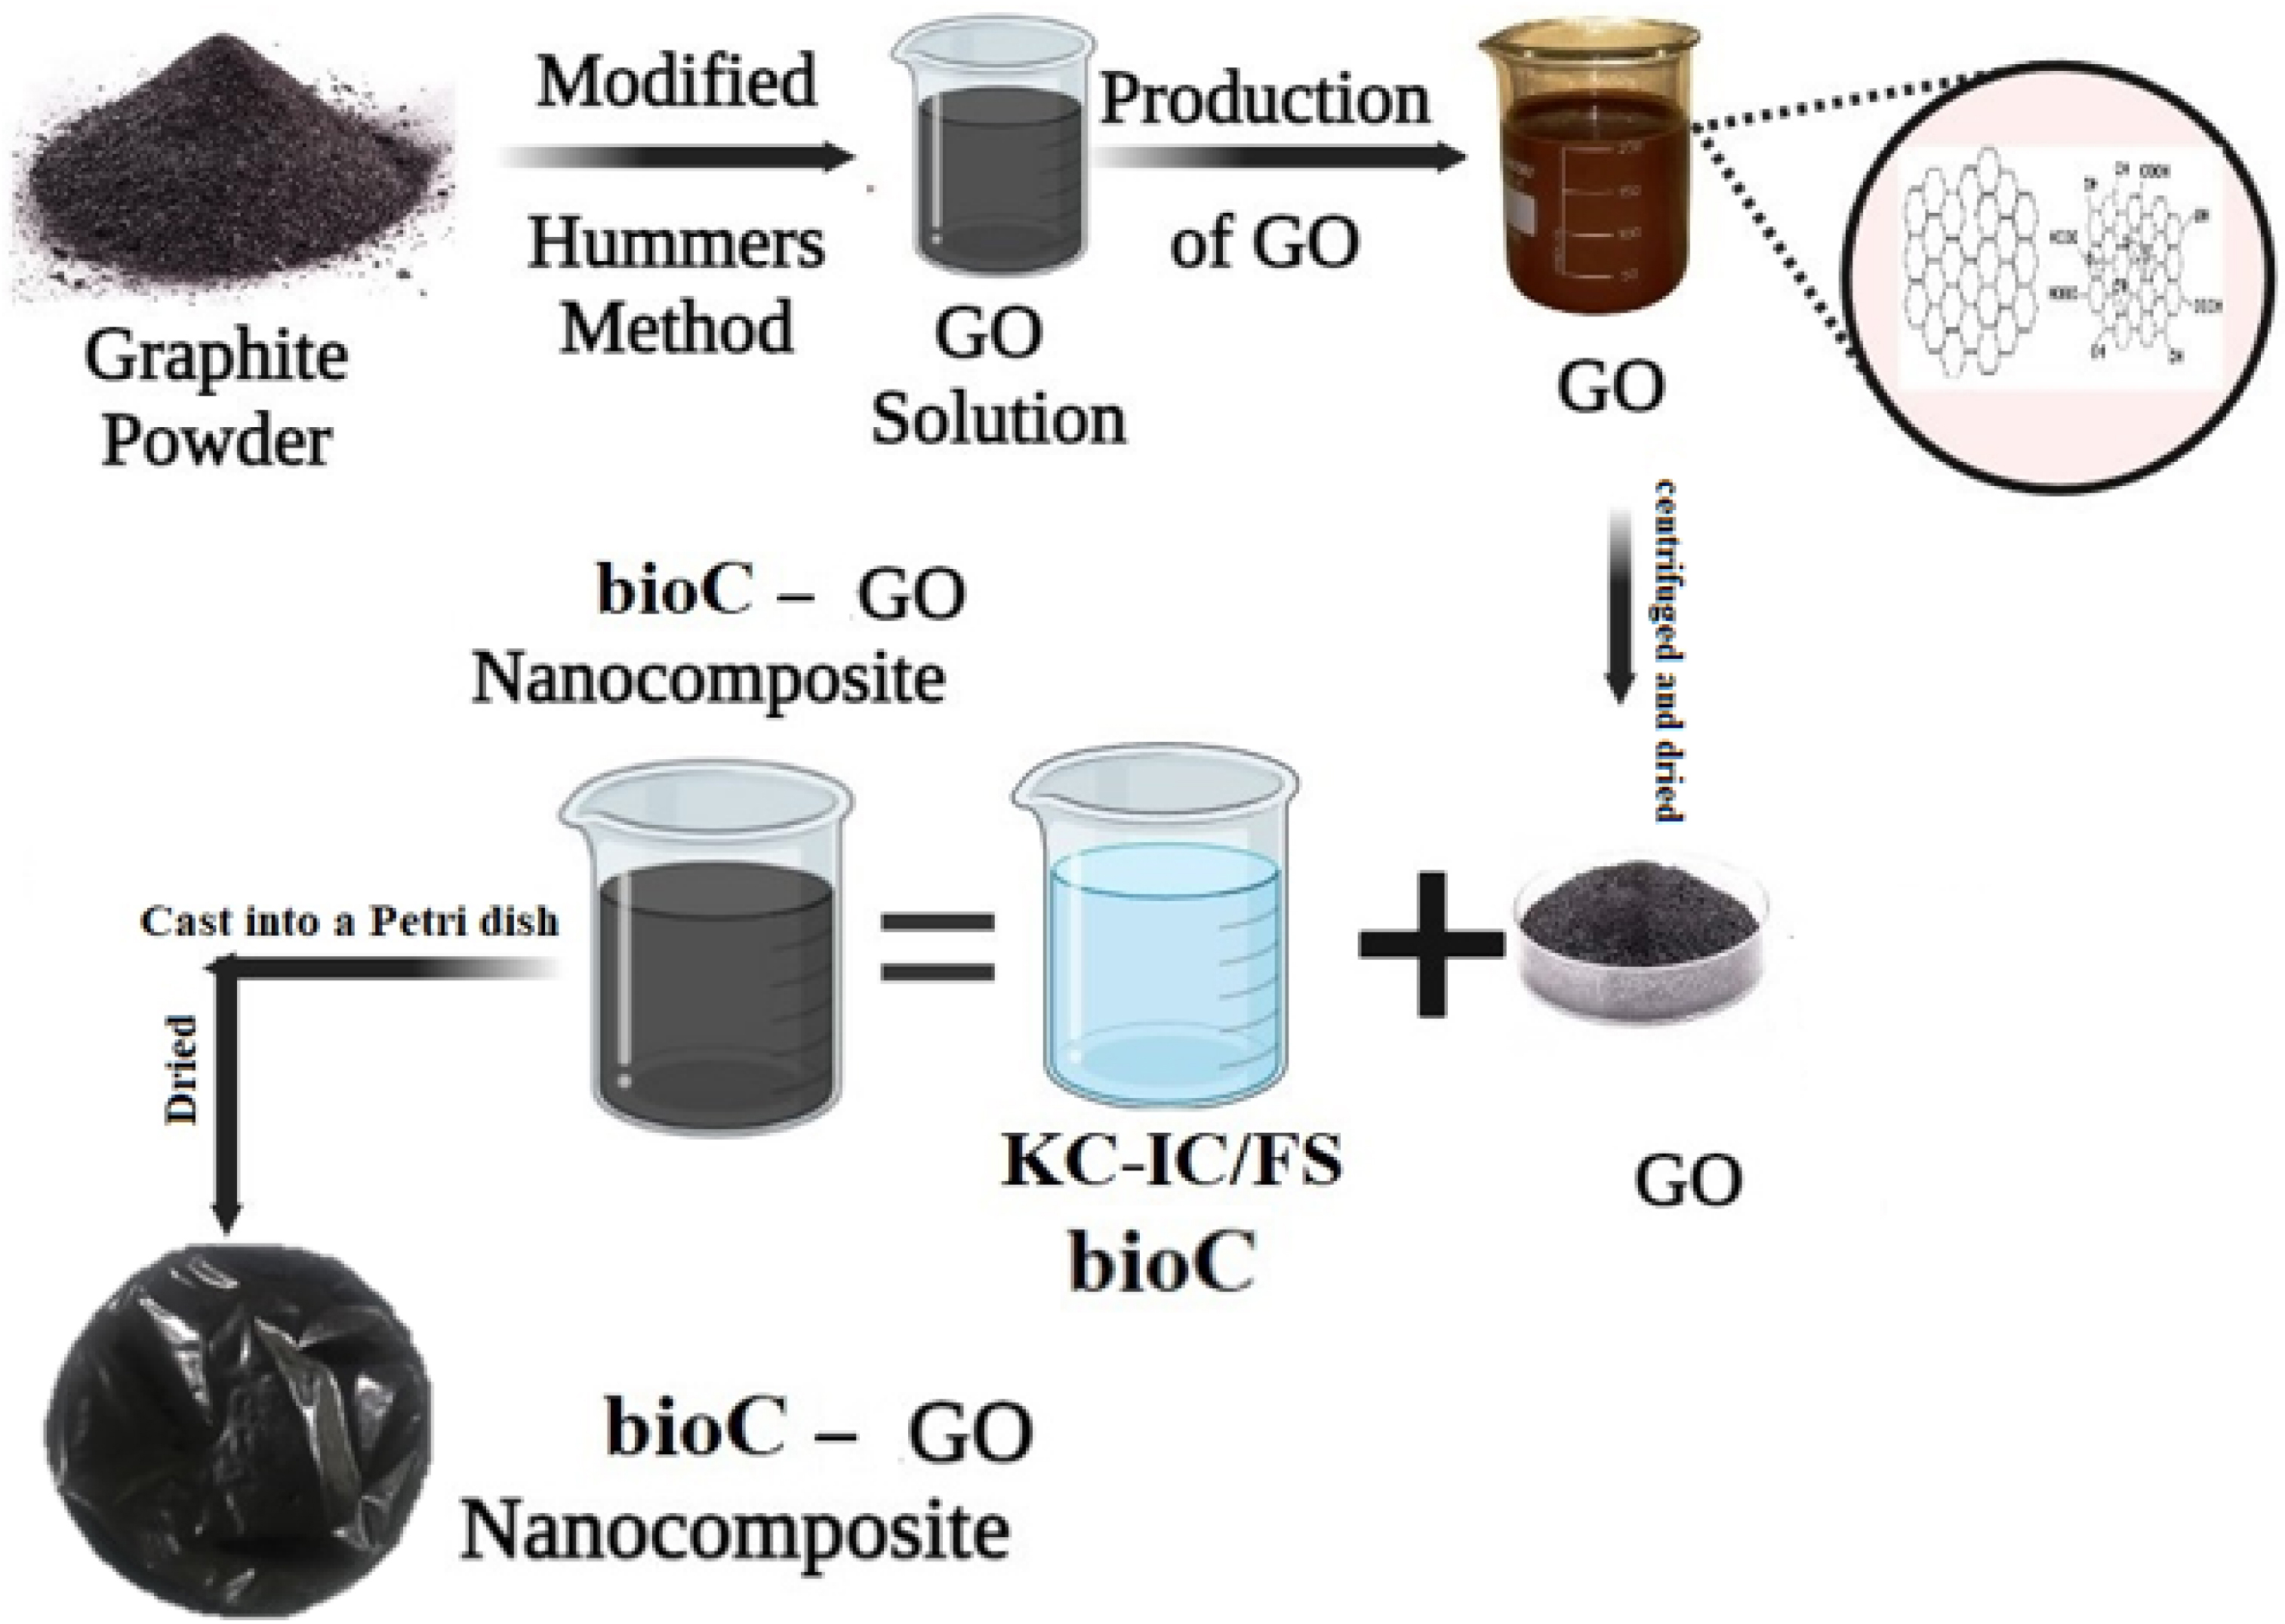
Schematic illustration of the synthesis process of bioC–GO nanocomposites.
2.3. Characterization techniques
The properties of the synthesized bioC and bioC–GO nanocomposites were investigated using a range of characterization techniques. Using a Bruker D8 Discover X-ray diffractometer (Billerica, Massachusetts, USA), the crystalline structure and phase purity were examined throughout a scanning range of 1°–100°. An energy-dispersive X-ray spectroscopy (EDS) spectrometer (JSM-2100F, JEOL, USA) and a scanning electron microscope (JSM-7600F, JEOL, USA) were used for morphological and elemental investigations. A drop of the sonicated bioC–GO solution was applied to a carbon-coated conductive tape for scanning electron microscopy (SEM) and EDS measurements, and it was let to dry under a light before examination. A thermogravimetric analysis (TGA) (TGA/DSC 1) analyzer (Mettler Toledo, Columbus, USA) was used to evaluate thermal stability and breakdown. Nitrogen flow at a rate of 10 °C/min was used to evaluate around 10 mg of the dried produced film throughout a temperature range of 0–800 °C. The resulting thermograms illustrate weight loss and heat flow as a function of temperature. The electrical resistance of the films was assessed by measuring temperature-dependent current–voltage (I–V) characteristics. A digital multimeter and waveform generator were used for these tests, which were carried out in a temperature-controlled setting.
3. Results and discussion
Figure 2A shows the X-ray diffraction (XRD) pattern of bioC characterized by broader and less intense peaks, indicative of its amorphous nature. In contrast, Figure 2B illustrates the distinctive XRD peaks of the bioC–GO nanocomposites observed at 2θ angles of 20°, 27°, 42°, 49°, 73°, and 89°. These peaks reflect the structural contributions of fish scales, GO, and the KC–IC/FS (bioC) biopolymer matrix. The XRD pattern of pure gelatin powder exhibits a broad peak at 2𝜃 ≈ 20°, consistent with its semi-crystalline nature and triple-helical structure [16, 17]. The reduced intensity of the peak at 42° suggests graphene exfoliation within the bioC matrix, significantly altering the crystalline structure of GO [18]. Peaks at 42° and 49°, previously attributed to pure KC and IC [18, 19, 20], show diminished intensity in the bioC–GO nanocomposites, indicating modifications in the crystalline arrangement of these components. These findings provide valuable insights into the structural evolution of bioC–GO nanocomposites, underscoring the dynamic interactions between the biopolymer matrix and GO.
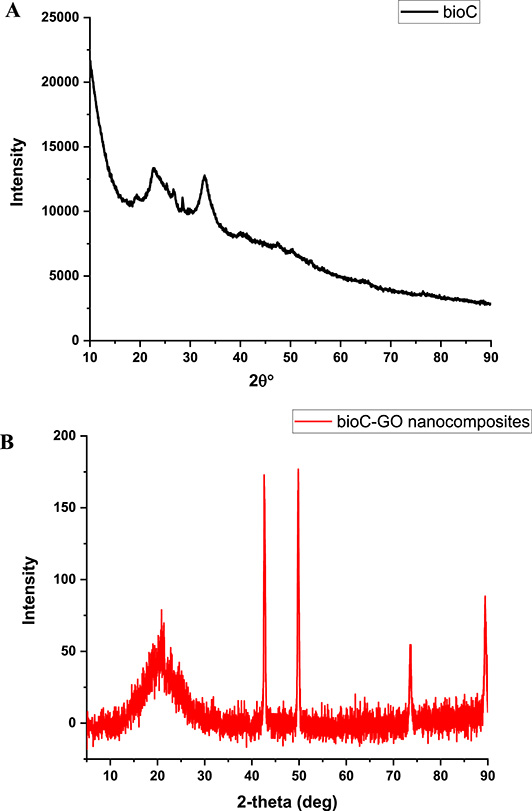
XRD patterns of (A) bioC film and (B) bioC–GO nanocomposite.
In Figure 3A, the SEM image shows that the bioC sample exhibits a compact and dense structure with a slightly flaky surface. The corresponding EDS spectrum (Figure 3B) confirms the presence of elements such as C, O, Na, Mg, S, Cl, K, Ca, and Fe, with the weight% of carbon measured as 30.44%. In contrast, Figure 3C reveals the morphology of the bioC–GO nanocomposites characterized by wrinkly surfaces resulting from the synthesis process. The SEM image demonstrates that the biopolymers uniformly cover the GO substrate. Figure 3D displays the EDS spectrum for the nanocomposite, identifying elements including C, O, Na, Mg, Si, S, Cl, K, and Ca, which are attributed to the utilized substrate and incorporated materials [21]. From the tabulated data in Figure 3C, the carbon weight% in the bioC–GO nanocomposites is estimated as 28.34%, slightly lower than that of the bioC sample. Phiri et al. reported that functionalized GO can introduce oxygen-containing functional groups, which slightly increase the oxygen weight% in the composite [22]. These findings provide insights into the elemental composition and distribution within the bioC–GO nanocomposites, offering valuable information about their structural characteristics and potential applications [23, 24].
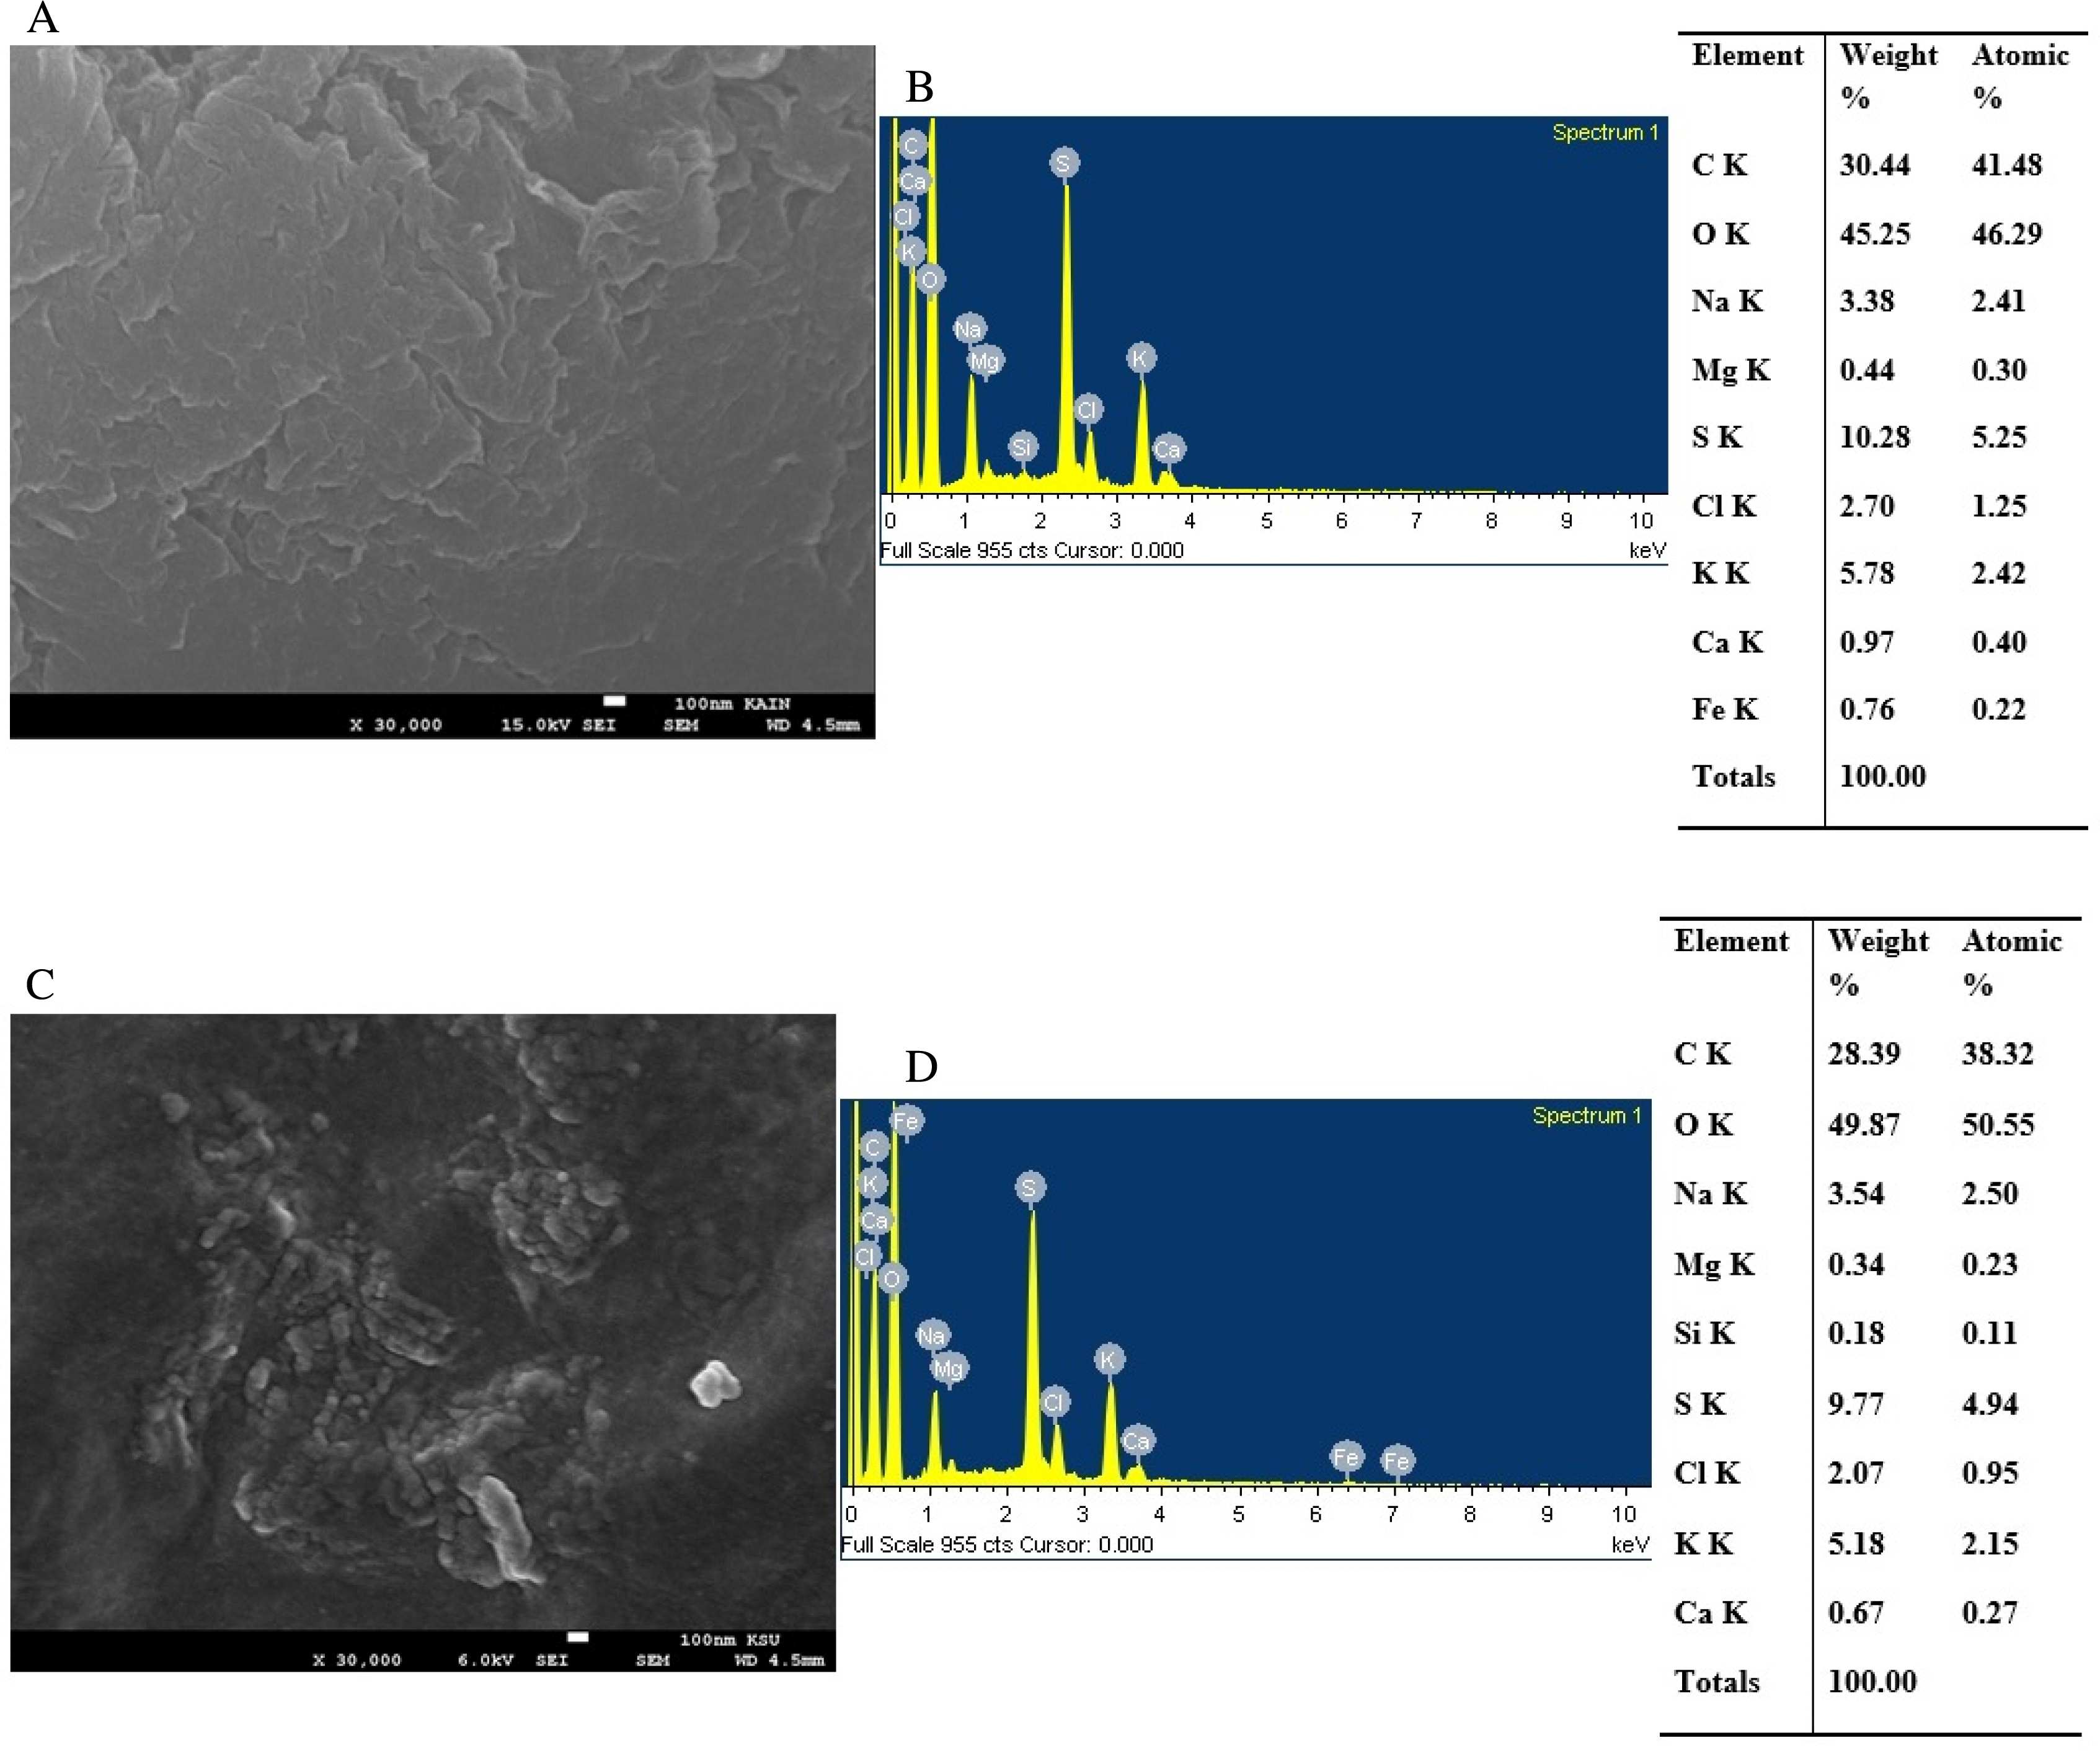
BioC film: (A) SEM image, (B) EDS patterns and a tabulation of the EDS spectrum; bioC–GO nanocomposites: (C) SEM image, (D) EDS patterns and a tabulation of the EDS spectrum.
Transmission electron microscopy (TEM) was used to assess the bioC–GO nanocomposite ink’s morphology as shown in Figures 4A and B. Imaging using TEM revealed the presence of nanocomposite flakes with one or more layers. Although GO is primarily clear, its surface frequently exhibits brightness changes due to elastic corrugations and scrolled or folded edges [25]. The TEM images revealed bioC–GO sheets that were extensively wrinkled, highlighting their distinct structural characteristics. After careful TEM investigation, it was determined that our samples’ diameters fall within the nanometer range, highlighting their nanostructured nature [26]. Additionally, the samples’ high level of disorder highlights how dynamic and complicated the bioC–GO nanocomposites are. Consequently, the other components in the composite help widen the interlayer gap between the GO sheets, preventing them from reassembling [27, 28].
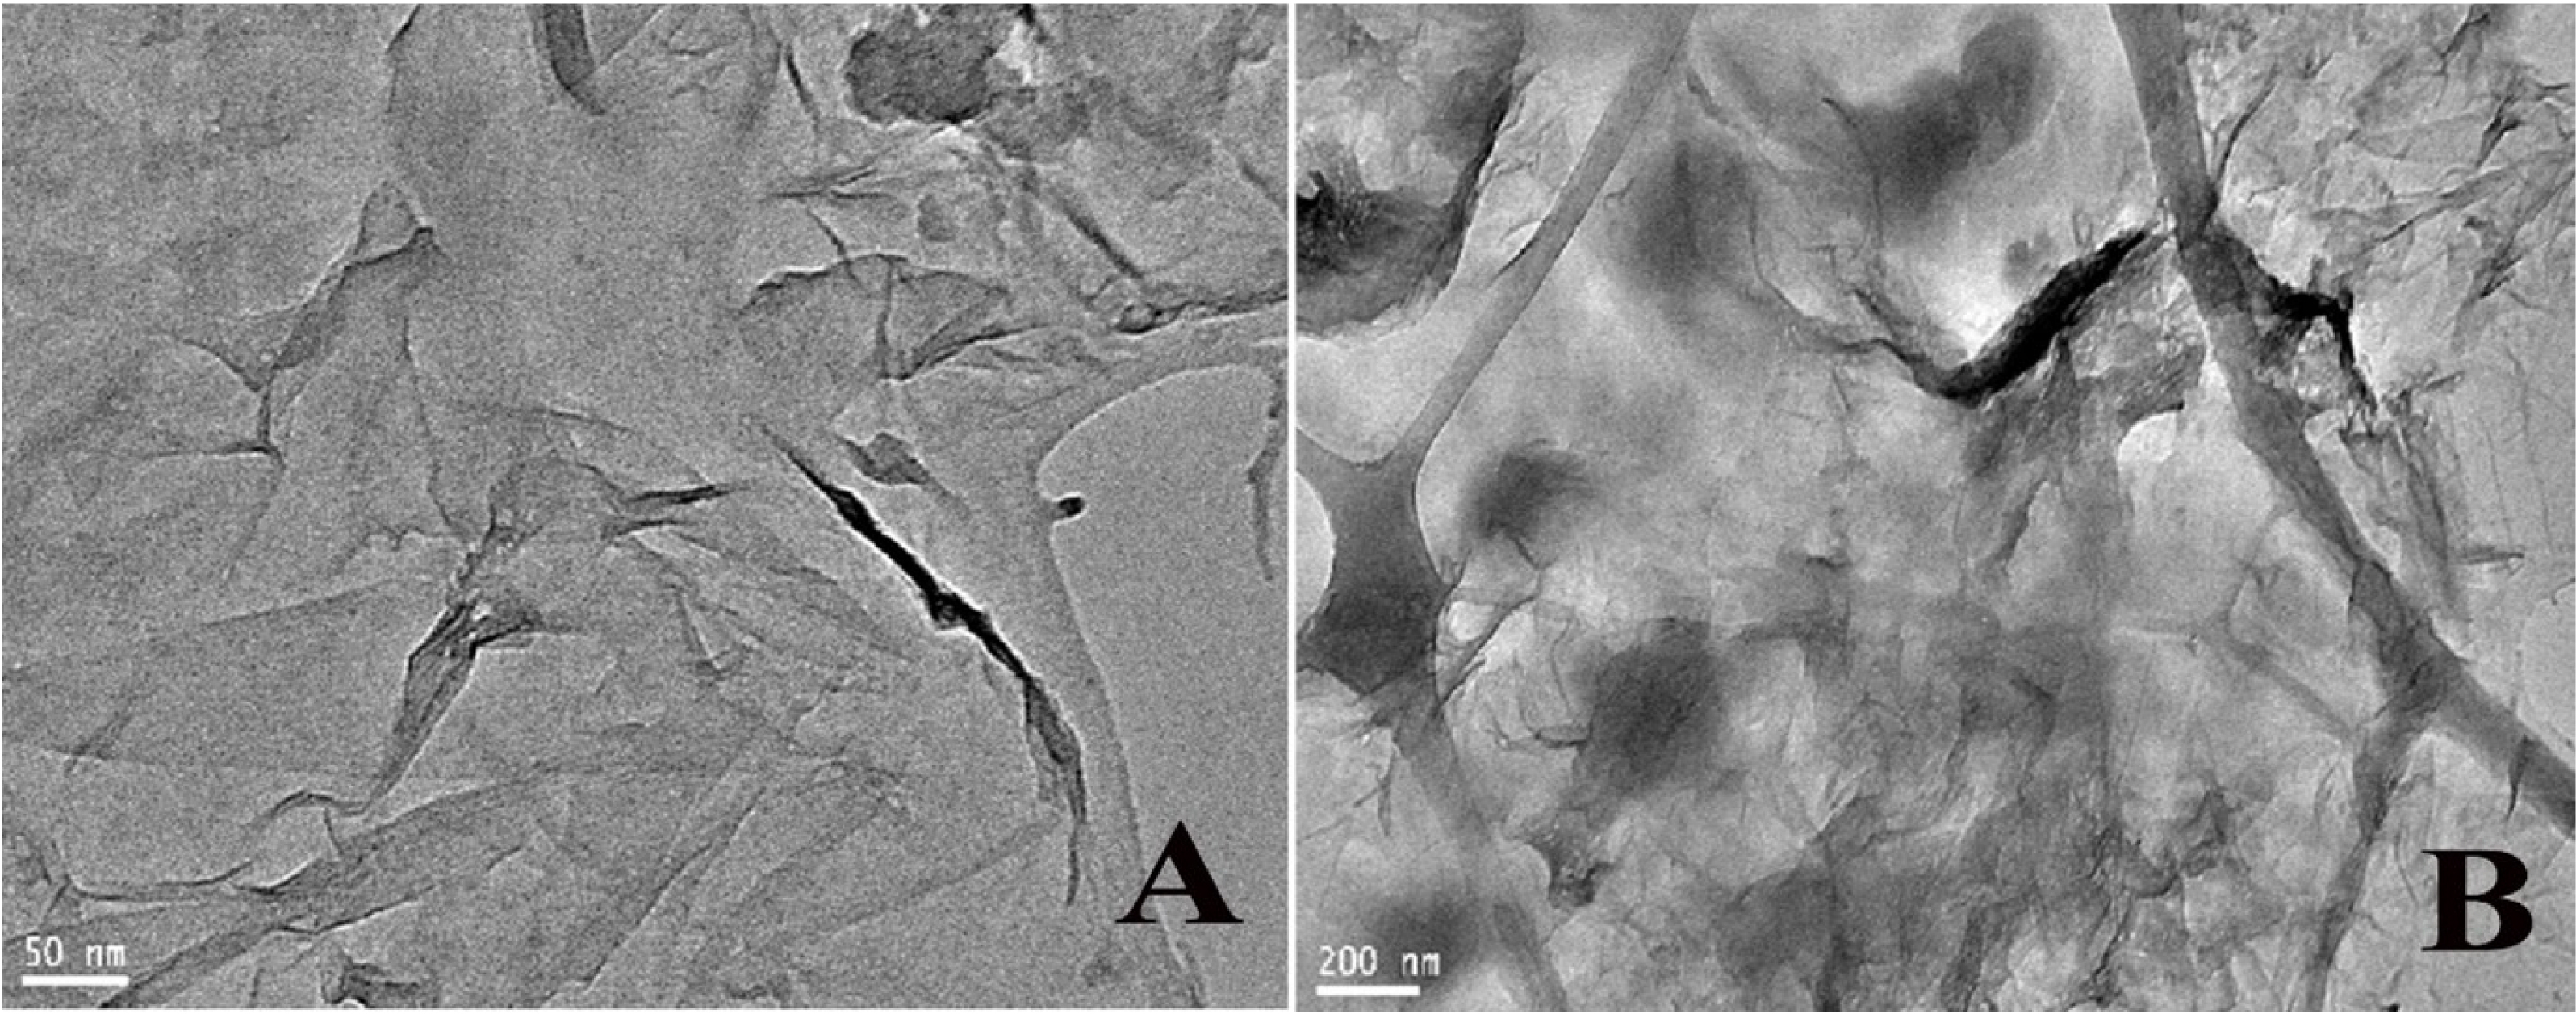
(A, B) TEM images with scale bars 50 nm and 200 nm, respectively.
A thorough TGA of the bioC–GO nanocomposites was conducted in a nitrogen environment at a heating rate of 50 °C. The bioC and bioC–GO nanocomposites were heated at a rate of 20 °C per minute from 100 °C to 800 °C. The TGA data displayed in Figures 5A and B provide a wealth of information on the thermal characteristics of the bioC and nanocomposites [29].
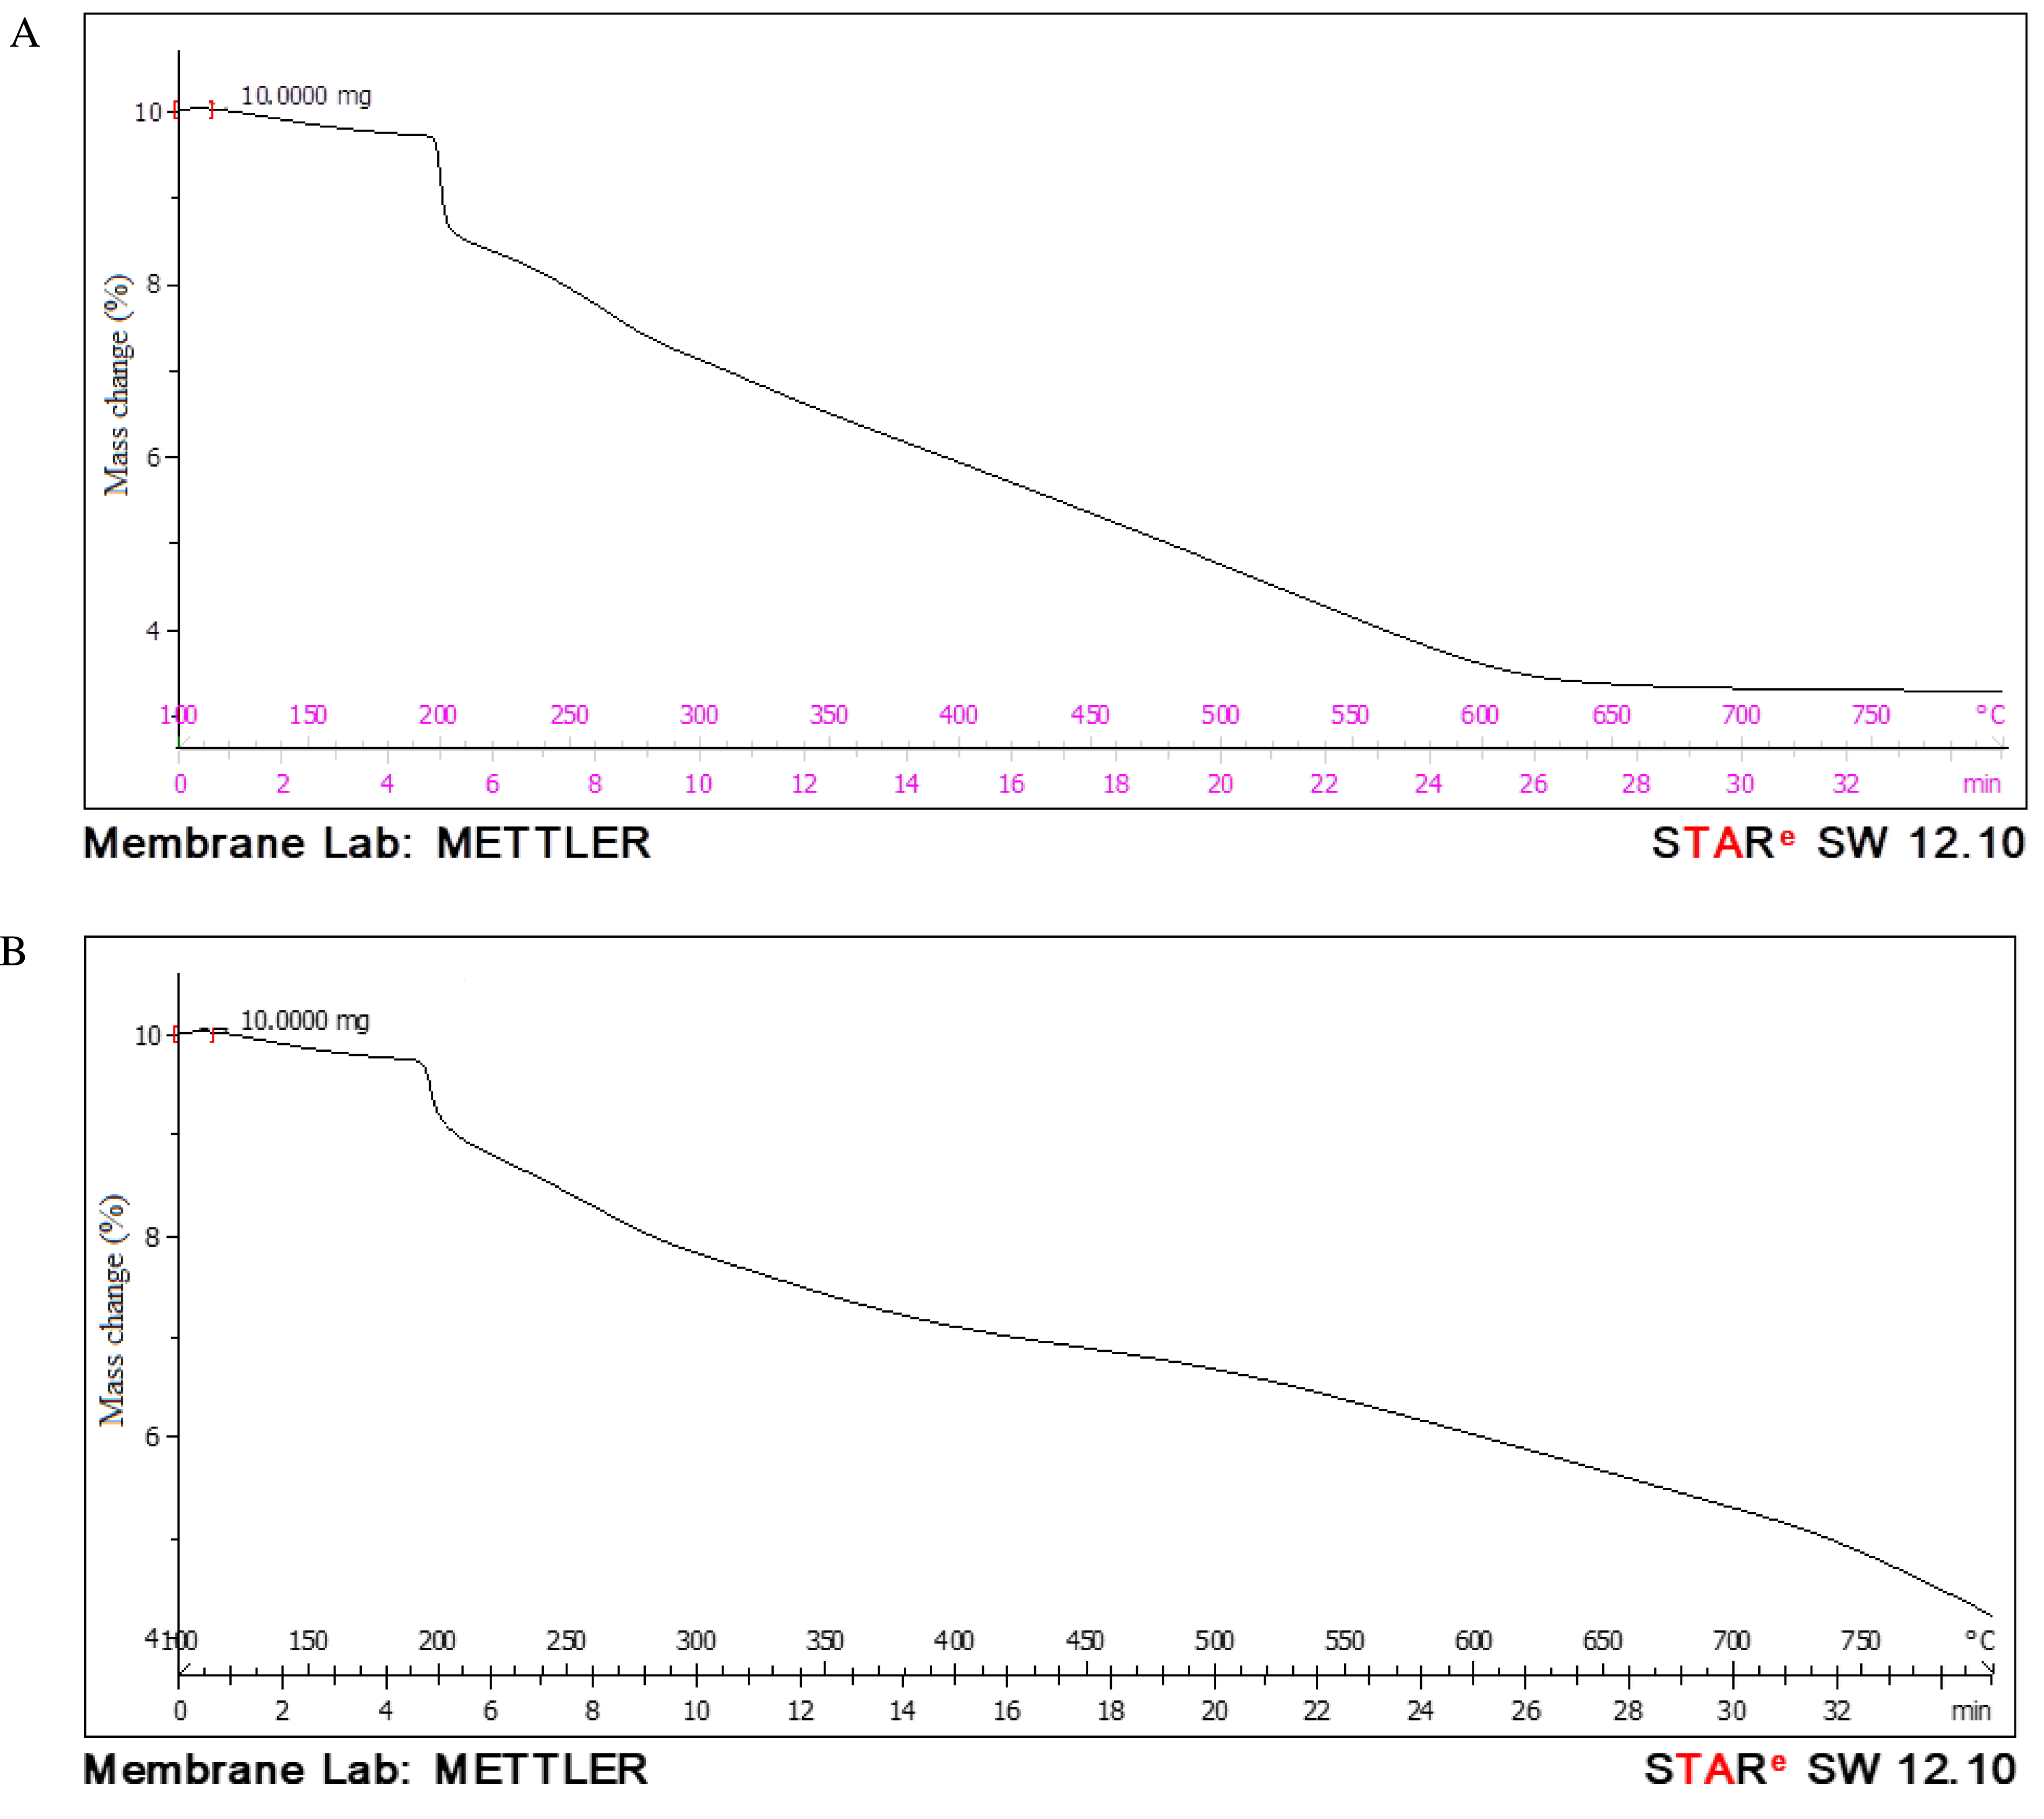
TGA curves of (A) bioC film and (B) bioC–GO nanocomposites.
In Figure 5A, the TGA curve of a composite made of KC, IC, and fish scale powder reveals the main thermal decomposition stages of the bioC. Initially, weight loss occurs between approximately 50 and 200 °C, which is attributed to the evaporation of absorbed and bound water due to the hydrophilic nature of KC, IC, and fish scale powder. A subsequent weight loss is observed in the range of 200–300 °C, corresponding to the thermal degradation of carrageenan. This involves the breakdown of glycosidic bonds and the release of volatile products. Another significant weight loss occurs between 300 and 450 °C, primarily due to the thermal decomposition of collagen proteins in the fish scale powder along with the remaining organic matter from the carrageenan. Beyond 450 °C, additional weight loss is associated with partial demineralization or structural transformations of mineral components, such as hydroxyapatite, present in the fish scale powder. At temperatures exceeding 600 °C, the residual mass consists predominantly of inorganic material, primarily reflecting the mineral content of the composite [30].
In Figure 5B, approximately 15–20% of the total weight loss in the nanocomposites is attributed to the main chain breakdown, which begins at 200–250 °C. The bioC–GO nanocomposites are hypothesized to exhibit significantly higher thermal stability, as they demonstrate only 45% weight loss at 800 °C, with complete combustion not occurring until around 800 °C [31]. Interestingly, weight loss due to solvent evaporation is observed at lower temperatures. Previous research by Pati et al. [32] suggests that the decomposition of graphene nanocomposites occurs in the temperature range of 200–280 °C. Meanwhile, polymer breakdown takes place between 350 and 480 °C. According to Tapas Mitra et al., collagen-functionalized nanographene oxide (bioC–GO) scaffolds begin to degrade predominantly after 350 °C. Based on weight loss rates at 400 °C, 800 °C, and 900 °C, bioC–GO scaffolds demonstrate far greater thermal stability compared to native collagen. This enhanced stability is likely due to covalent interactions between nanographene oxide and collagen [33]. Furthermore, 47% of the amine groups in the bioC–GO scaffold are involved in intermolecular interactions [34]. These findings not only highlight the improved thermal stability of bioC–GO nanocomposites but also open avenues for further research and potential applications in various industries [35].
When fish scales are added to GO and KC or IC composites, the resulting composite’s performance and thermal stability can be improved over earlier research outcomes [36, 37, 38, 39, 40, 41]. According to earlier research studies, the following are some possible methods for enhancing thermal stability when fish scales are added. The hierarchical structure of collagen and mineral layers in fish scales contributes to their stiffness and flexibility. The resultant composite is more flexible and less prone to break or distort under stress when the mechanical rigidity of GO and the gel-like elasticity of carrageenan are combined. This synergy in mechanical properties also enhances thermal stability, as a well-integrated composite better resists thermal expansion and contraction. Likewise, when the material is subjected to mechanical or thermal stress, collagen from fish scales aids in energy dissipation. These characteristics delay structural collapse by allowing the composite to absorb and transfer energy more efficiently, resulting in increased thermal stability. By serving as a heat sink and dispersing thermal energy throughout the composite matrix, GO additionally supports this process [42, 43, 44, 45].
At room temperature, the resistivity response of the bioC–GO nanocomposites under forward and reverse bias was examined at different bias voltages as shown in Figure 6A. Furthermore, the impact of temperature on the sample’s DC conductivity was investigated using bias voltages of 5 V up to 150 °C as shown in Figure 6B. The resistivity measurements performed can be fitted by the one-dimensional variable range hopping model, using the following formula:
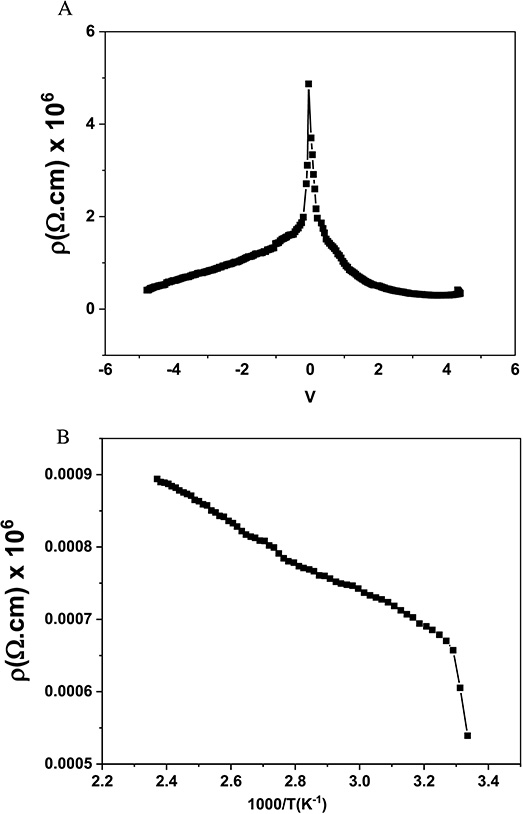
(A) Resistivity response under forward and reverse bias at room temperature and (B) resistivity change with respect to temperature for bioC–GO nanocomposites.
4. Conclusion
This study presents the development and characterization of graphene-based bioC–GO nanocomposites specifically engineered for applications requiring enhanced thermal stability, electrical conductivity, and environmentally friendly properties. The structural and morphological analyses, including TGA, SEM, EDS, TEM, and XRD, confirmed the uniform dispersion and strong covalent interactions within the bioC–GO matrix. Our findings demonstrate that the resistivity values of bioC–GO nanocomposites remain very low even at temperatures as high as 150 °C at a steady applied voltage of 5 V. This indicates a significant increase in conductivity with rising temperature, highlighting the dynamic and thermally responsive nature of the material. These results indicate that bioC–GO nanocomposites hold promise as cathode materials for energy storage systems, such as batteries, and for use in electronic devices requiring stable conductivity under high-temperature conditions.
Declaration of interests
The authors do not work for, advise, own shares in, or receive funds from any organization that could benefit from this article, and have declared no affiliations other than their research organizations.
Acknowledgment
The authors express their gratitude to the Central Research Laboratory/Research Institute/Center Supporting Program (RICSP-25-3) under King Saud University, Saudi Arabia.
Vous devez vous connecter pour continuer.
S'authentifier