


 CC-BY 4.0
1. Introduction
Water pollution is the biggest problem around the world. This is due to the presence of micropollutants in wastewater, rivers, and seas. Pharmaceutical and personal care products are considered recalcitrant micropollutants [1]. Their increased consumption threatens the environment, humans, and other organisms [2, 3, 4]. Metformin (Met) is the most commonly prescribed antihyperglycemic agent for the treatment of type 2 diabetes mellitus and other diseases, such as endocrine disorders and cancers.
As this drug is incompletely metabolized by the human body, it is discharged into the environment and becomes an emerging micropollutant [5]. Some studies have reported that its presence in soil affects the growth of fruits and vegetables (tomatoes, squash, carrots, etc.). It has also been demonstrated that exposure of fathead minnows (Pimephales promelas) to metformin (40 mg/L) induces intersex gonads and reduces the size and fecundity of male fish [2]. Demarco et al. studied the effects of sublethal concentrations of Met on the antioxidant system. Their results demonstrated mutagenicity, oxidative stress, and activation of the antioxidant system in metformin therapy for up to 30 days, as well as severe tissue damage and apoptotic cells after 60 days. This affects the survival of non-target animals [6]. For these reasons, Met is harmful to animals and the aquatic environment, even at low concentrations [7]. Therefore, an efficient method of removing this micropollutant is required. The literature reports on different strategies for removing Met, such as advanced oxidation processes (AOPs), flocculation, phytoremediation, and adsorption. The incomplete removal of micropollutants from water and the high cost of some methods are considered inconvenient. Due to its affordability and ease of use, adsorption is a promising process that is widely used to remove Met [8]. Many adsorbents have been studied and applied for the removal of antidiabetics, including modified biochar [9], magnetic–carbon composites [10, 11], hydrogels [12], and activated carbons [13, 14, 15, 16]. Carbon nanomaterials, namely graphene and graphene oxide (GO), can adsorb Met. A graphene derivative, GO is a two-dimensional material with functional groups, including hydroxyl, epoxy, and carboxyl, on its surface and edges [17, 18]. Its fascinating physicochemical properties and large surface area mean that it has a wide range of applications, particularly in adsorption as an adsorbent [19, 20]. The adsorption of Met was tested using GO. Zhu et al. [20] carried out a study under different conditions of temperature, pH, ionic strength, and background electrolyte conditions. These parameters influenced the adsorption capacity. On GO at pH 6 and 15 °C, 80% of Met was adsorbed within 20 min. A thermodynamic study confirmed that the adsorption process was exothermic and spontaneous. Even after numerous adsorption–desorption cycles, GO exhibited excellent adsorption capacity due to π–π and hydrogen bonding interactions between GO and Met. Thus, GO could be an efficient and effective adsorbent for metformin removal [20]. Balasubramani et al. [1] conducted a study to optimize the Met adsorption parameters, including pH, contact time, initial concentration, and GO dose. In their study, GO was prepared from graphite using Hummer’s method and examined for Met adsorption.
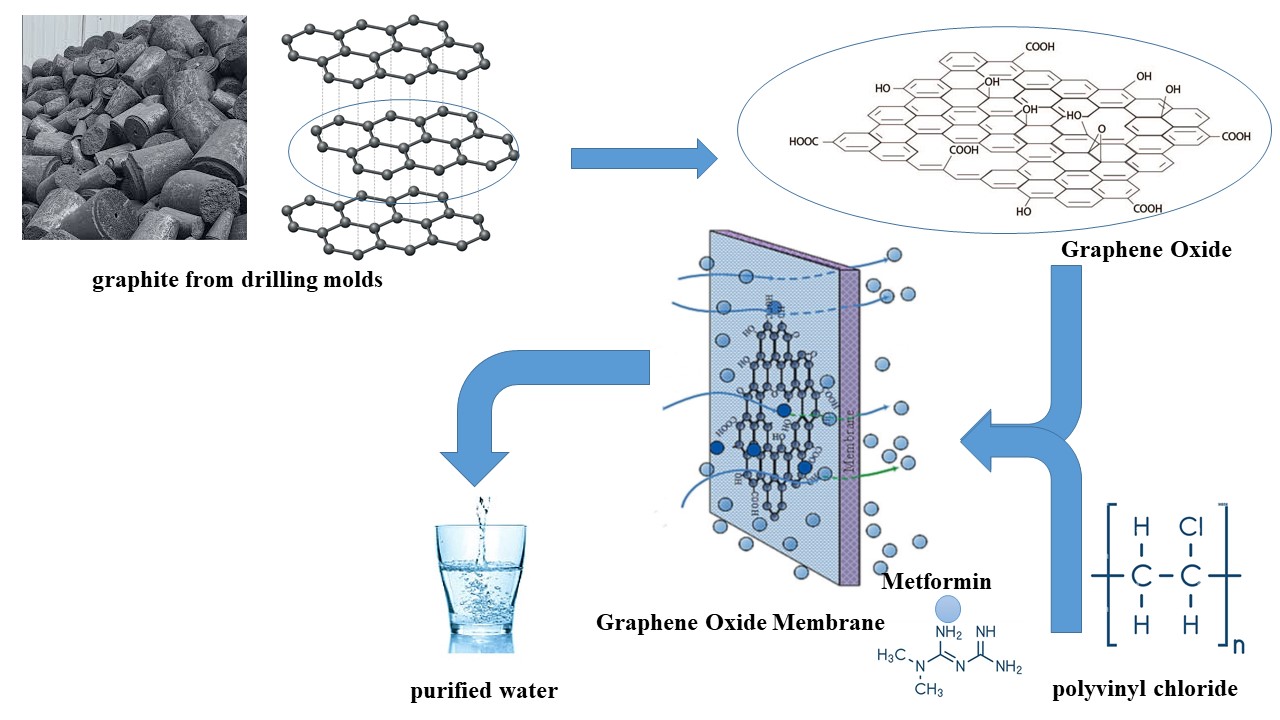
A thermodynamic study confirmed that metformin adsorption onto graphene oxide (GO) is spontaneous and exothermic [21]. Reusability studies showed that a 1 N sodium hydroxide solution could regenerate the GO for up to six cycles. The synthesized GO was found to have a better adsorption capacity than most other reported GOs [1]. Although these materials effectively eliminate pollutants from various water sources, it is sensible to seek more cost-effective, high-performance materials. To our knowledge, no literature exists on the adsorption of Met on a membrane-based polymer/GO composite. Thus, this study aims to investigate Met adsorption on a polyvinyl chloride/graphene oxide (PVC/GO) composite membrane. We characterized the synthesized materials using thermogravimetric analysis (TGA), Fourier transform infrared spectroscopy (FTIR), and Brunauer–Emmett–Teller (BET) analysis. The membrane composite was then used as an adsorbent in Met adsorption experiments. These experiments examined the impact on the Met adsorption process of various parameters, including temperature, pH, contact time, and GO content in PVC/GO. Additionally, we examined the adsorption data using different isotherms and investigated thermodynamics.
2. Materials and methods
2.1. Synthesis of graphene oxide
Graphene oxide was synthesized using Hummer’s method, in which graphite is oxidized and exfoliated using a mixture of oxidants, sodium nitrate (NaNO3), and concentrated sulfuric acid (H2SO4). The reaction mixture was kept in an ice bath at 0 °C with continuous stirring for 60 min. Then, over a period of 2 h, 15 g of KMnO4 was slowly added to the mixture while keeping it below 15 °C. After removing the mixture from the ice bath, it was stirred at 35 °C for two days until a brownish paste formed. Slowly diluting the resulting mixture with 100 mL of distilled water produced an exothermic reaction, raising the temperature to 98 °C and changing the color to brown. To complete the reaction, the solution was stirred for 30 min at 98 °C. Then, the solution was diluted with 200 mL of distilled water and neutralized with a 30% hydrogen peroxide solution. This converted the residual permanganate and MnO2 formed during the reaction into soluble manganese ions until outgassing ceased. The solution was diluted with a 5% HCl solution. To remove impurities, the mixture was washed with deionized water. The product was subjected to ultrasonic treatment for 30 min to exfoliate the GO sheets. The resulting GO was dried for 24 h at 60 °C. Advanced characterization techniques such as Raman spectroscopy, scanning electron microscopy (SEM), X-ray diffraction (XRD), Brunauer–Emmett–Teller (BET) surface area analysis, Fourier-transform infrared spectroscopy (FTIR), and X-ray fluorescence analysis (XRF) confirmed the presence of GO in the synthesized material [22].
2.2. Preparation of the PVC/GO composite membrane
Membranes with a polymer matrix of PVC were prepared using the solution casting method described in [23]. A GO mass ranging from 0 to 15% was dispersed in a dibutyl sebacate (DBS) emulsion under ultrasonic vibration at room temperature for 15 min. Once fully dissolved, the required amount of PVC was added to the mixture while stirring. After stirring for an additional period of time, the resulting solution was poured into a mold. The resulting membrane was removed from the mold with forceps after being placed in an oven at 150 °C for 1.5 h.
3. Characterization
Thermogravimetric analysis (TGA) of GO and PVC/GO was performed using SDT Q600 V20.9 Build 20 from TA Instruments to determine the samples’ thermal stability. Fourier transform infrared (FTIR) spectroscopy was carried out using a JASCO V-770 FTIR spectrometer, with spectra recorded from 4000 to 400 cm−1. The Brunauer–Emmett–Teller (BET) method was used to determine the specific surface area, pore size, and pore volume of the GO. Measurements were taken via N2 adsorption and desorption, and the data were collected and processed using Gemini VII 4.00.
Adsorption of Met was carried out in a batch process. First, PVC/GO’s efficiency toward Met adsorption was investigated to determine the optimal removal conditions. A predetermined amount of adsorbent was mixed with 80 mL of Met solution at various concentrations. The temperature was 25 °C, and the pH of the solution was neutral. Based on preliminary experiments, a reaction time of 30 min was selected. After determining the optimal concentration, equilibrium time values were established for the prepared adsorbent. After adsorption by PVC/GO, the residual Met concentration was measured using a UV spectrophotometer at a wavelength of 232 nm. The percentage removal of Met was calculated using the following equation:
| \begin {equation*} \mbox {\% Removal }=\frac {(C_0-C_{\mathrm {e}})} {C_{0}}\times 100 \end {equation*} |
3.1. Thermal gravimetric analysis (TGA)
Thermal stability of GO and the GO-reinforced PVC composite membrane was studied using TGA. As evidenced by two peaks observed in the differential thermal analysis (DTG) curves in Figure 1, GO exhibited a two-step degradation.
Thermogravimetric analysis (TGA) and differential thermal analysis (DTG) curves of graphene oxide (GO) and the polyvinyl chloride (PVC)/GO composite.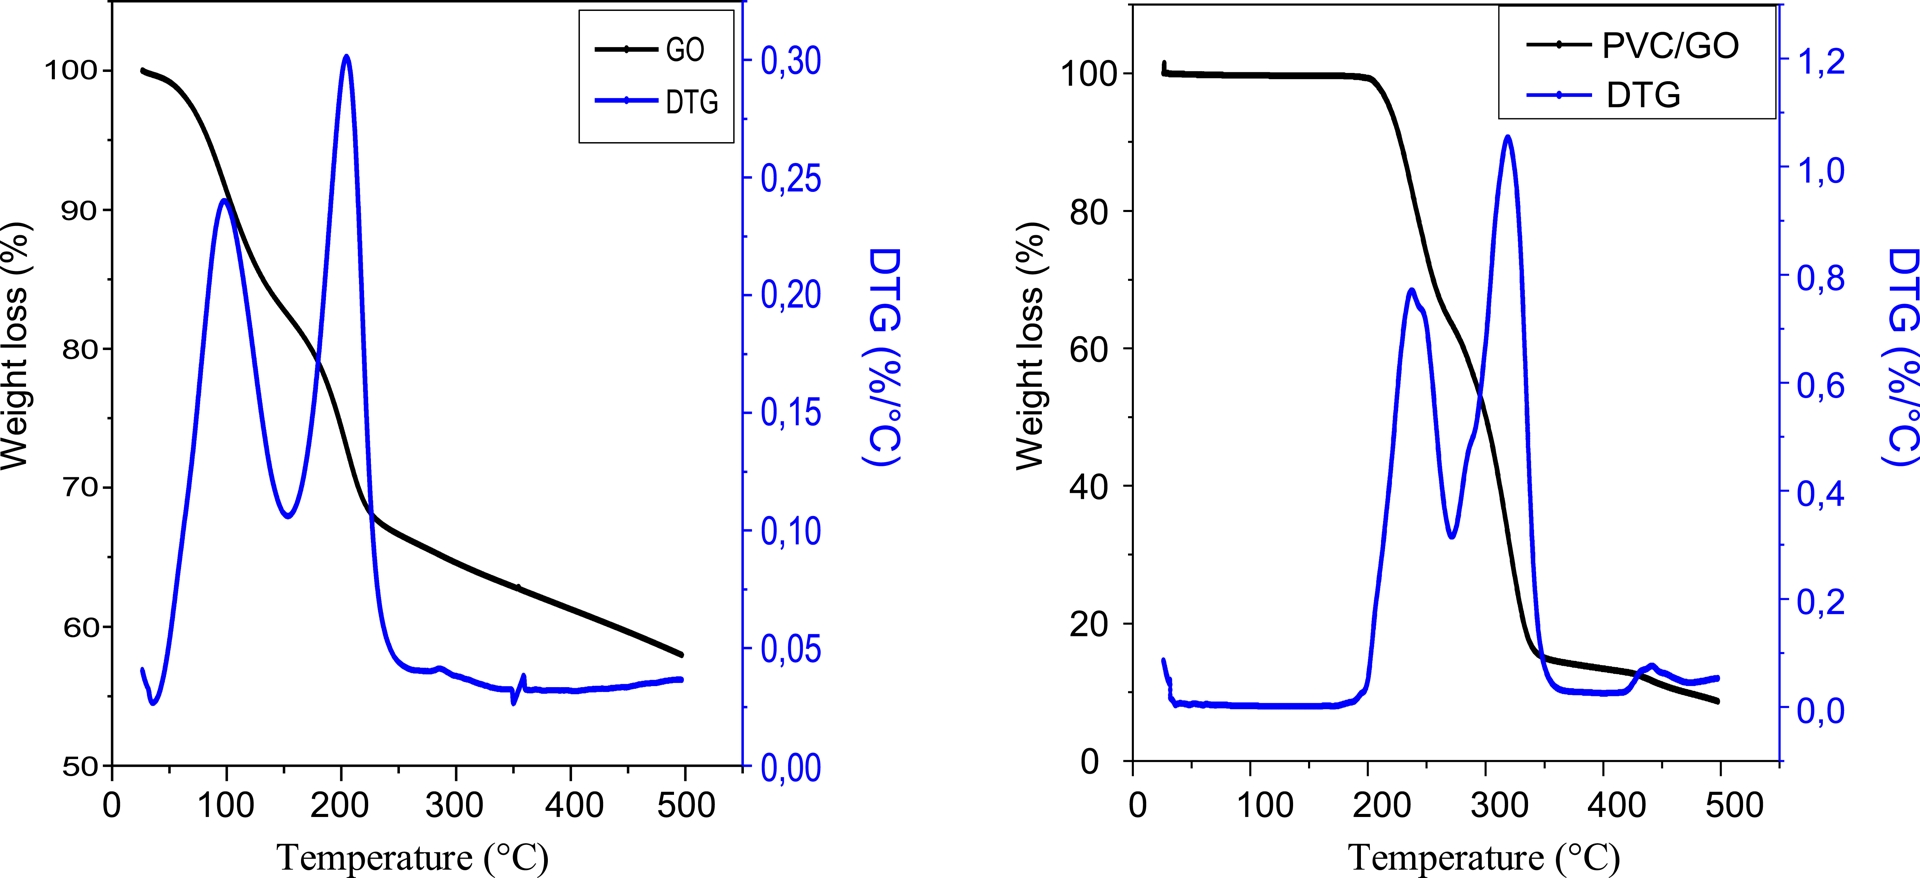
The first step occurred between 50 and 150 °C and is attributed to the evaporation of adsorbed water molecules. The second step occurred between 180 and 250 °C due to the decomposition of GO’s oxygenated functional groups. The PVC/GO composite is thermally stable up to 200 °C. Thermal degradation occurred in two steps. The first step occurred between 200 and 250 °C and is characterized by the elimination of the oxygenated functional groups of the membrane component. The second step occurred between 318 and 440 °C, due to the decomposition of conjugated polyene chains. This leads to the formation of volatile aromatic compounds and a stable carbon residue [24].
3.2. Fourier-transform infrared spectroscopy (FTIR)
Figure 2 shows the FTIR spectrum of PVC/GO. The spectrum exhibits characteristic bands at 2958, 2940, and 2858 cm−1, which are associated with symmetrical and asymmetrical C–H stretching vibrations, respectively.
FTIR spectrum of PVC/GO.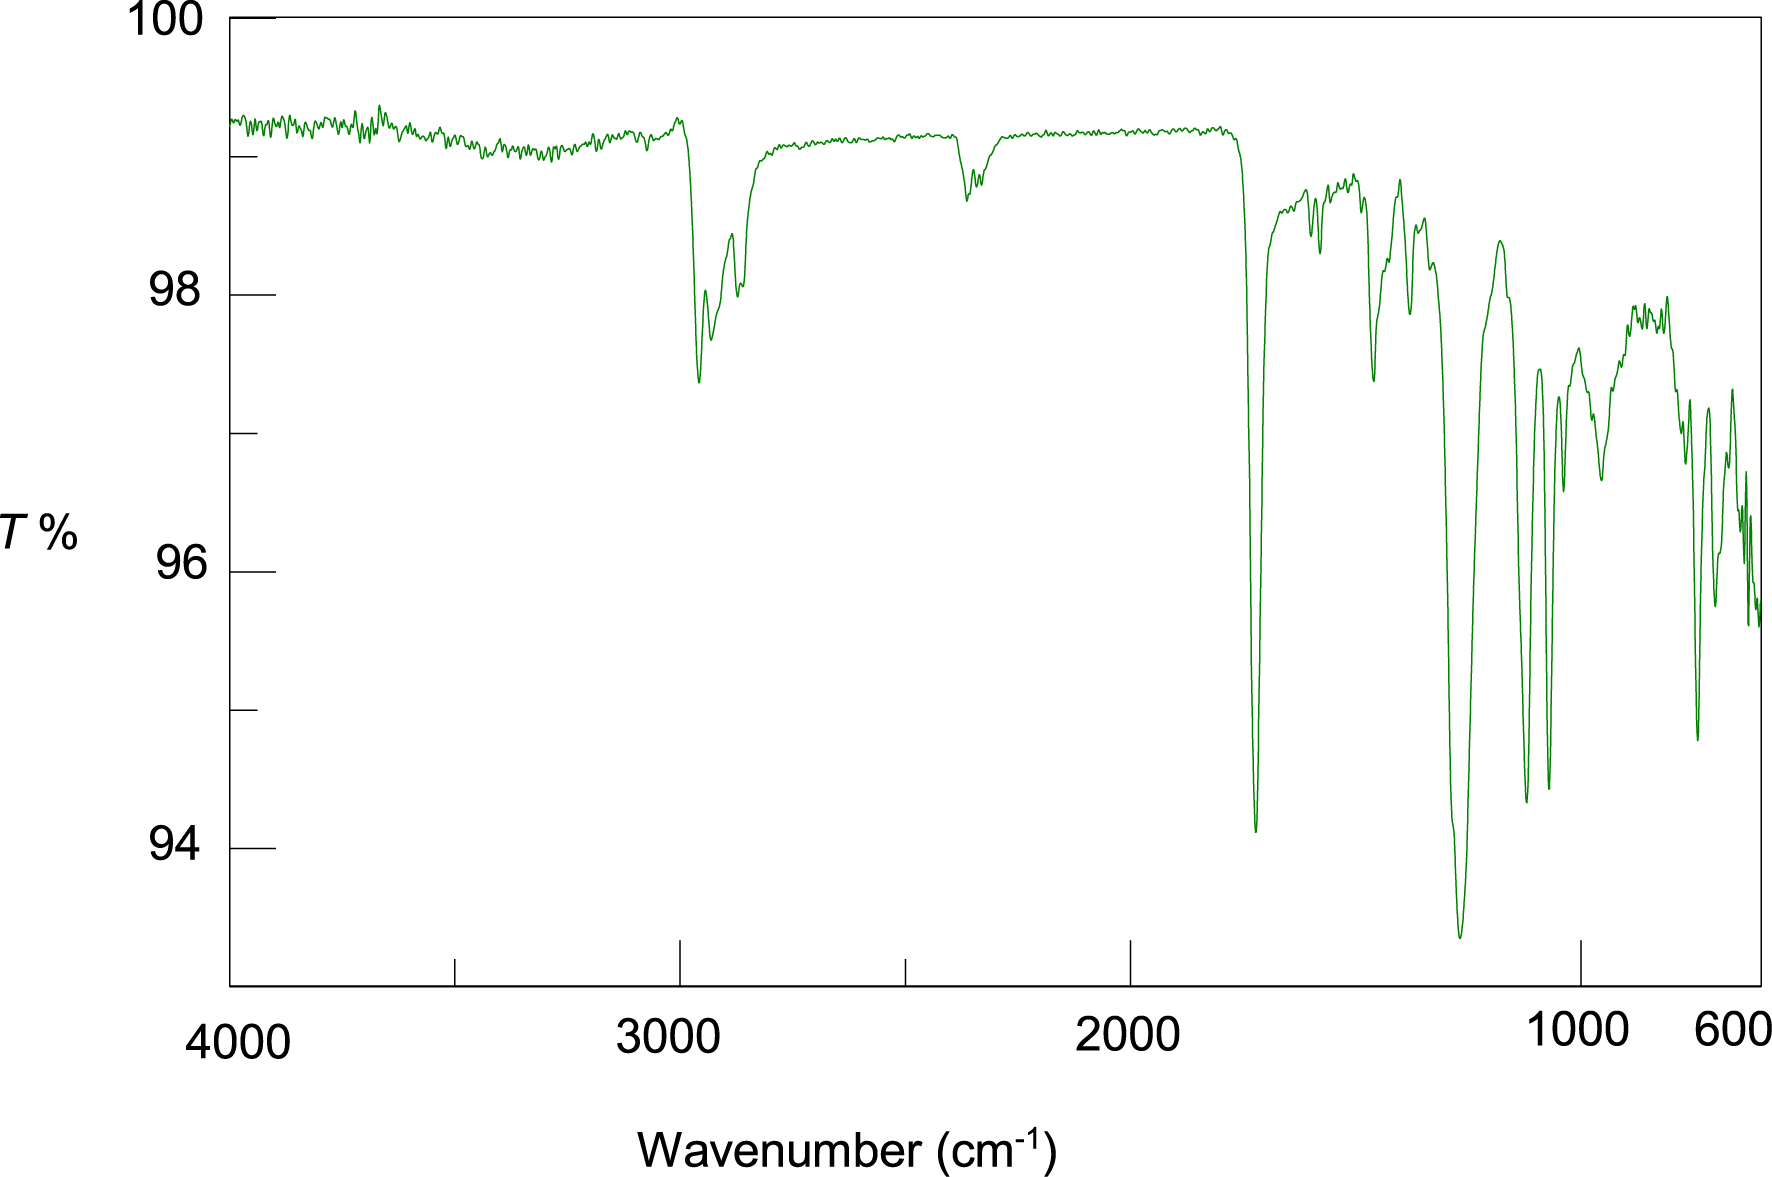
Bands around 2450 cm−1 are due to the absorption of CO2 from the air [25]. Intense bands at 1732, 1071, and 1025 cm−1 are due to C–O elongation. The bands at 1461 and 963 cm−1 correspond to in-plane and out-of-plane C–H deformation, respectively. The bands at 1246 and 1071 cm−1 correspond to C–C elongation. The C–Cl elongation band was found at 692 cm−1.
3.3. Determination of specific surface area
Figure 3 shows the nitrogen adsorption–desorption isotherm of GO. The material exhibits a IUPAC type IV isotherm with a type H3 hysteresis loop between 0.2 and 0.99 P/P0. This confirms that the material is mesoporous.
Adsorption–desorption of N2 by graphene oxide.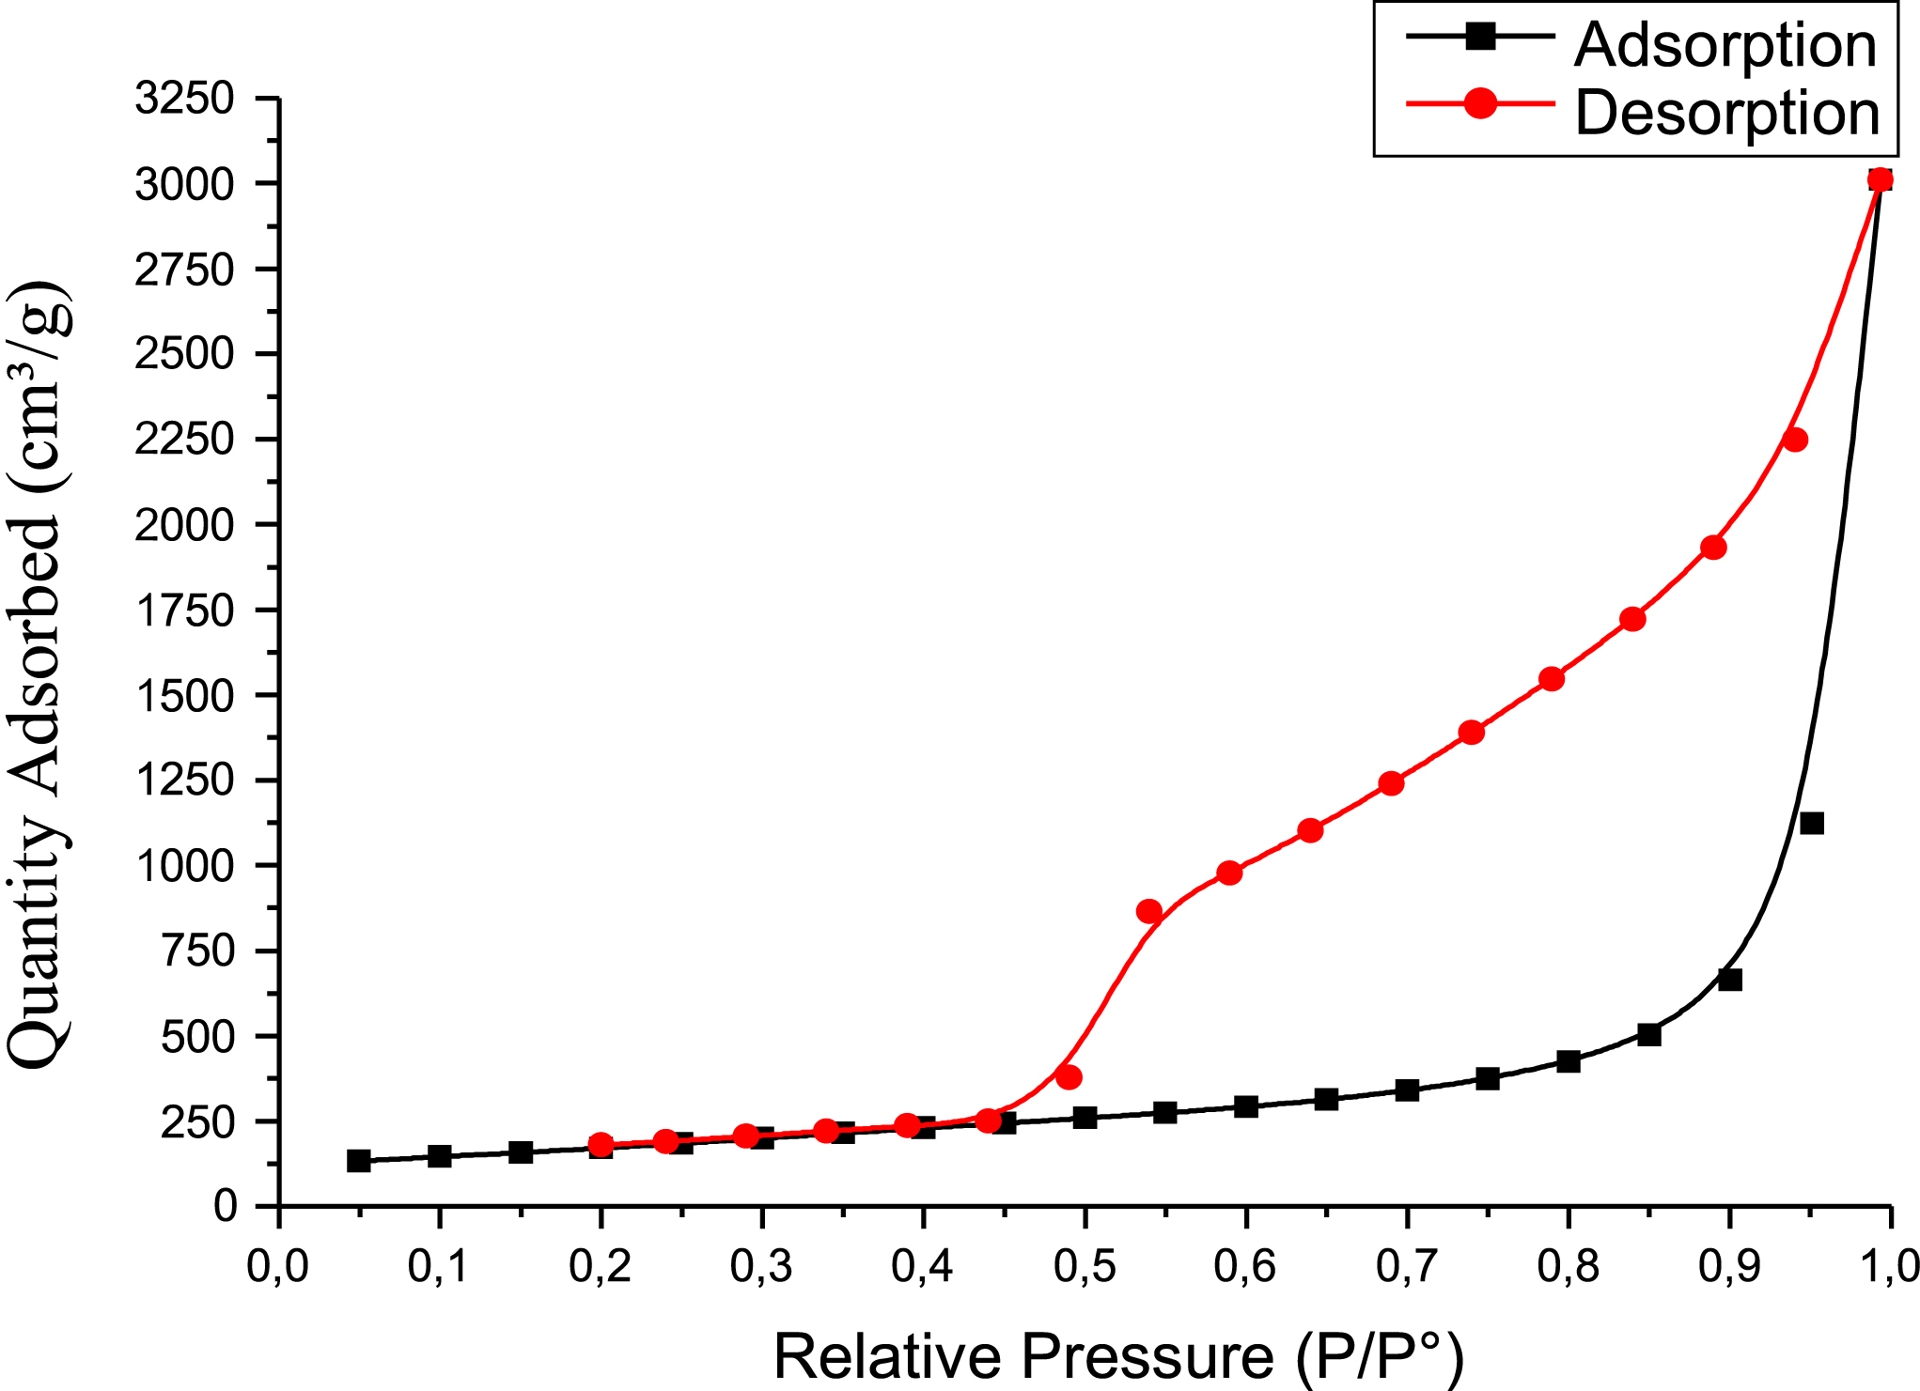
The values obtained with GO for the BET and BJH parameters (specific surface area, pore size, and pore volume) are presented in Table 1.
Different parameters of graphene oxide
| Parameters | SBET | SBJH | |
|---|---|---|---|
| Adsorption | Desorption | ||
| Specific surface (m2/g) | 625 | 673.24 | 2490.45 |
| Pore volume (cm3/g) | - | 0.80 | 2.99 |
| Pore size (nm) | - | 4.79 | 4.81 |
The results show that the BET surface area of GO is 625 m2/g, which is lower than GO’s theoretical surface area (2418 m2/g). This discrepancy is likely due to incomplete exfoliation and aggregation during synthesis [26]. Our previous study [22] reported a detailed analysis of the characterization results (SEM, XRF, Raman spectroscopy, XRD, and optical absorption properties) for the synthesized GO.
4. Study of the adsorption of met on PVC/GO composite membranes
4.1. Effect of contact time on Met adsorption
The equilibrium time of Met adsorption by PVC/GO was determined. Tests were performed using an aqueous Met solution at various concentrations (4, 6, 8, and 10 mg/L) brought into contact with 1 g of PVC/GO for 5 to 30 min. The results are presented in Figure 4.
Effect of contact time on metformin adsorption.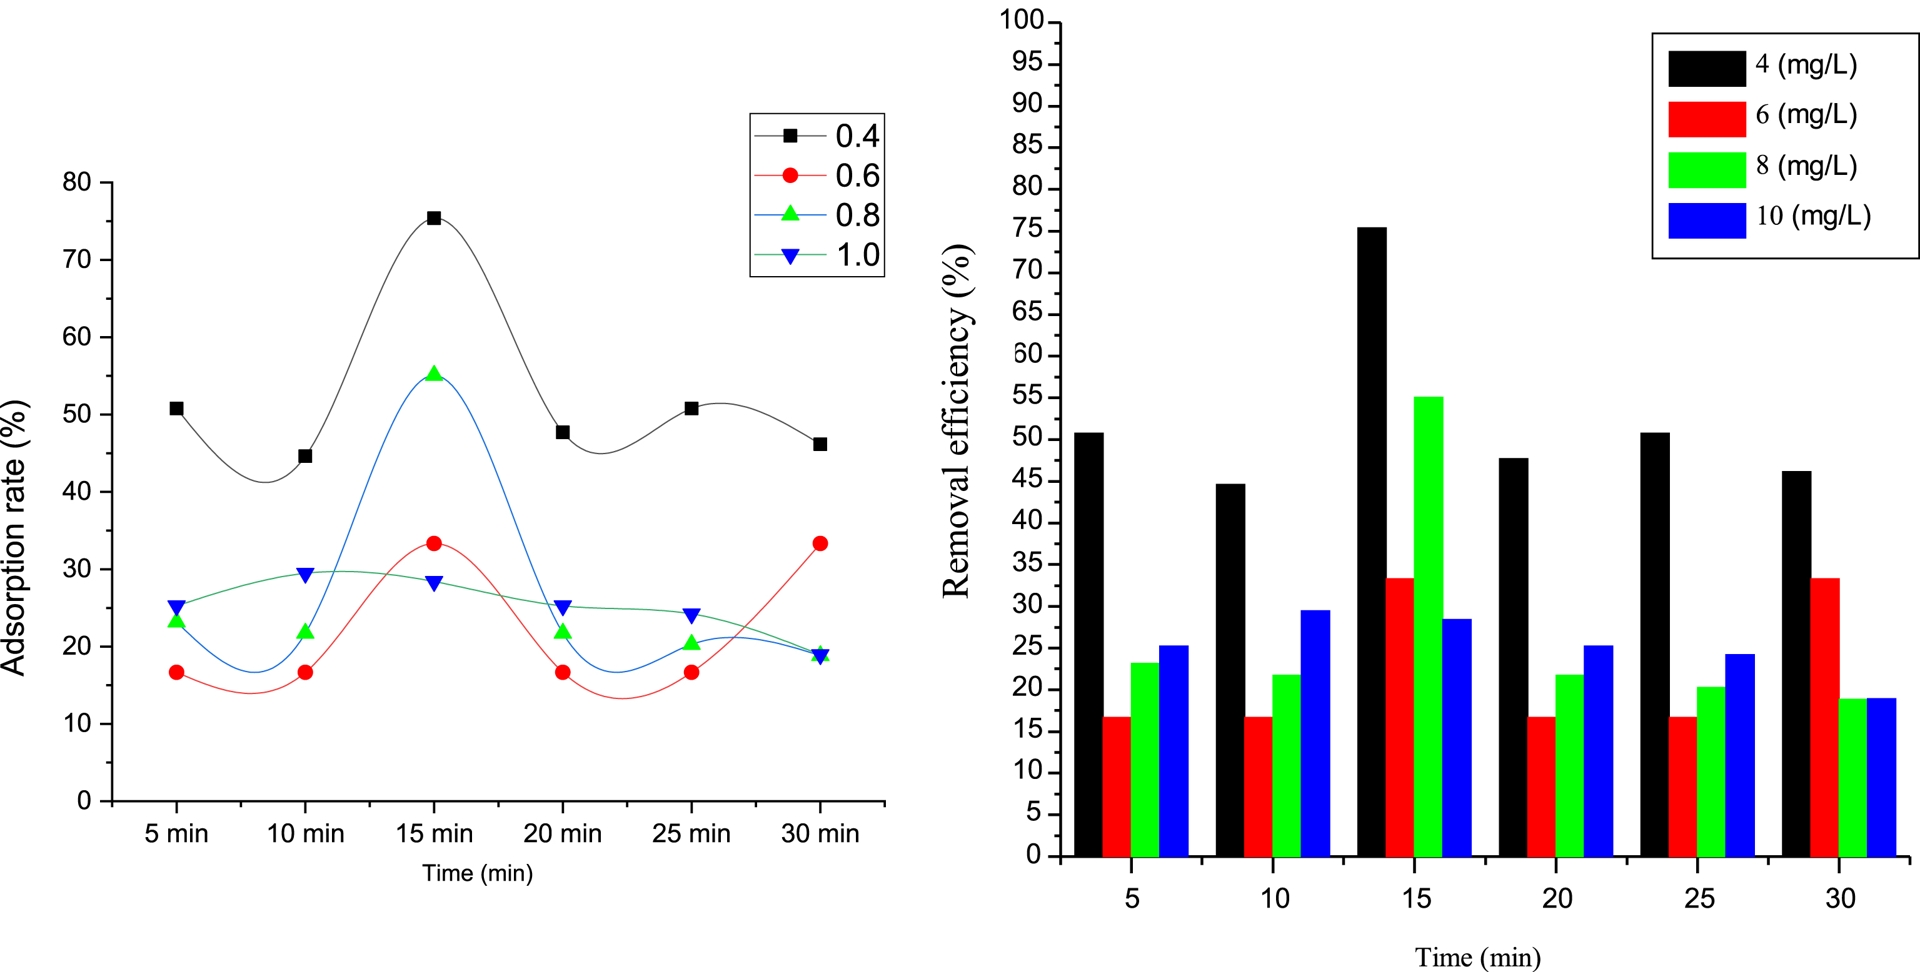
As can be seen from the histograms, the adsorption phenomenon occurs in two stages. In the first stage, adsorption of Met is low for the first 5 min, then increases rapidly until equilibrium is reached for the different concentrations. This can be explained by Met molecules binding to vacant sites on PVC/GO’s surface until they are fully occupied. The second stage corresponds to the desorption of Met after equilibrium is reached. This process involves adsorption followed by desorption under the influence of agitation [27, 28]. According to the results shown in Figure 4, the equilibrium for Met adsorption is achieved after 15 min, with an adsorption rate of 75% and an optimum concentration of 4 mg/L. We therefore chose these conditions for further testing.
4.2. Effect of pH
The pH of the solution is an essential parameter that affects adsorption. It considerably impacts the surface charge of the adsorbent, the extent of ionization, the speciation of the aqueous adsorbate species, and the adsorption rate. The pH effect was evaluated by mixing 1 g of adsorbent with 80 mL of a 4 mg/L Met solution at various pH levels (2, 4, 6, and 8). The results of the pH effect on Met adsorption are presented in Figure 5.
Effect of pH on the adsorption of metformin.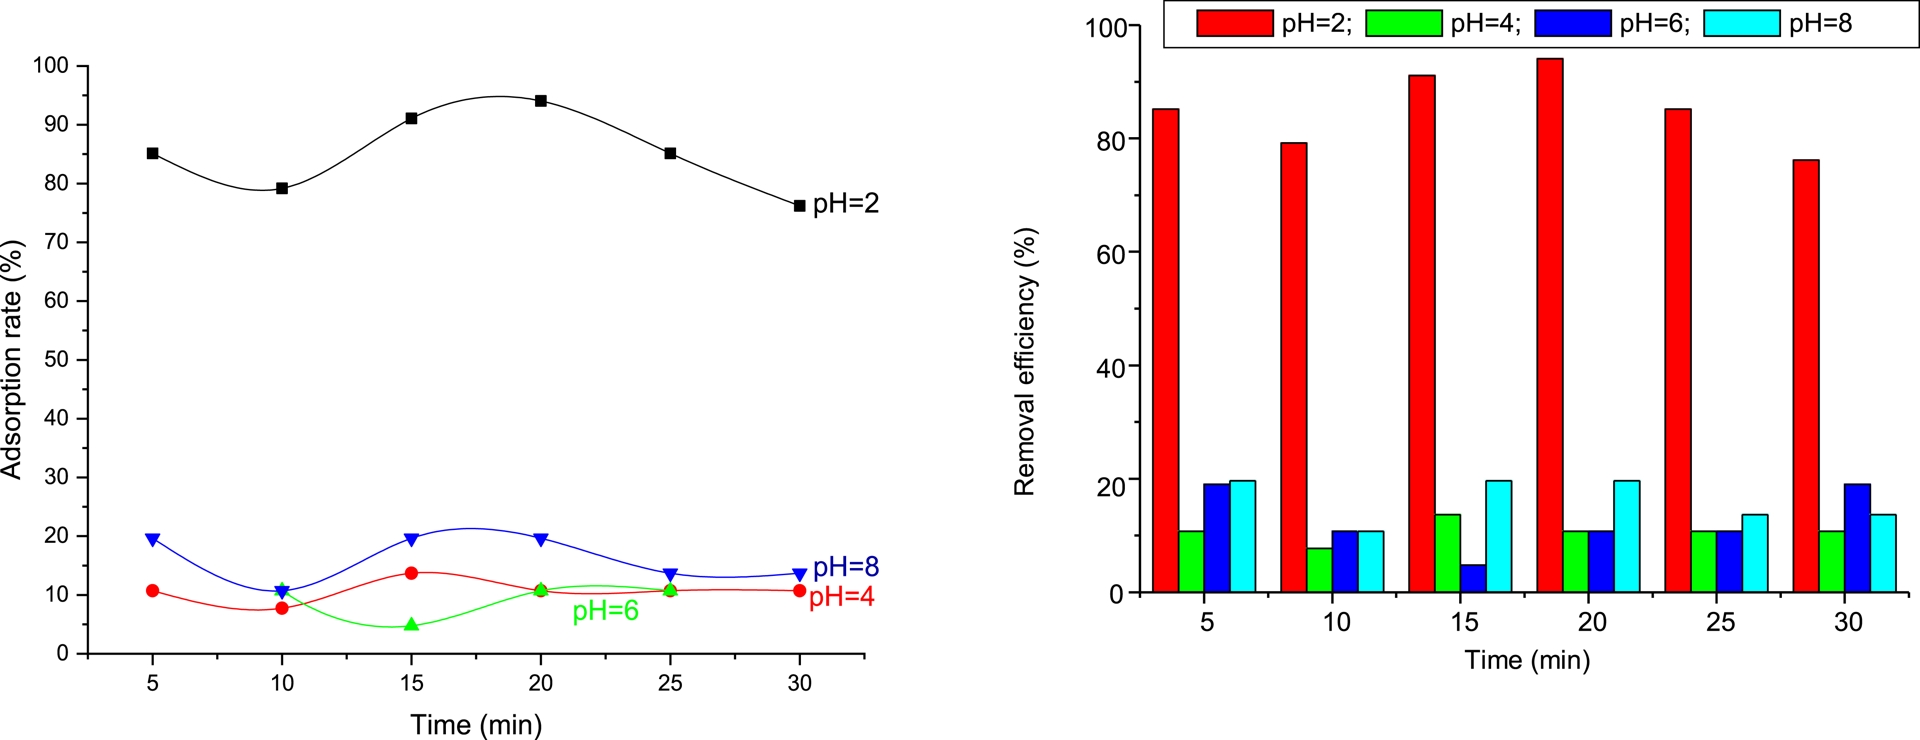
At low pH, the adsorbent surface becomes highly protonated, which enhances the electrostatic attraction between the positively charged Met molecules and the active adsorption sites. In addition, the high availability of H+ ions promotes favorable interactions, leading to maximum adsorption efficiency. As the pH increases to neutral and alkaline conditions (pH 6–8), the adsorption efficiency decreases. This reduction can be attributed to changes in surface charge of the adsorbent, increased competition between hydroxyl ions (OH−) and Met molecules for active sites, and possible electrostatic repulsion, which collectively hinder the adsorption process. Overall, the results indicate that acidic pH is optimal for Met adsorption, and pH = 2 provides the most favorable conditions for maximum removal. This behavior confirms that electrostatic interactions play a dominant role in the adsorption mechanism.
According to the results, the adsorption efficiency is highest in an acidic medium (pH = 2), at 91%. This can be explained by Met molecules binding to PVC/GO’s surface due to strong interaction forces between the positively charged adsorbate and the adsorbent surface at this pH value. Based on these results, it can be deduced that PVC/GO’s surface is negatively charged. However, increasing the pH value to 4, 6, or 8 reveals a decrease in Met adsorption efficiency. This decrease can be attributed to repulsive interactions between the surface charge of PVC/GO and the negative part of the Met. Therefore, Met adsorption is favored in an acidic medium, consistent with the results obtained by Çavuşoğlu et al. [11].
4.3. Effect on Met adsorption of GO content in the PVC/GO composite membrane
To investigate this, we conducted a series of adsorption experiments at various levels of GO content (0–15%). One gram of adsorbent was brought into contact with a Met solution under the following conditions: 4 mg/L, pH 2, and T = 40 °C. The mixtures were stirred at 250 rpm. Figure 6 shows the effect on adsorption of GO content in PVC/GO.
Effect on metformin adsorption of graphene oxide content in PVC/GO.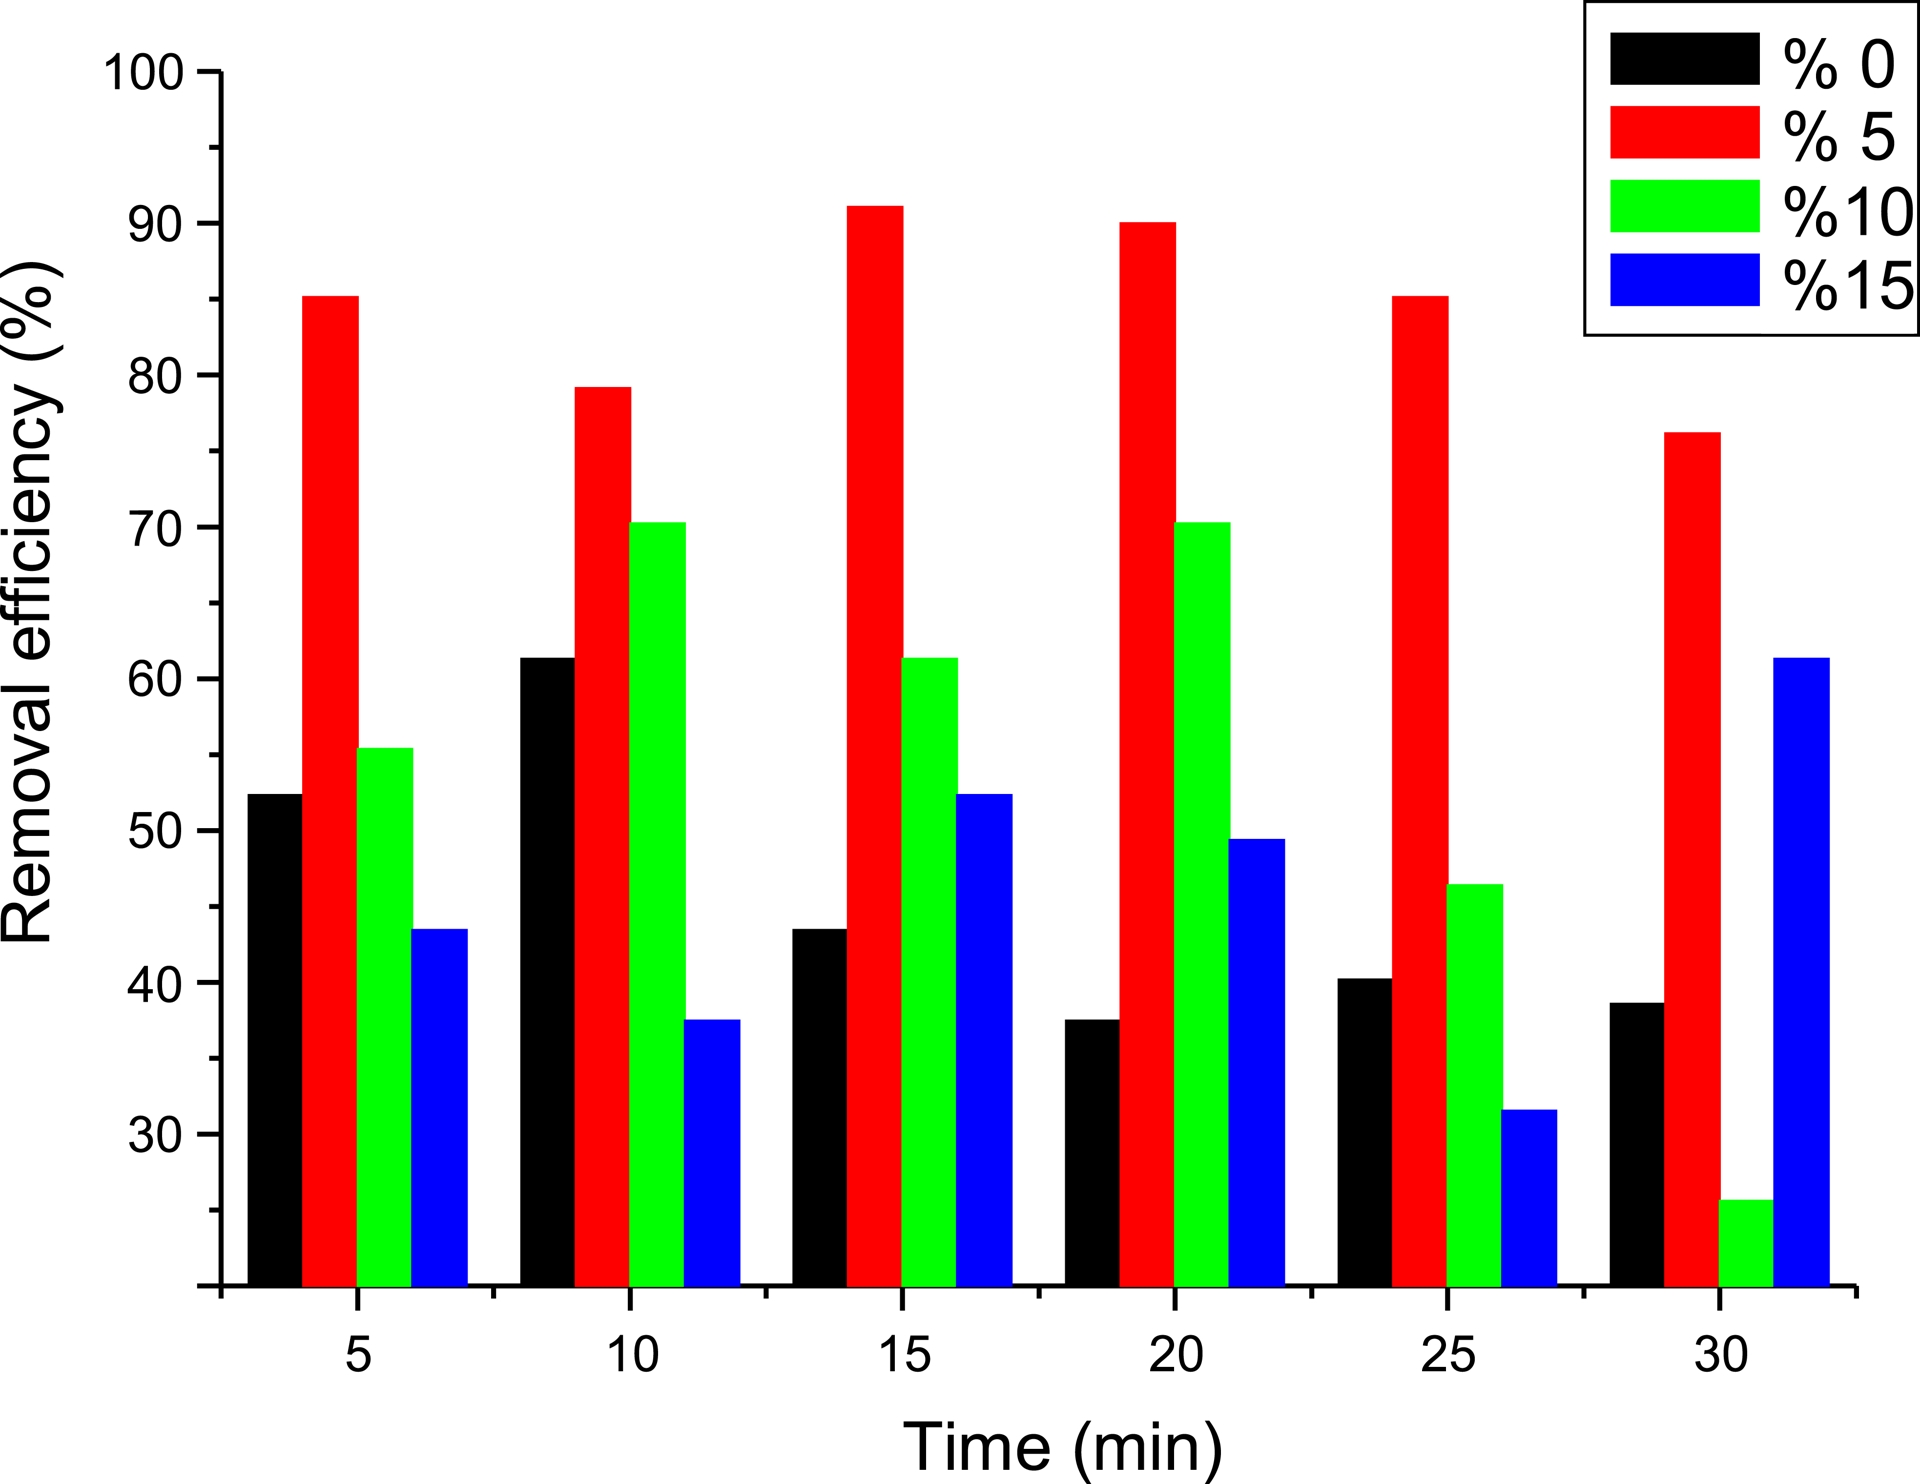
The results show that adsorption efficiency varied according to the GO content in PVC/GO. The highest adsorption rate, 91%, was obtained for PVC/GO 5%. A decrease in adsorption efficiency was observed as the GO content increased. Maximum adsorption of Met was 79, 76, and 46% for PVC/GO 0, 10, and 15%, respectively. This can be explained by GO agglomeration in PVC/GO and overlap of the adsorption sites. Based on these results, PVC/GO 5% was selected as the most effective adsorbent for Met.
4.4. Effect of temperature
One gram of the adsorbent was mixed with a 4 mg/L Met solution under 250 rpm agitation at pH 2 and temperatures ranging from 25 to 40 °C in 5 °C increments.
As shown Figure 7, adsorption efficiency increased with temperature. The maximum adsorption percentages were 75 and 91% at 25 and 40 °C, respectively. These results suggest that the Met adsorption process is favored at higher temperatures and that the diffusion rate of Met molecules into PVC/GO’s pores increases with temperature.
Effect of temperature on metformin adsorption.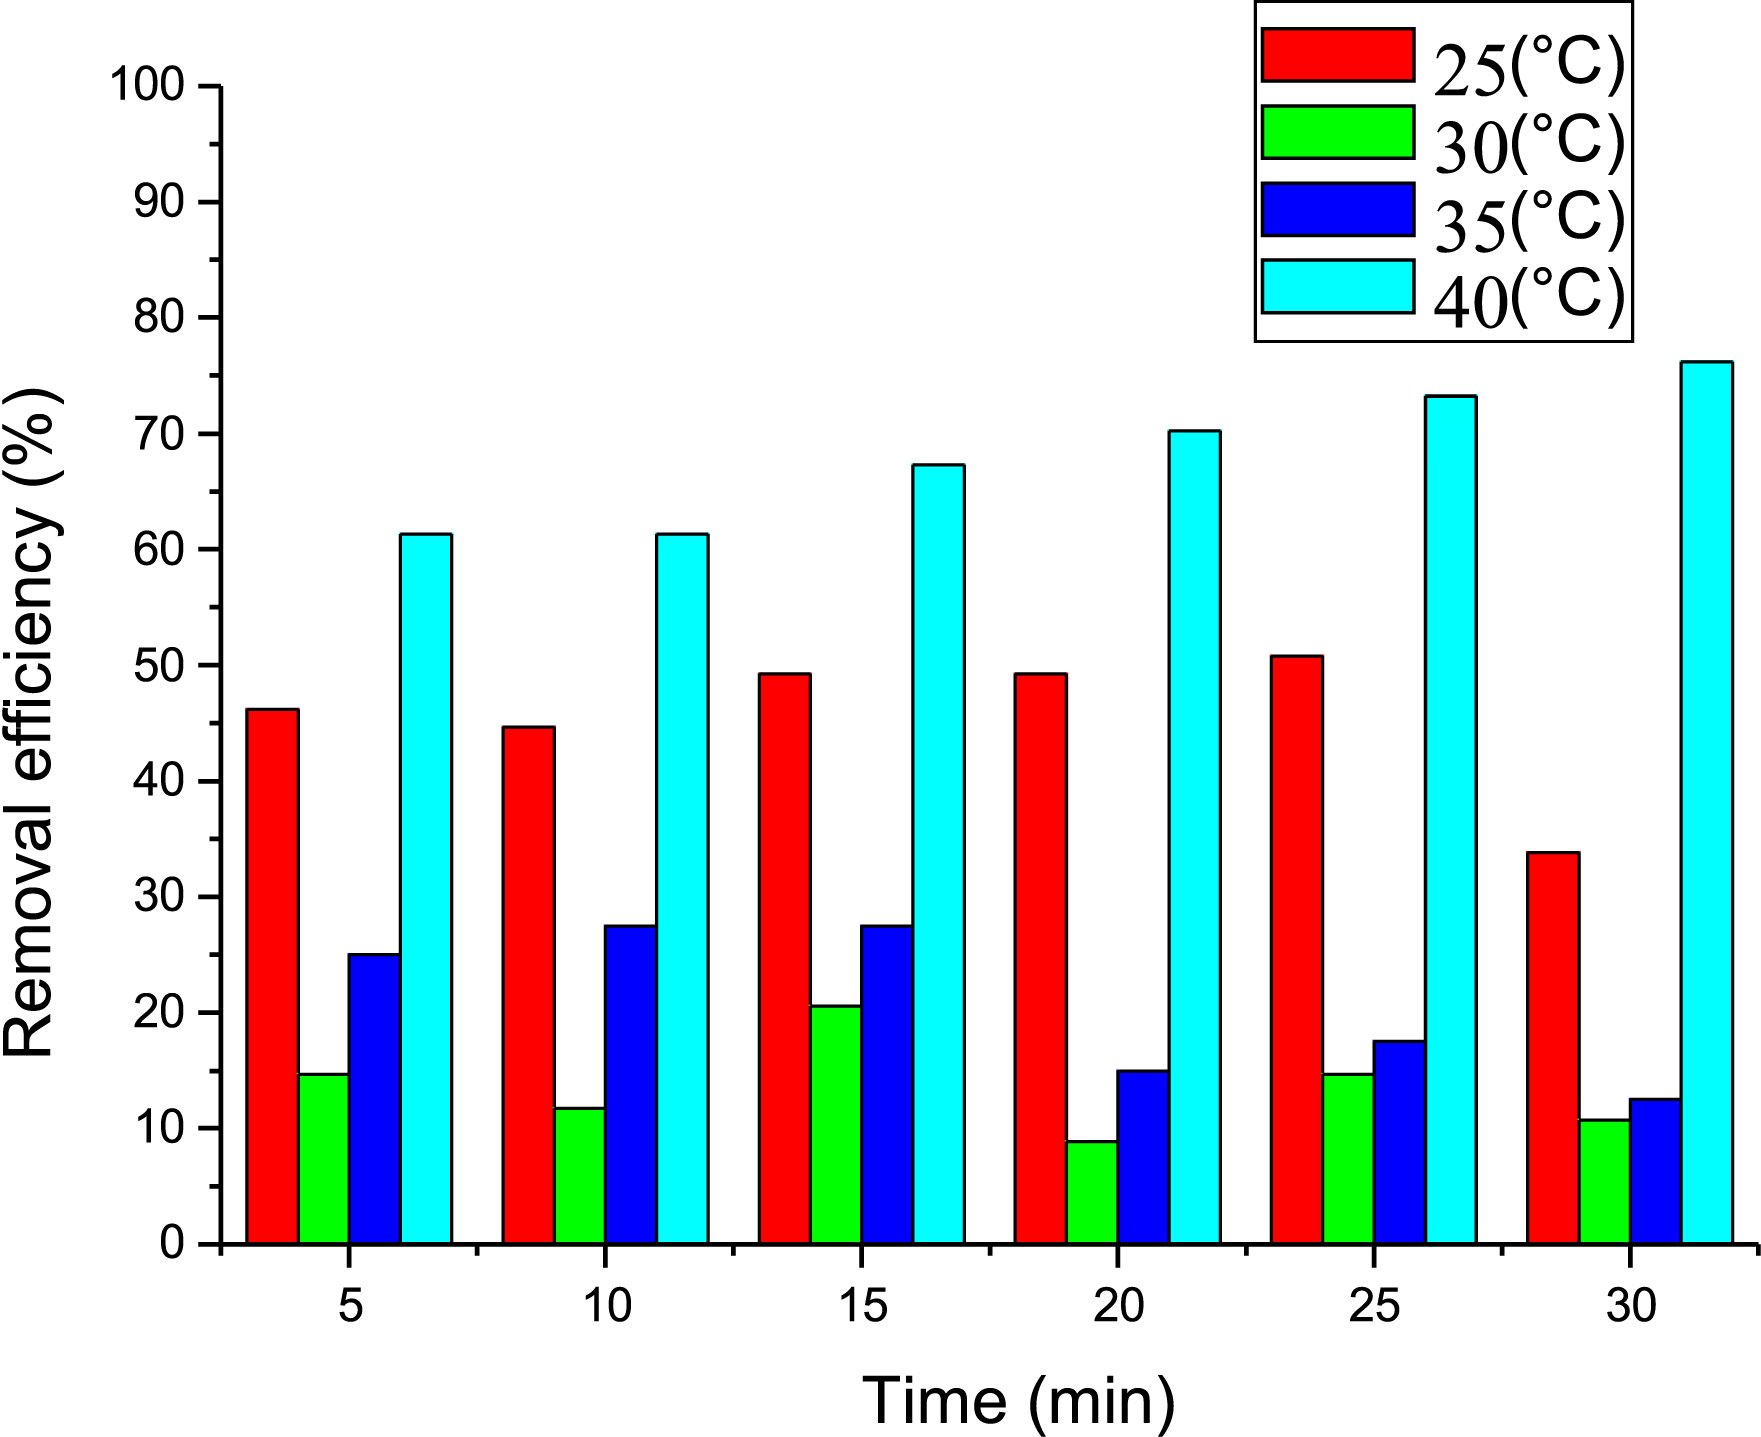
4.5. Adsorption isotherms
We processed the experimental data on the adsorption of Met onto PVC/GO using the linearized equations of the Freundlich and Langmuir models. This allowed us to determine the maximum adsorption capacity and establish which model the adsorption conforms to. The validity of the results depends on the value of the correlation coefficient R2; the closer R2 is to 1, the better the results agree with the considered model. Figure 8 shows the Langmuir isotherm, which is used for monomolecular adsorption of the adsorbate on the adsorbent surface at a constant temperature. The quantity adsorbed at equilibrium is given by the following equation:
| \begin {equation*} \frac {C_{{\mathrm {e}}}}{Q_{{\mathrm {e}}}}= \frac {1}{Q_{\mathrm {m}}\times K_{\mathrm {L}}}+\frac {C_{{\mathrm {e}}}}{Q_{\mathrm {m}}} \end {equation*} |
Adsorption of metformin using Langmuir’s model.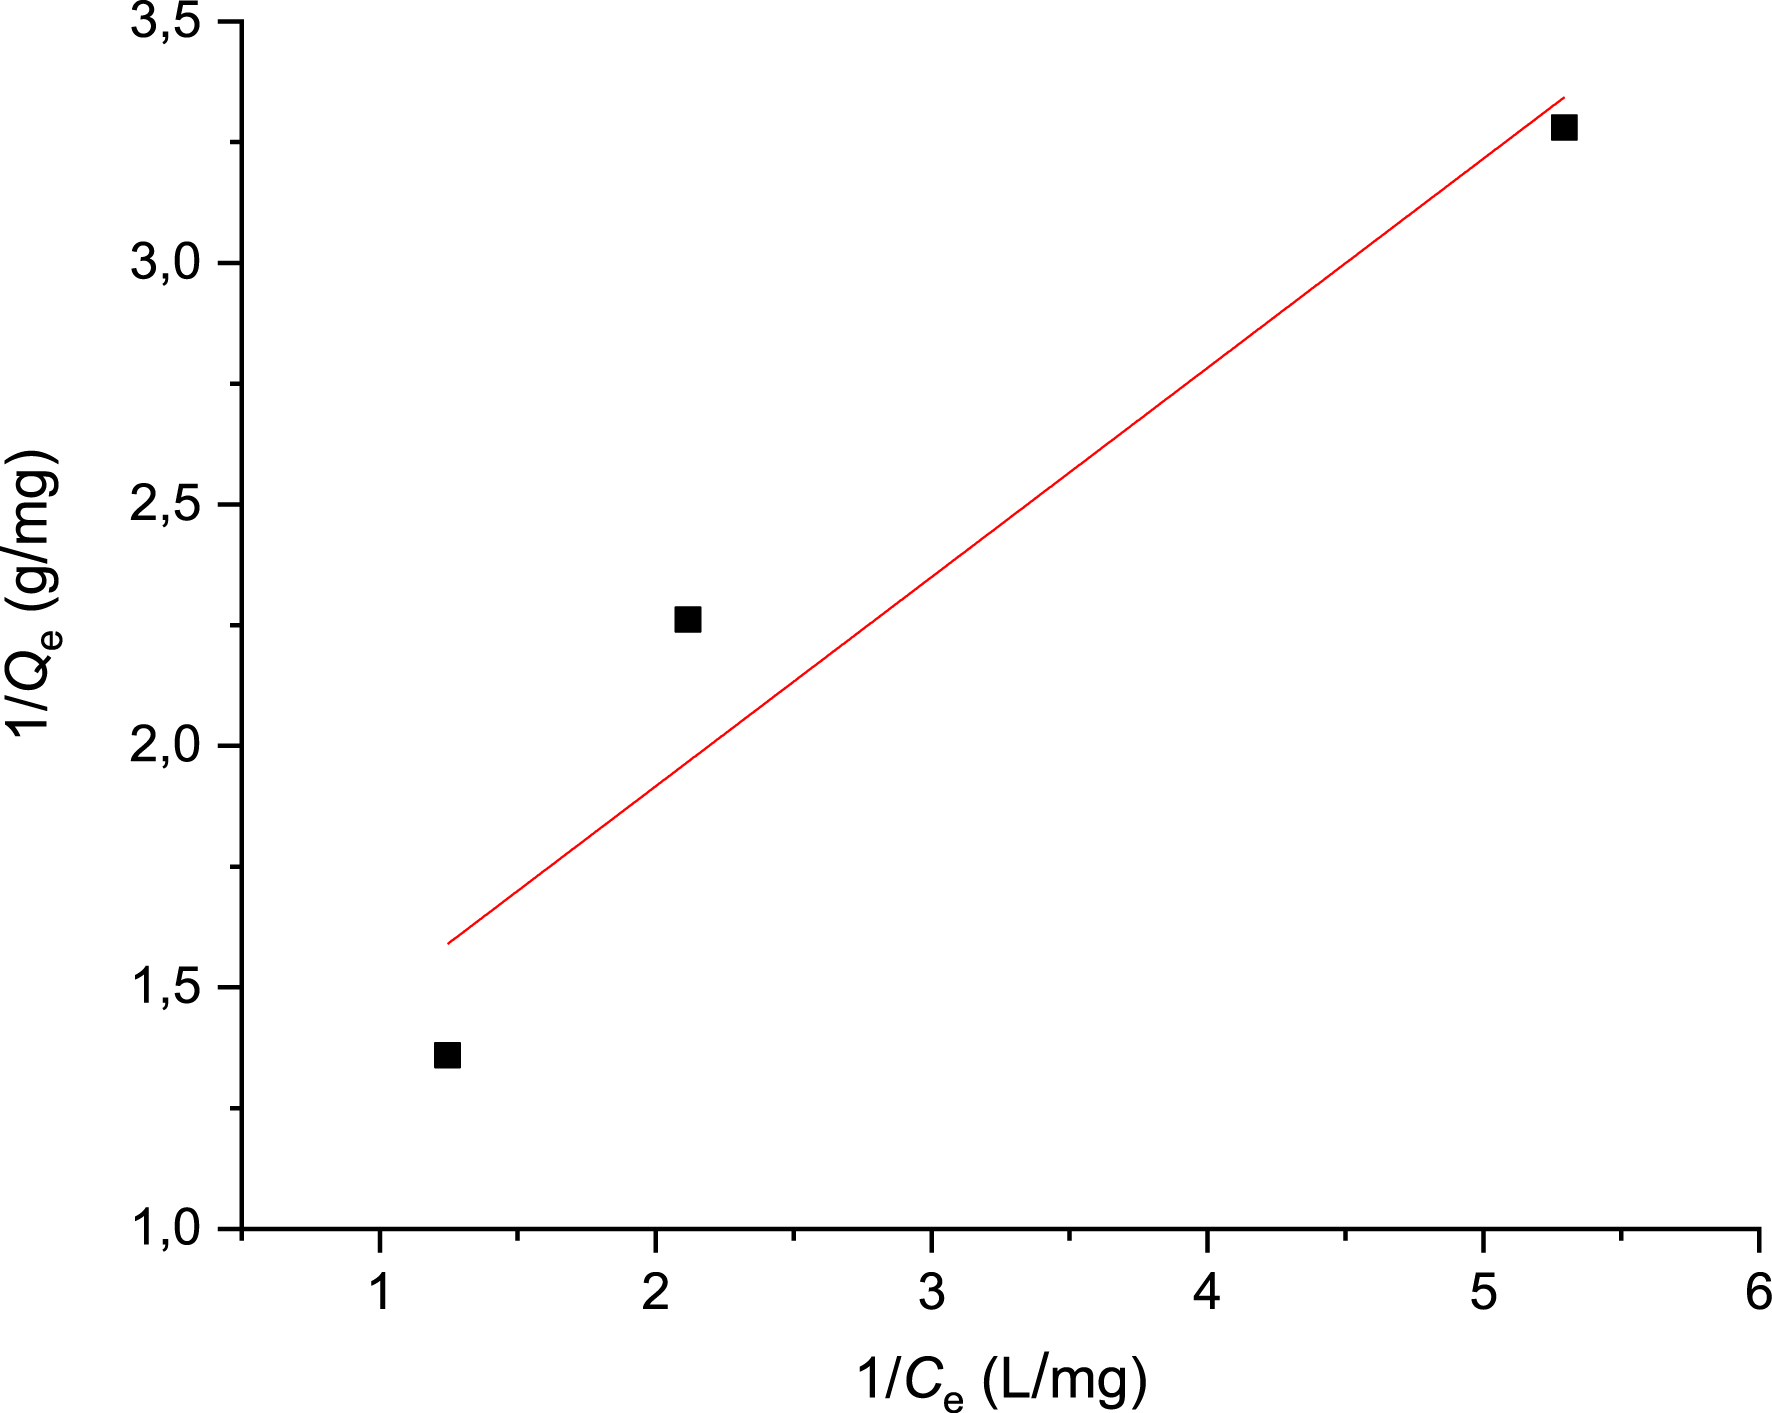
Plotting 1/Qe against 1/Ce produces a straight line with a slope of 1/Qm. This is used to determine the values of the characteristic parameters Qm and KL. The linear transform plot of the Langmuir model is shown in Figure 8, and the isotherm parameters are summarized in Table 2.
Langmuir isotherm parameters for metformin adsorption on PVC/GO
| Adsorbate | Parameters | ||
|---|---|---|---|
| Qm (mg/g) | KL (L/mg) | R2 | |
| Met | 1.75 | 1.16 | 0.97 |
The results show a satisfactory correlation coefficient R2 of 0.97. The Langmuir model parameter KL above 1 indicates that Qm is only reached at low solution concentrations. Therefore, the Langmuir model is well suited to describing the adsorption of Met onto the material under study. The Freundlich isotherm (Figure 9) describes adsorption on heterogeneous surfaces using a multilayer adsorption model. The quantity adsorbed increases with concentration according to the following equation:
| \begin {equation*} \ln Q_{\mathrm {e}}=\ln K_{\mathrm {F}}+\left ( \frac {1}{n}\right ) \ln C_{\mathrm {e}} \end {equation*} |
Plotting ln Qe against ln Ce yields a straight line. The parameters KF and 1/n are deduced from the y-intercept and slope of the line, respectively. Figure 9 shows the results of linearizing Met adsorption on PVC/GO according to this model. Table 3 summarizes the isotherm parameters.
Metformin adsorption isotherm using the Freundlich model.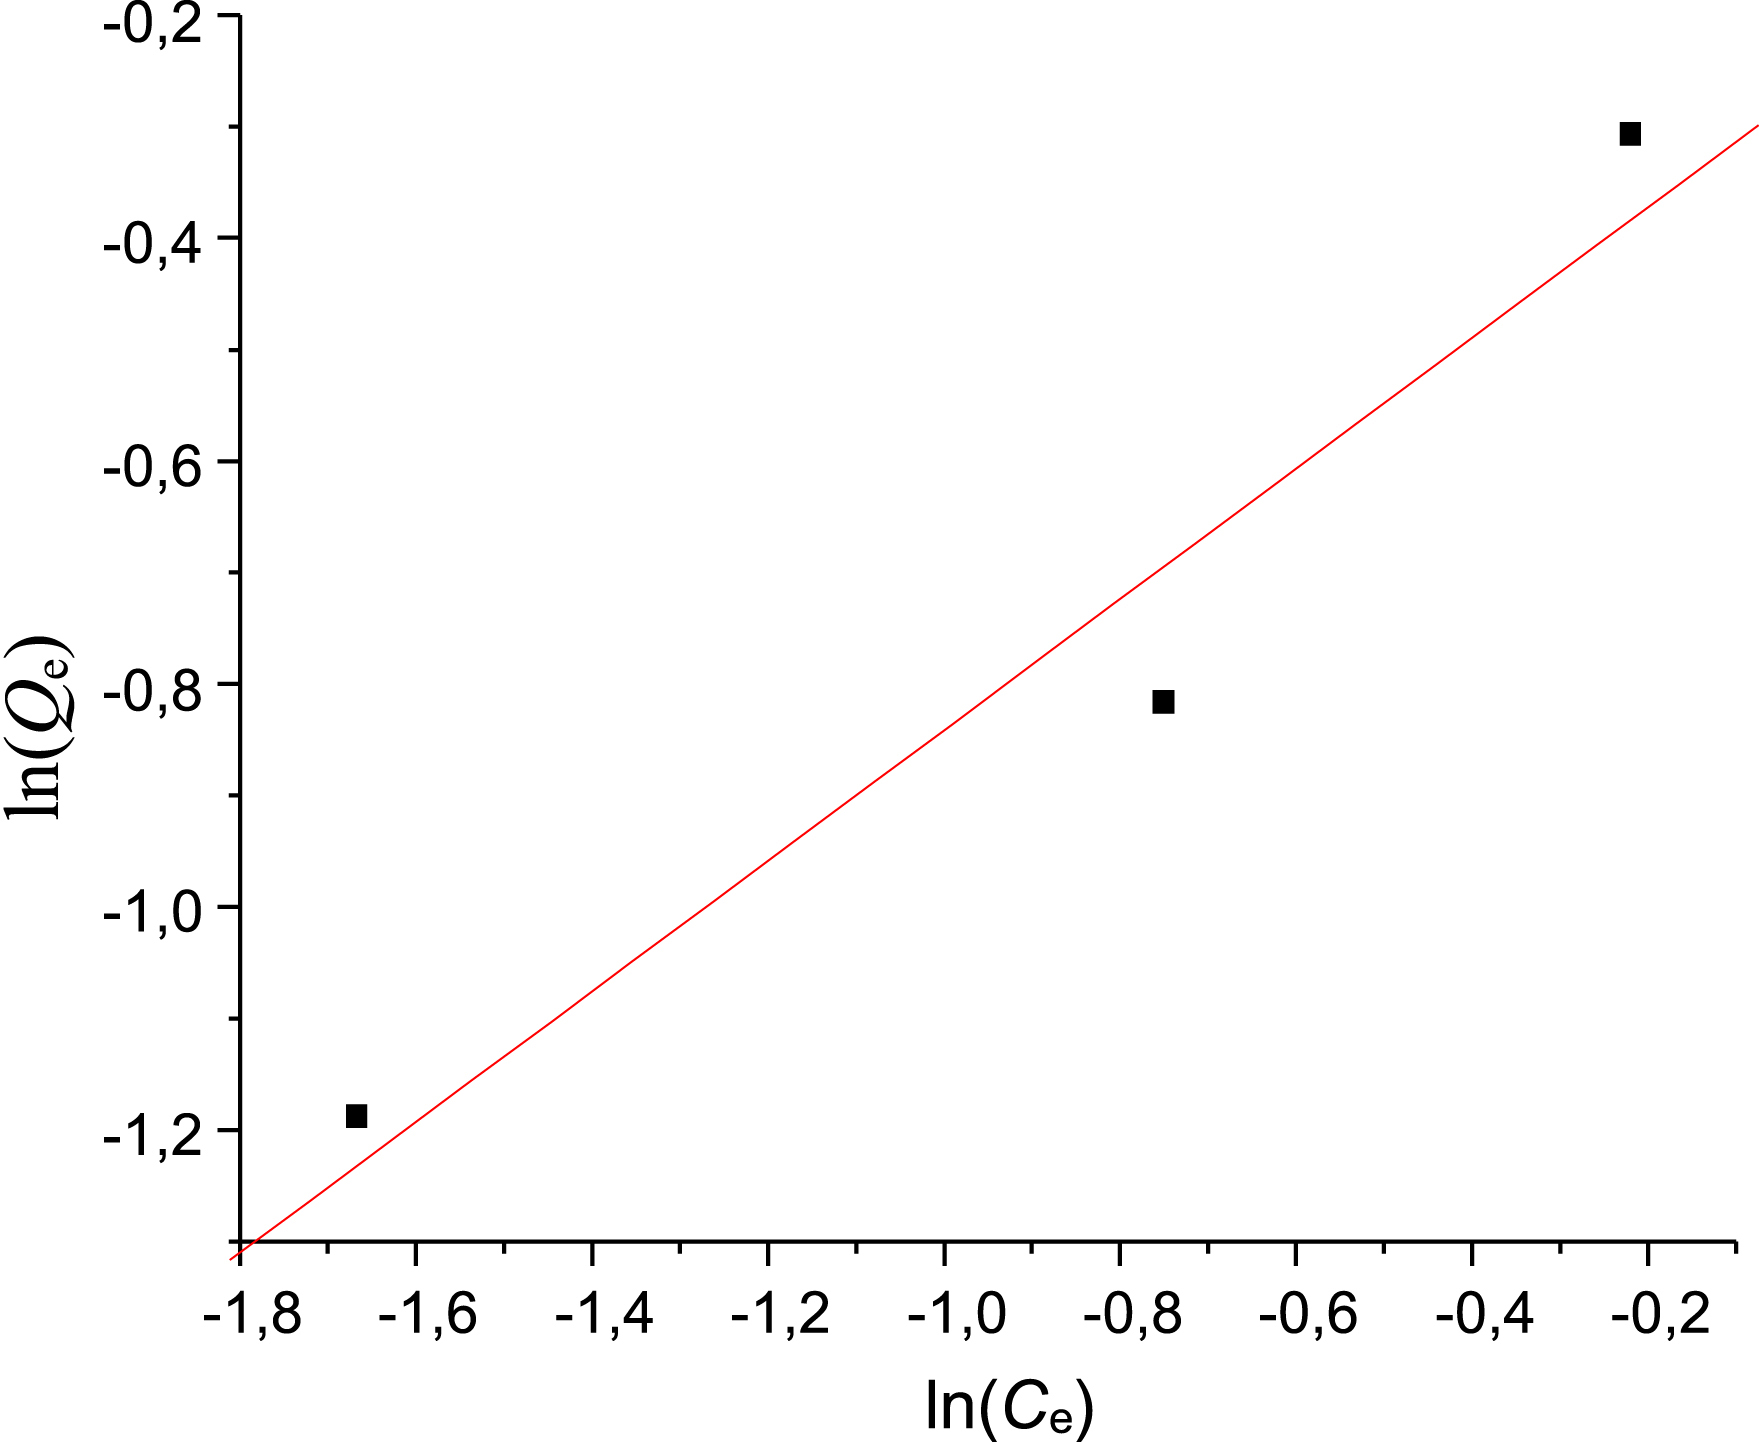
Freundlich model parameters for metformin adsorption
| Adsorbate | Parameters | ||
|---|---|---|---|
| 1/n | KF (L/mg) | R2 | |
| Met | 0.58 | 0.77 | 0.96 |
The results show that the correlation coefficient was satisfactory (R2 = 0.96). The corresponding KF value (0.77 L/mg) is lower than the value obtained for the Langmuir model. From Table 3, n equals 1.72, indicating that adsorption is favorable. The linearity coefficients in previous tables show that the Langmuir model better describes adsorption than the Freundlich model.
4.6. Kinetic study
Modeling experimental kinetic data allows us to determine the Met adsorption mechanism on PVC/GO. In this work, both pseudo-first-order and pseudo-second-order models were tested. In the pseudo-first-order model, plotting ln(Qe−Qt) as a function of time t yields a straight line with a slope of K1 and an intercept of ln(Qe) (Figure 10).
Pseudo-first-order kinetic model of metformin adsorption on PVC/GO.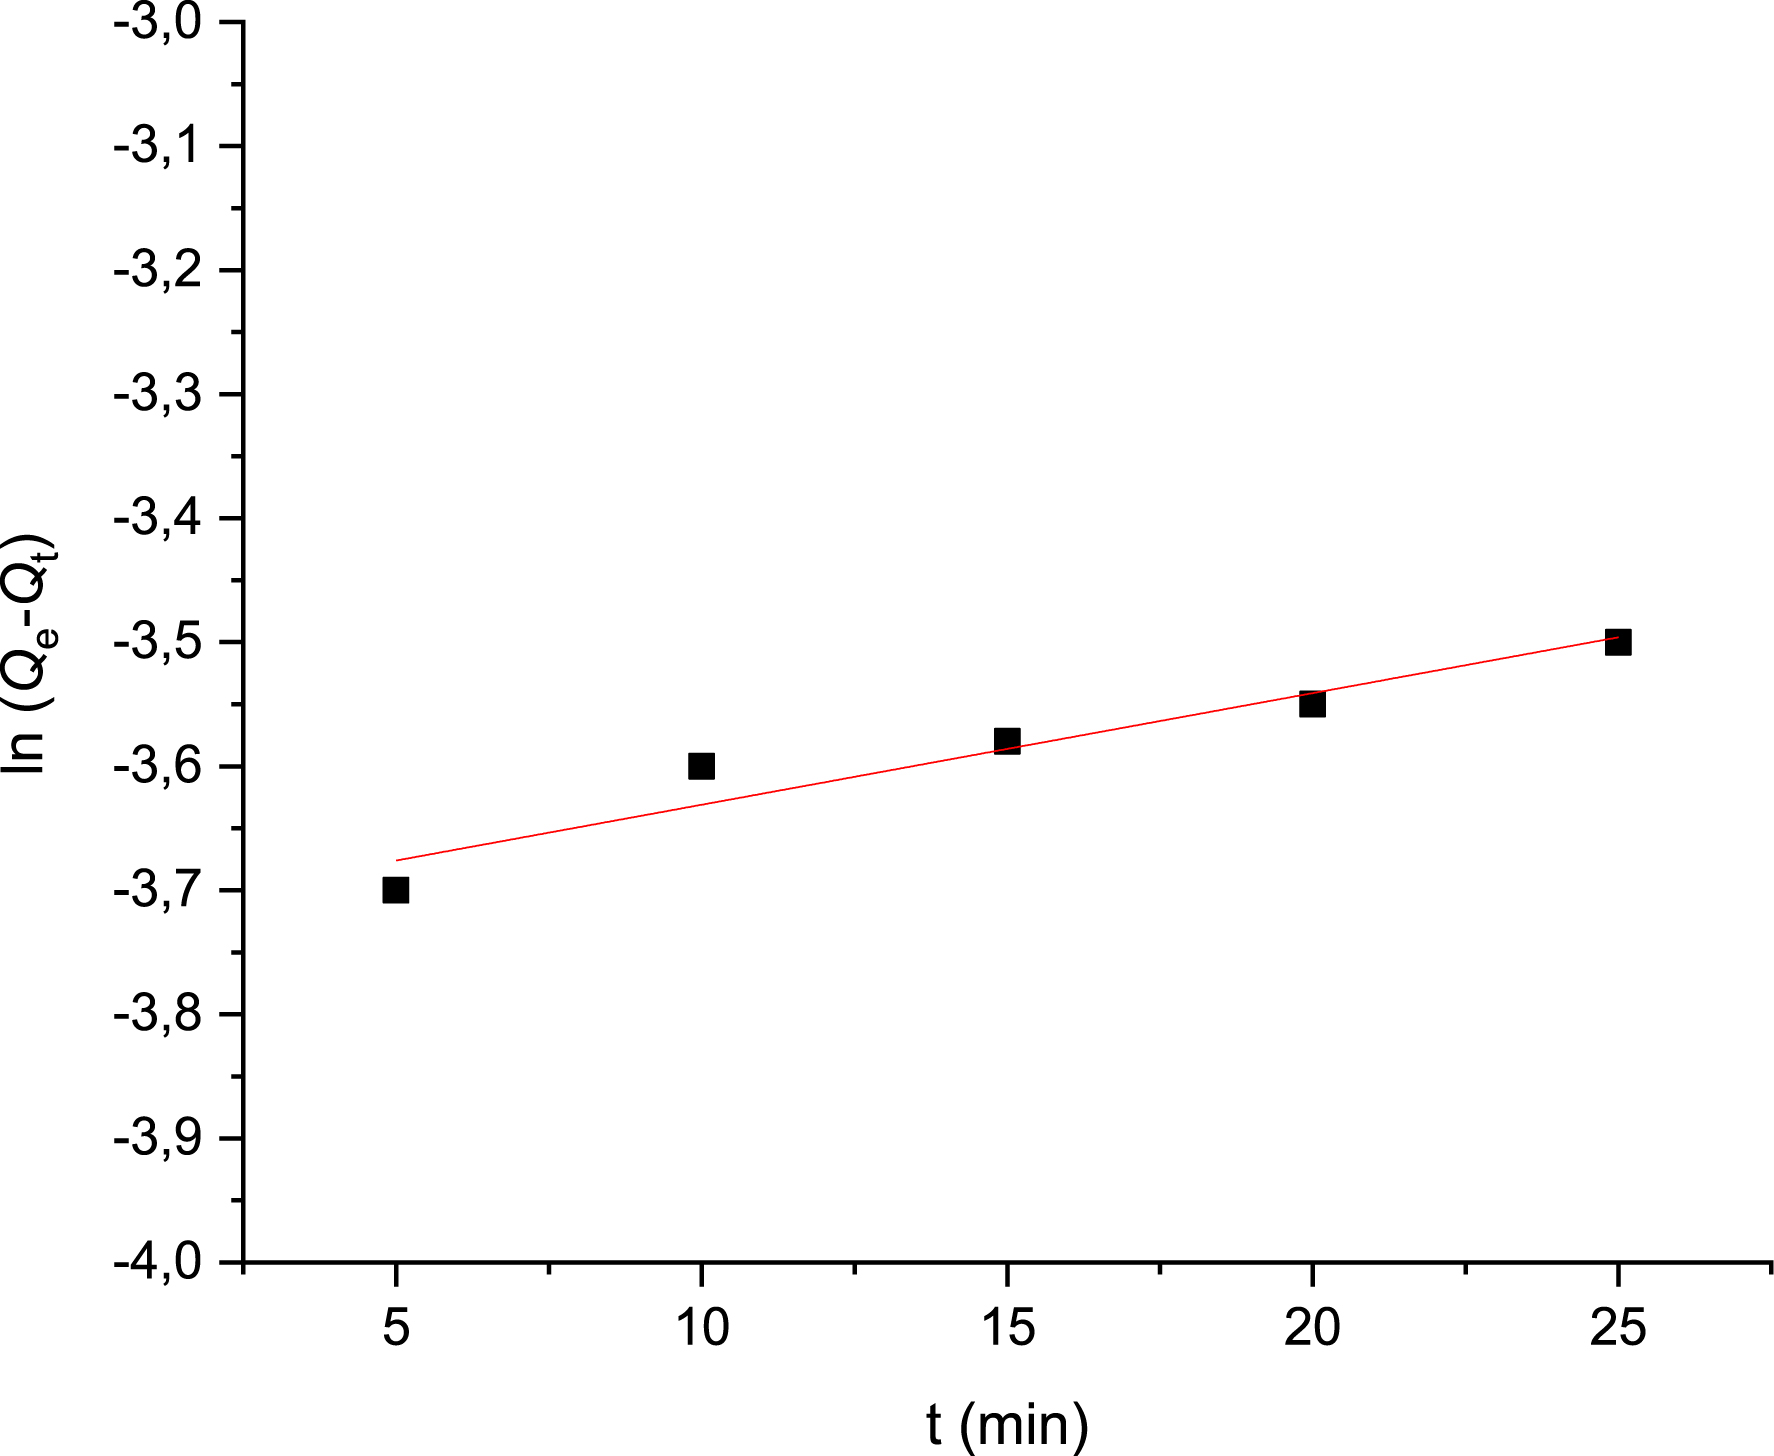
In the pseudo-second-order model, plotting t/Qt as a function of time t yields a straight line with a slope of 1/Qe and an intercept of $1/(K_{2}Q_{\mathrm{e}}^2)$ (Figure 11).
Pseudo-second-order kinetic model of metformin adsorption on PVC/GO.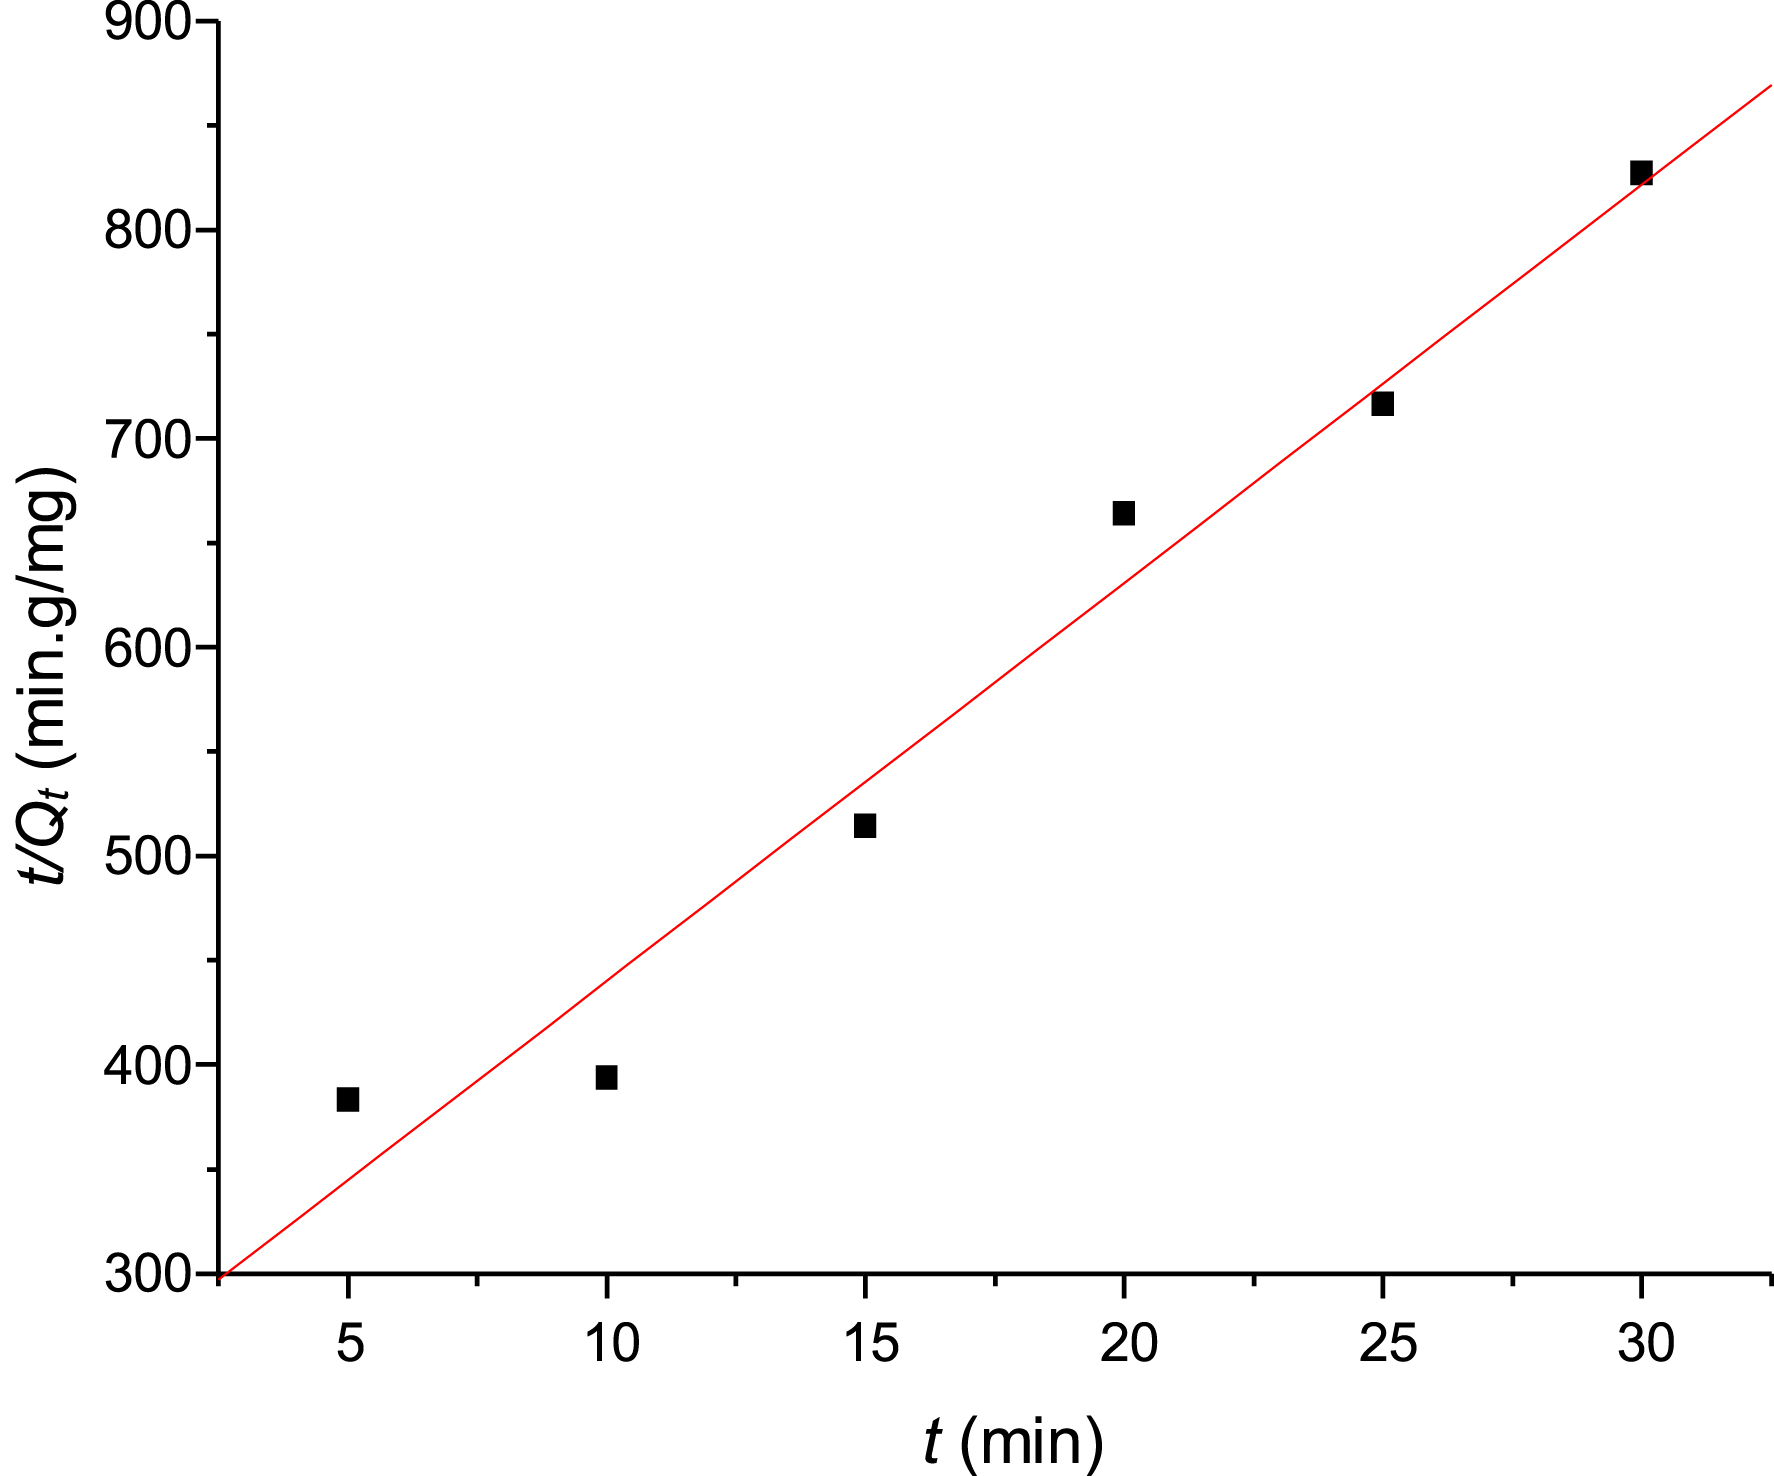
Table 4 summarizes the kinetic parameters obtained by applying the pseudo-first-order and pseudo-second-order kinetic models to the adsorption kinetics.
Kinetic parameters for the adsorption of metformin on PVC/GO
| Pseudo-first-order | |
| K1 (min−1) | 1.28 × 10⁻² |
| Qe (mg/g) | 2.28 × 10⁻² |
| R2 | 0.14 |
| Pseudo-second-order | |
| K2 (mg/g⋅min) | 1.458 |
| Qe (mg/g) | 5.24 × 10⁻² |
| R2 | 0.98 |
Based on the results in Table 4, the pseudo-second-order kinetic model had the highest correlation coefficient (R2 = 0.98) and the value of Qe was 5.24 × 10⁻² (mg/g). These results suggest that the adsorption of Met by PVC/GO is better described by the pseudo-second-order kinetic model. Previous studies on the adsorption of Met have found that the pseudo-second-order model is the most reliable for determining adsorption kinetics. These studies include those on GO [1, 20], Zea mays tassel activated carbon (ZMTAC) [15], chichá-do-cerrado (Sterculia striata) fruit shells [10, 11], activated carbon-based magnetic composites [12], Fe3O4/GO composites [19], chemically treated peach kernels [29], and carboxymethylcellulose-g-poly(acrylic acid-co-acrylamide) hydrogels [13].
4.7. Thermodynamic study
In order to determine the nature of the Met adsorption process, it is necessary to calculate the thermodynamic parameters (ΔG°, ΔH°, and ΔS°). These parameters were calculated using the following expressions: ΔG° = −RTln(Kd) and ΔG° = ΔH° − TΔS°. Combining these two equations yields the linear form of the van ’t Hoff equation: −RTln(Kd) = ΔH° − TΔS° dividing by −RT: ln(Kd) = −ΔH°/RT + ΔS°/R.
The thermodynamic parameters (ΔH°, ΔS°) were calculated from the slope (−ΔH°/R) and ordinate (ΔS°/R) of the straight line shown in Figure 12. The results obtained are presented in Table 5.
Natural logarithm of Kd as a function of 1/T for metformin adsorption.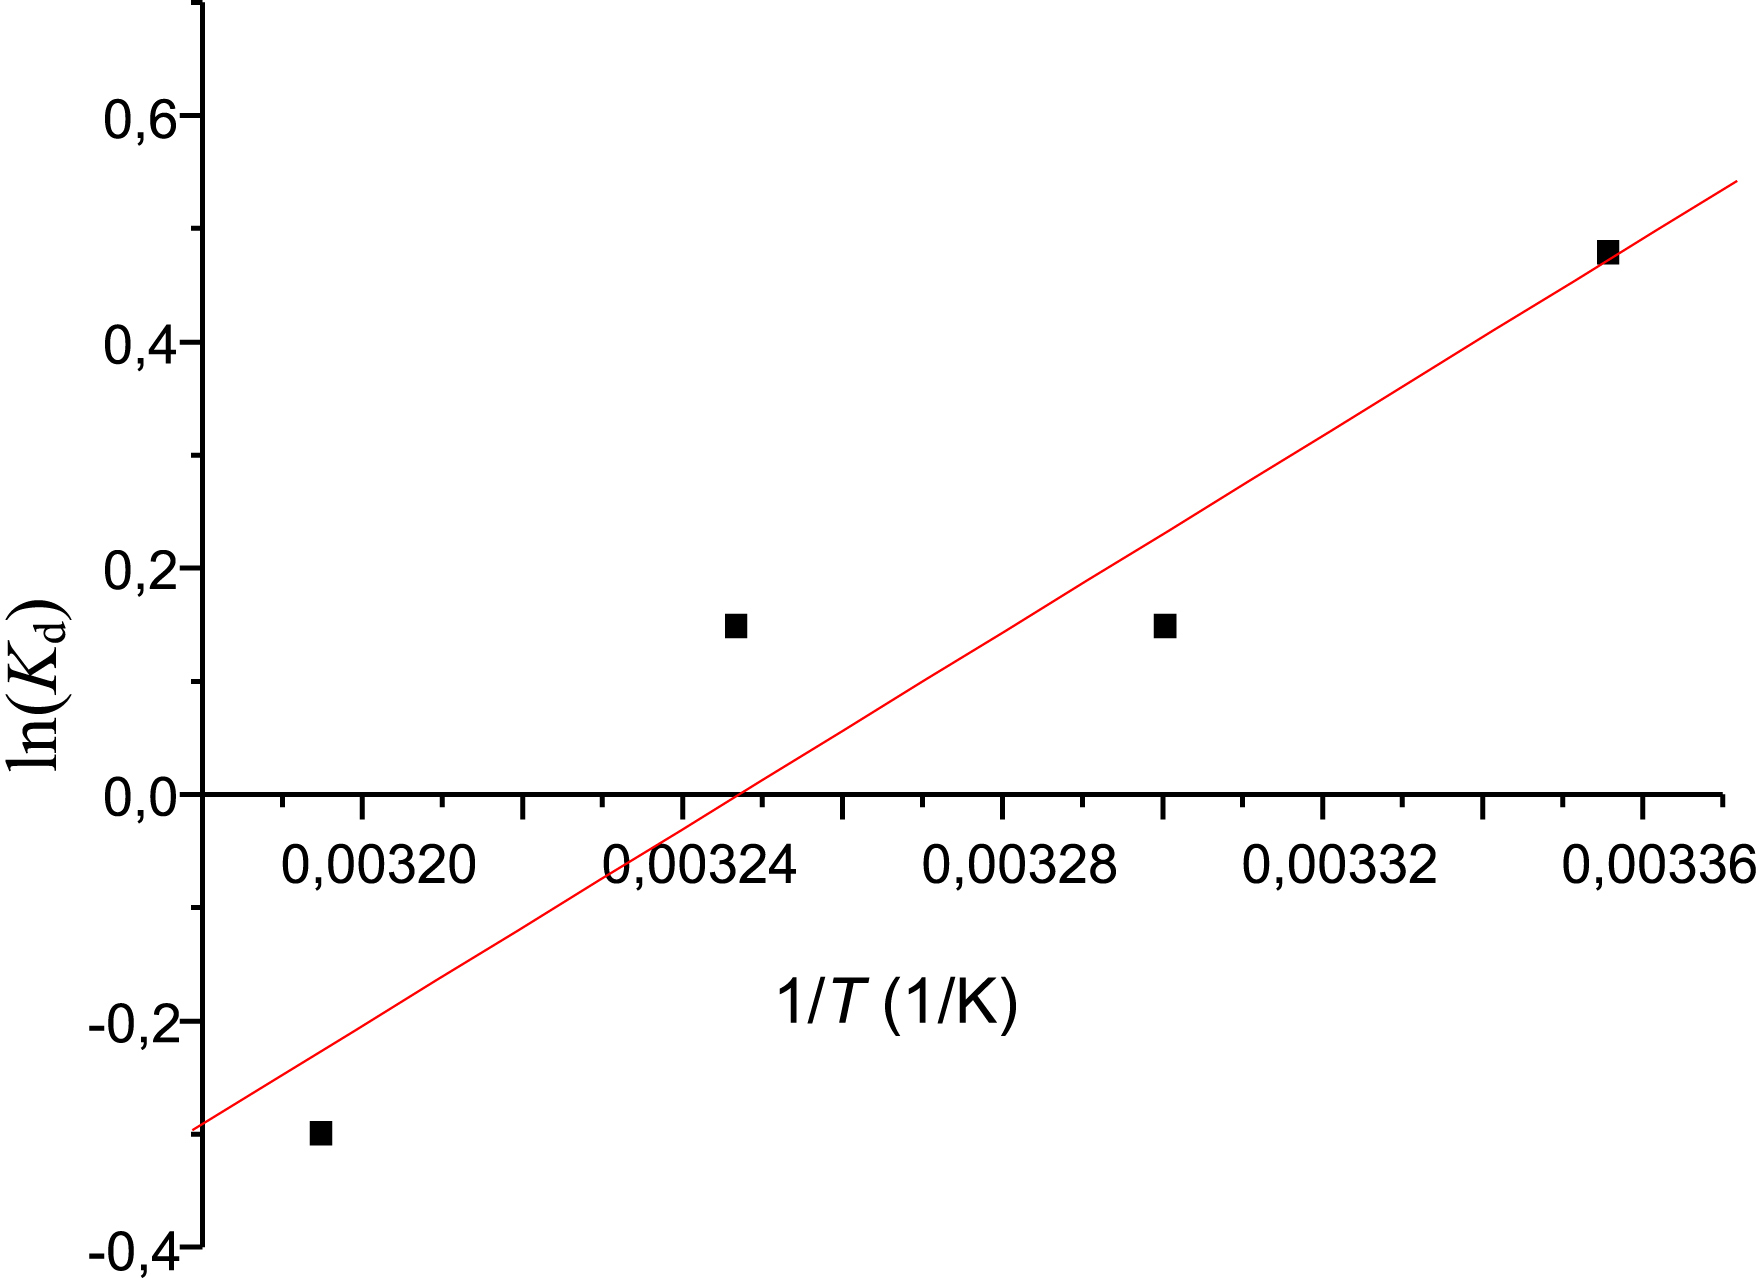
Thermodynamic parameter values for metformin adsorption
| Adsorbent | T (°C) | ΔG° (kJ/mol) | ΔH° (J/mol) | ΔS° (J/mol) |
|---|---|---|---|---|
| Met | 25 | −1.18 | −36.13 | −0.11 |
| 30 | −0.373 | |||
| 35 | −0.380 | |||
| 40 | 0.778 |
As shown in Table 5, the free energy (ΔG°) is negative at 25, 30, and 35 °C (i.e., −1.18, −0.37, and −0.38 kJ/mol, respectively), indicating spontaneous adsorption. The positive value of ΔG° at 40 °C shows that adsorption is not spontaneous at this temperature. The negative enthalpy (−36.13 J/mol) indicates that the adsorption reaction is exothermic. The values of ΔH° and ΔG° (between 1 and −20 kJ/mol) suggest that the adsorption process is physisorption at 25, 30, and 35 °C, which is consistent with the findings of Zhu et al. and Balasubramani et al. [1, 20]. Entropy (ΔS°), related to the system’s order after adsorption, showed a negative value of –0.11 J/mol. This indicates a decrease in randomness at the solid–solution interface, meaning adsorption occurs in more ordered layers on the surface.
5. Conclusion
This study investigated the potential of using a PVC/GO composite membrane as an adsorbent for Met. The adsorbent’s surface was characterized using TGA and FTIR analysis. Adsorption studies were performed on the composite to determine the effects of temperature, pH, contact time, and GO content in PVC/GO. Langmuir and Freundlich isotherm models were applied to the experimental results. A concentration of 4 mg/L was shown to be optimal. The equilibrium time for the PVC/GO composite membrane was 15 min, after which desorption phenomena occurred. Within the investigated range, maximum Met adsorption effectiveness was observed at 40 °C and in an acidic medium (pH 2). The isotherm parameters were well explained by the Langmuir isotherm. At low temperatures, the adsorption process was exothermic and spontaneous. Thermodynamic analysis confirmed that the process was endothermic and non-spontaneous at 40 °C. This means that Met was first adsorbed via physisorption, followed by chemisorption. Based on the results obtained, PVC/GO 5% was identified as an efficient and promising adsorbent for Met.
Acknowledgments
The authors thank Dr Bouriche Sihem from Environmental Engineering Department of Houari Boumadiene University, for providing metformin.
Declaration of interests
The authors do not work for, advise, own shares in, or receive funds from any organization that could benefit from this article, and have declared no affiliations other than their research organizations.