


 CC-BY 4.0
1. Introduction
Various industries such as paper mills, textiles, coatings, and medical treatment have grown significantly to meet the population’s daily living needs. This has led to rapid economic development but at the same time has increased environmental pollution risks [1]. Indeed, high industrialization and intensive use of chemicals and medicines in everyday life have been pointed out as being responsible for the release of a variety of substances into the environment including emerging pollutants [2]. Typical wastewater treatment systems are not capable of sufficiently removing these types of pollutants [3]. Therefore, these emerging pollutants have been found to be present in the receiving environment in several countries [3]. As a consequence, industrial wastewater abound with these pollutants needs to be treated adequately before its discharge into the environment [4]. One of the major sources of pharmaceutical compound discharge into the environment is hospitals due to their related healthcare services. The treatment of water contaminated by emerging pharmaceutical pollutants has been the subject of several studies. They include the use of membrane filtration [5], biodegradation [6], catalytic oxidation or reduction degradation [7], and adsorption [8]. During the last few decades, adsorption technology has become an effective process, recognized for its simplicity, efficiency, and ability to eliminate these pollutants even when present in low concentrations [9]. Many products have been tested as adsorbents, including hydrogels [10], activated carbon [11], zeolites [12], polymers and carbon nanotubes [13], and composites [14]. Iron biocomposites seem to be one of the most interesting adsorbents because of their reuse ability, non-toxicity, high adsorption performance, cost-effectiveness, and especially their ease of separation from aqueous solutions through magnets [4].
Orange fruits are produced in large quantities in the world. In 2023, the overall produced quantity was estimated to be around 70 million tons [15]. For this reason, orange peels (OPs) are considered important kitchen wastes [15]. They represent between 40% and 50% of the total fresh mass of oranges [15]. The global OP-produced waste is estimated to be around 35 million tones/year [16]. The management of these wastes is a key priority for the promotion of circular economy and sustainability concepts. Orange peel wastes along with other kitchen wastes have been pointed out as effective adsorbents of various pollutants due to their specific composition (mixture of lignin, cellulose, and hemicellulose), and also their richness of various functional groups (hydroxyl, carboxyl, carboxyl, etc.) [16]. Orange peel wastes have been used as raw products for the removal of both organic and inorganic pollutants from wastewater including heavy metals [4] and arsenate [17]. To obtain better removal efficiencies, OPs have been turned into activated carbons and used for various organic pollutants involving pesticides [18], dyes [19], and pharmaceuticals [20].
Magnetic adsorbents can be synthesized through different methods including catalysis, hydrothermal, and co-precipitation methods [21]. Depending on the experimental conditions, different iron-based oxides may be formed on the surface of adsorbents. They may include magnetite, hematite [22], and iron (III) oxide-hydroxide [4]. Magnetic biocomposites have become popular due to their effectiveness and also their ease of separation from wastewater by the application of an external magnetic field [23, 24]. Magnetic biocomposites have been applied for nutrient recovery [23] and the removal of heavy metals [23, 24], dyes [23, 24, 25, 26, 27], pesticides [16], and pharmaceuticals [28, 29]. Different pharmaceuticals have been treated with magnetic adsorbents such as amoxicillin [26], tetracycline [27], and ciprofloxacin [28]. Only a few studies have investigated the use of magnetic biocomposites for diclofenac (DFC) removal from aqueous solutions.
Diclofenac, a widely used non-steroidal anti-inflammatory drug, is commonly administered for managing pain and inflammation in both humans and certain animals. Although it is therapeutically effective, DFC presents a significant environmental hazard. Once introduced into the environment, primarily through wastewater, it resists degradation and can accumulate in aquatic ecosystems. Research indicates that DFC is highly toxic to aquatic life, particularly fish, where it may cause severe liver and kidney damage [29]. Furthermore, DFC has been associated with vulture die-offs in South Asia, as the drug can build up in the tissues of treated animals whose carcasses vultures consume [30]. These potential ecological impacts underscore the urgent need for strategies to control and limit the drug’s environmental release.
The efficiency of pharmaceutical removal by magnetic composites depends on not only the feedstock nature and the contents of iron oxides on the adsorbents but also the experimental adsorption conditions. For instance, Rocha et al. [31] showed that the adsorption of DFC and venlafaxine by magnetic activated carbon showed high removal capacity values of 23.7 and 47.7 mg⋅g−1, respectively. Moreover, Frohlich et al. [32] showed that magnetic NiFe2O4/activated carbon exhibited a high capability of 261.4 and 97.8 mg⋅g−1 in removing ibuprofen and ketoprofen, respectively. The physicochemical properties of magnetic biocomposites (Brunauer–Emmett–Teller [BET] surface area and porosity, nature and richness of functional groups, pH of zero-point charge, etc.) seem to highly influence the removal efficiencies of pharmaceuticals from aqueous solutions [31, 32]. For instance, Thi Minh Tam [33] demonstrated that at a pH of 6.5 and a surface area of 70.15 m2⋅g−1, magnetic-gelatin-modified peanut shell biochar had good affinity for the removal of DFC (348.9 mg⋅g−1).
In the current work, we intend to synthesize a magnetic composite from orange peels (orange peel waste [OPC]) and apply it for DFC removal from aqueous solutions under various experimental conditions. The magnetic properties of this composite enable its easy separation from aqueous solutions (after the adsorption process) by the application of an external magnetic field. This is an important advantage in full-scale situations. The novelty of our work lies in the development of a sustainable adsorbent that not only controls a stream of abundant worldwide agricultural waste (OPs) but also maintains its natural functional groups that are critical for binding contaminants. Moreover, the OPC is cheaper and eco-friendlier than typical adsorbents (activated carbons, biochars, etc.). As far as we know, this is the first study dealing with DFC removal from aqueous solutions by using a magnetic composite synthesized from OPs. Therefore, the main objectives of this work are as follows: (i) synthesize a magnetic biocomposite from OPs through the co-precipitation method, (ii) characterize it in detail by using various types of analytical apparatus, (iii) and assess its effectiveness in removing DFC from aqueous solutions under different experimental conditions (contact time, pH, initial concentration, temperature).
2. Materials and methods
2.1. Chemical reagents
Ferrous sulfate (FeSO4⋅7H2O), ferric chloride hexahydrate (FeCl3⋅6H2O, 97%), and sodium hydroxide (NaOH) were purchased from Sigma-Aldrich (Sigma-Aldrich, St. Louis, MO, USA). The anti-inflammatory drug DFC manufactured by the local Tunisian industry is used as an industrial product.
2.2. Preparation of magnetic biocomposite
Orange peels were collected from the Nabeul region (northeast of Tunisia). They were thoroughly washed with deionized water and then dried in an air oven at 60 °C for 24 h. Afterwards, the dried material was crushed and sieved through a 500 μm sieve. The resulting powder is denoted as OP. The OPC was prepared by the co-precipitation method as presented by Toledo-Jaldin et al. [21]. Briefly, 50 mL of ferric chloride (FeCl3⋅6H2O) solution with a concentration of 0.1 M was mixed, by magnetic stirring under nitrogen atmosphere, with 50 mL of ferrous sulfate (FeSO4⋅7H2O) solution with a concentration 0.05 M. Then, 6 mL of sodium hydroxide (NaOH) solution with a concentration of 3.5 M (11 < pH < 12) was added dropwise to this solution. After the addition of NaOH, a mass of 3 g of OP was added to this mixture and agitated with a magnetic stirrer for 40 min. The resulting biocomposite was separated by filtration (0.45 μm), dried at 60 °C for 24 h, and then thoroughly washed with deionized water until obtaining a neutral pH. This solid phase was dried at 60 °C (24 h), and then crushed and sieved through a 160 μm sieve. The obtained OP biocomposite was stored in a air-tight plastic bag for later use.
2.3. Biocomposite characterization
The biocomposite characterization was carried out by using different analytical techniques to assess the following: (i) the morphology and qualitative composition by using scanning electron microscopy (SEM) coupled with energy-dispersive spectroscopy (EDS, Nova NanoSEM 230), (ii) the presence of crystalline phases by using X-ray diffraction (XRD, Davinci D8 diffractometer), (iii) the BET surface area through N2 adsorption/desorption tests (Quantachrome Instruments), (iv) the major functional groups by Fourier transform infrared (FTIR) spectroscopy (PerkinElmer Spectrum 100 Spectrometer), (v) the pH of zero-point charge (pHPZC) according to the pH drift methodology [34] for a range of initial pH values from 2 to 10, and (vi) the thermal decomposition through thermogravimetric measurements (thermogravimetric analysis/differential thermal analysis [TGA/DTG]) by SDT Q600 (TA Instruments).
2.4. Preparation of DFC solutions
The chemical formula of DFC is C14H10Cl2NO2Na (Figure 1). It has a molar weight of 318.13 g⋅mol−1. A stock solution with a concentration of 100 mg⋅L−1 was prepared and used throughout this study to make solutions with desired concentrations. The pH adjustment of aqueous solutions was carried out through 0.1 M of HCl or NaOH solutions. Their measurements were performed by pH-meter Basic 20 (Crison Instruments). The DFC concentrations in the aqueous solutions before and after adsorption were assessed by using a UV–vis spectrophotometer (Thermo Scientific Genesys 10S) at a wavelength of 276 nm.
Structural formula of diclofenac.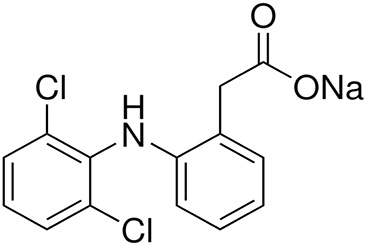
2.5. Adsorption experiments
The OPC efficiency in removing DFC from aqueous solutions was carried out in batch mode by using a 2 L jacketed reactor connected to a Julabo 12 (BICASA) thermostatic bath, allowing one to preset a fixed temperature. These assays consist in agitating, for a given contact time and temperature, 0.1 g of the adsorbent in 100 mL of DFC solutions at specific concentration and pH values. If not specified, these parameters were used during the following experiments: a contact time of 180 min, a DFC concentration of 100 mg⋅L−1, and a temperature of 20 °C. During this work, the effect of various parameters (contact time, initial pH, initial DFC concentrations, and temperature) on the efficacy of DFC removal by the OPC was assessed. The variation ranges of these parameters and especially the initial DFC concentration were carefully chosen on the basis of previous studies [35, 36].
2.5.1. Effect of contact time: adsorption kinetics
The kinetics of DFC removal by the OPC were studied for contact times ranging from 5 to 90 min and initial DFC concentrations of 60, 80, and 100 mg⋅L−1. These experiments were carried out for a temperature of 20 °C and at a non-adjusted pH value (around 5.5). The adsorbed quantity of DFC at a given time t, denoted by qt (mg⋅g−1), was calculated by the following formula:
| (1) |
Kinetic models applied in the elimination of diclofenac by OPC
| Model | Equation | Linearized equation | Plot |
|---|---|---|---|
| Pseudo-first-order | qt = qe(1 − e−k1t) | ln(qe − qt) = lnqe − k1t | qt vs. t |
| Pseudo-second-order | qt vs. t | ||
| Elovich | qt vs. ln(t) | ||
| Intraparticle diffusion | qt vs. t |
qe is the DFC adsorbed at equilibrium (mg⋅g−1), qt is the DFC adsorbed at a given time t (mg⋅g−1), k1 is the pseudo-first-order rate constant (min−1), k2 is the pseudo-second-order rate constant (g⋅mg−1⋅min−1), 𝛼 is the initial adsorption rate (mg⋅g−1⋅min−1), 𝛽 is the extent of surface coverage (mg⋅g−1), and ki is the intraparticle diffusion rate constant (mg⋅g−1⋅min−1).
The agreement between the measured (qt,exp) and calculated theoretical (qt,theo) adsorbed quantities was determined on the basis of the determination coefficient and the mean average percentage error (MAPEkinetic) [37]:
| (2) |
During this work, all tests were repeated thrice and the average values were given. The standard deviation of all tests was less than 5%.
2.5.2. Effect of initial pH
The effect of initial pH values on the removal of DFC by the OPC was assessed for values varying between 2 and 10. This range involves both acidic and alkaline conditions. These assays were performed for fixed contact time, initial DFC concentration, adsorbent dose, and temperature of 3 h, 10 mg⋅L−1, 1⋅g⋅L−1, and 20 °C, respectively. The DFC adsorbed amount (qe (mg⋅g−1)) and the corresponding removal yield (R (%)) were calculated by the following formulas:
| (3) |
| (4) |
2.5.3. Isotherm modeling and adsorption thermodynamic study
The multiple point method was applied to study the adsorption isotherms of DFC on OPC at three different temperatures: 30, 40, and 50 °C. This work was carried out for initial DFC concentrations varying between 10 and 100 mg⋅L−1 and a contact time of 3 h. Moreover, the initial pH was not adjusted (5.5). The experimental data of the DFC isotherms were fitted with four well-known models: Langmuir, Freundlich, Temkin, and BET, which is commonly used to analyze gas adsorption on solid surfaces. The equations of these models and the definitions of their parameters are given in Table 2 [38].
Isotherm models used to study the removal of diclofenac by OPC
| Model | Original equation | Linearized equation | Plot |
|---|---|---|---|
| Langmuir | vs. Ce | ||
| Freundlich | Ln(qe) vs. ln(Ce) | ||
| Temkin | qe = B1 ln(KTCe) | qe = B1 ln(Kt) + B1 ln(Ce) | qe vs. ln(Ce) |
| BET | vs. Ce |
Ce is the DFC concentration at equilibrium (mg⋅L−1), Cs is the DFC concentration at the multilayer (mg⋅L−1), qe is the adsorbed amount of OPC at equilibrium (mg⋅g−1), qm is the maximum amount of DFC adsorbed on OPC (mg⋅g−1), KL, KF, and KT are the adsorption constants of Langmuir, Freundlich, and Temkin models, respectively, K1 (L⋅mg−1) is the BET model equilibrium adsorption constant of the first layer, K2 is the BET model equilibrium adsorption constant of the subsequent layers, 1/n is the Freundlich constant depicting the adsorption intensity, Bl is R/bT with R being the gas constant (8.314 J⋅mol−1⋅K−1), T is the temperature (K), and bT is the constant related to the heat of adsorption (J⋅mol−1).
As for the kinetic modeling, the suitability of the isotherm experimental data fitting with these models was judged based on the determination coefficients between the experimental and predicted curves as well as the mean average percentage error (MAPEisotherm) as follows:
| (5) |
To gain a better understanding of the DFC removal process, three thermodynamic parameters (Gibbs free energy [ΔG]), enthalpy [ΔH], and entropy [ΔS]) were calculated according to Equations (2)–(4) and the Van’t Hoff plot giving the variation of ln(Kd) as a function of 1/T [34, 35, 36]:
| (6) |
| (7) |
| (8) |
3. Results and discussion
3.1. Material characterization
3.1.1. Structural properties
3.1.1.1. SEM/EDS analysis
The SEM analysis shows a complicated surface microstructure with much roughness for OP (Figure 2a). In contrast, the OPC exhibits a distinct surface morphology with more wrinkles (Figure 2b). This may be attributed to the deposition of Fe3O4 on its surface [14]. Moreover, the EDS analyses show that the chemical composition of the OP and OPC mainly contain carbon (C), oxygen (O), and calcium (Ca) as reported in other studies [31, 38] while iron (Fe), sodium (Na), and chloride (Cl) were only found in the OPC. The presence of these elements is attributed to both the formation of iron-based materials and the deposition of elements from the chemical reagents used during the magnetization process (FeCl3, 6H2O, FeSO4, 7H2O, and NaOH). Similar results were found by Praipipat et al. [4] in the removal of lead by OP.
SEM/EDS analysis of orange peels (a) and orange peel composite (b).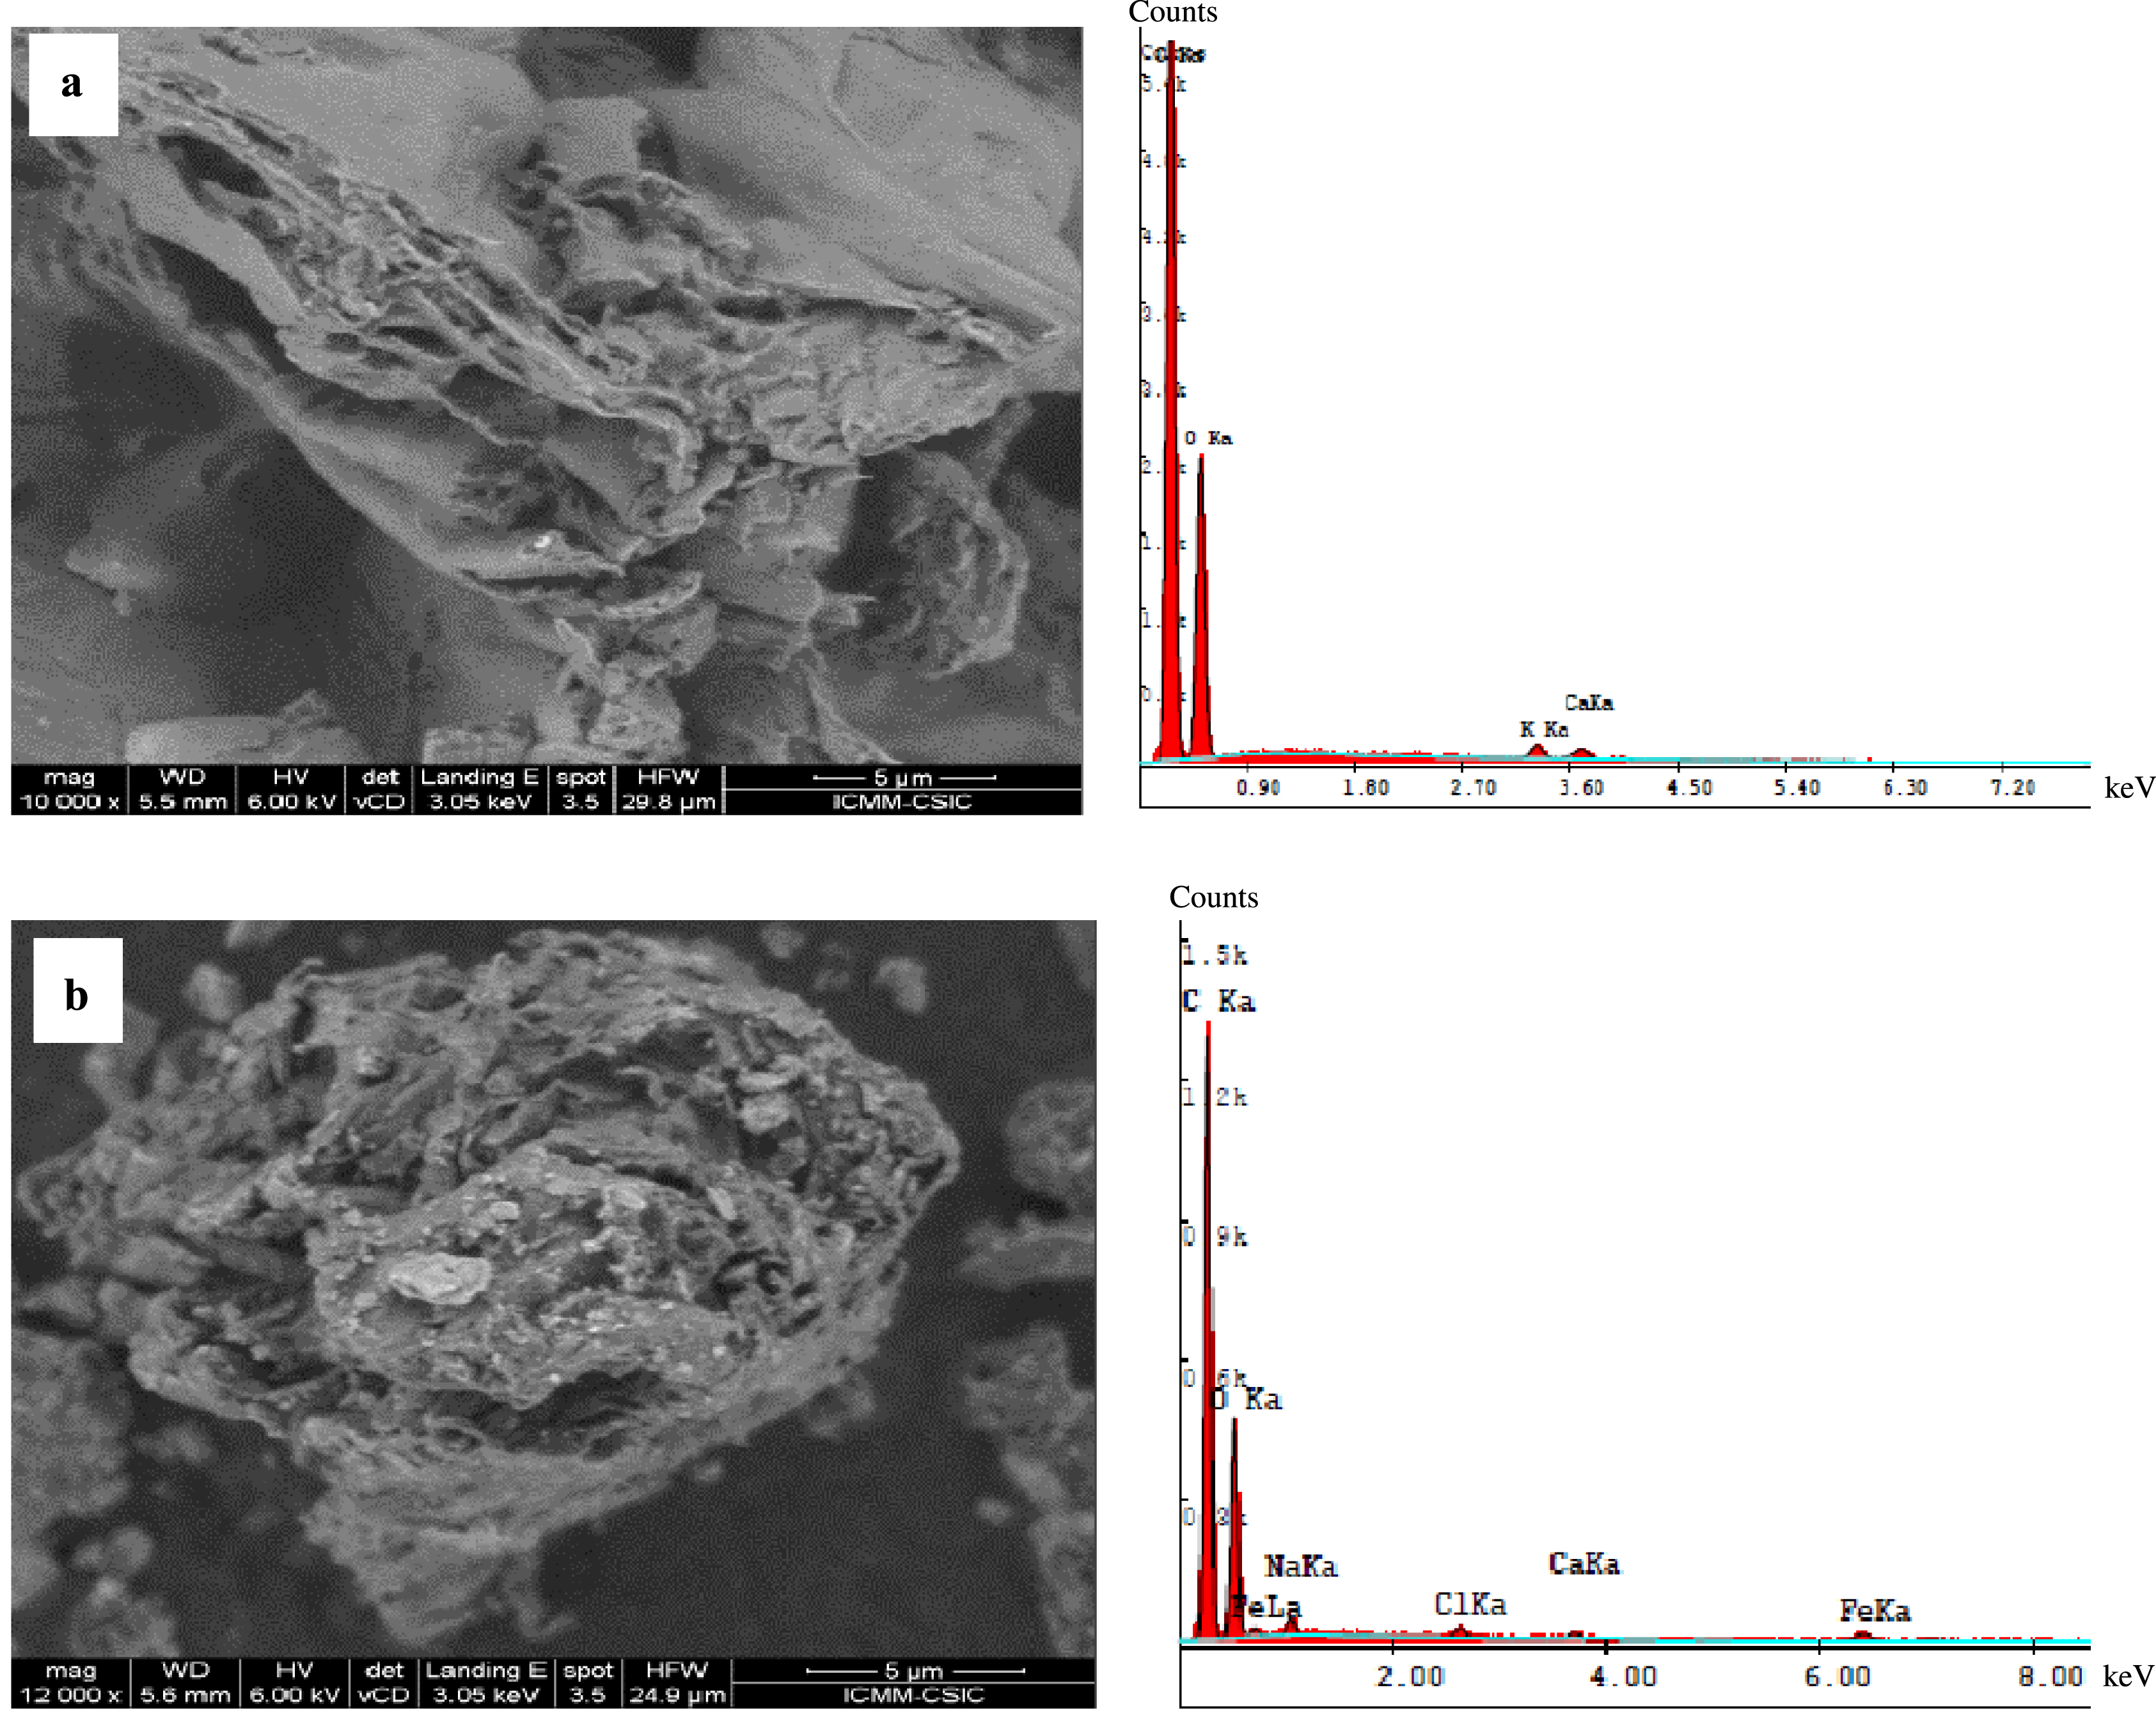
3.1.1.2. XRD results
The XRD analysis shows that the OP does not have crystalline phases (Figure 3a) [39]. The OPC shows the presence of magnetite (Fe3O4) at 2𝜃 values of 30.5°, 35.7°, 43.5°, and 57.7° (Figure 3b). They correspond to crystal plane index values of (220), (331), (400), and (511) of Fe3O4, respectively, according to the JCPDS No. 75-0449 standard XRD pattern of Fe3O4 [14]. These results show that the OPC contains Fe3O4 with an inverse spinel structure [40], indicating that the co-precipitation preparation method does not have any effect on changing the Fe3O4 phase in the OPC. A similar result was reported for a biocomposite prepared from OP by the co-precipitation method [14]. The peak existing at 2𝜃 of 24.6° corresponds to amorphous carbon [41].
XRD pattern of orange peels (a) and orange peel composite (b).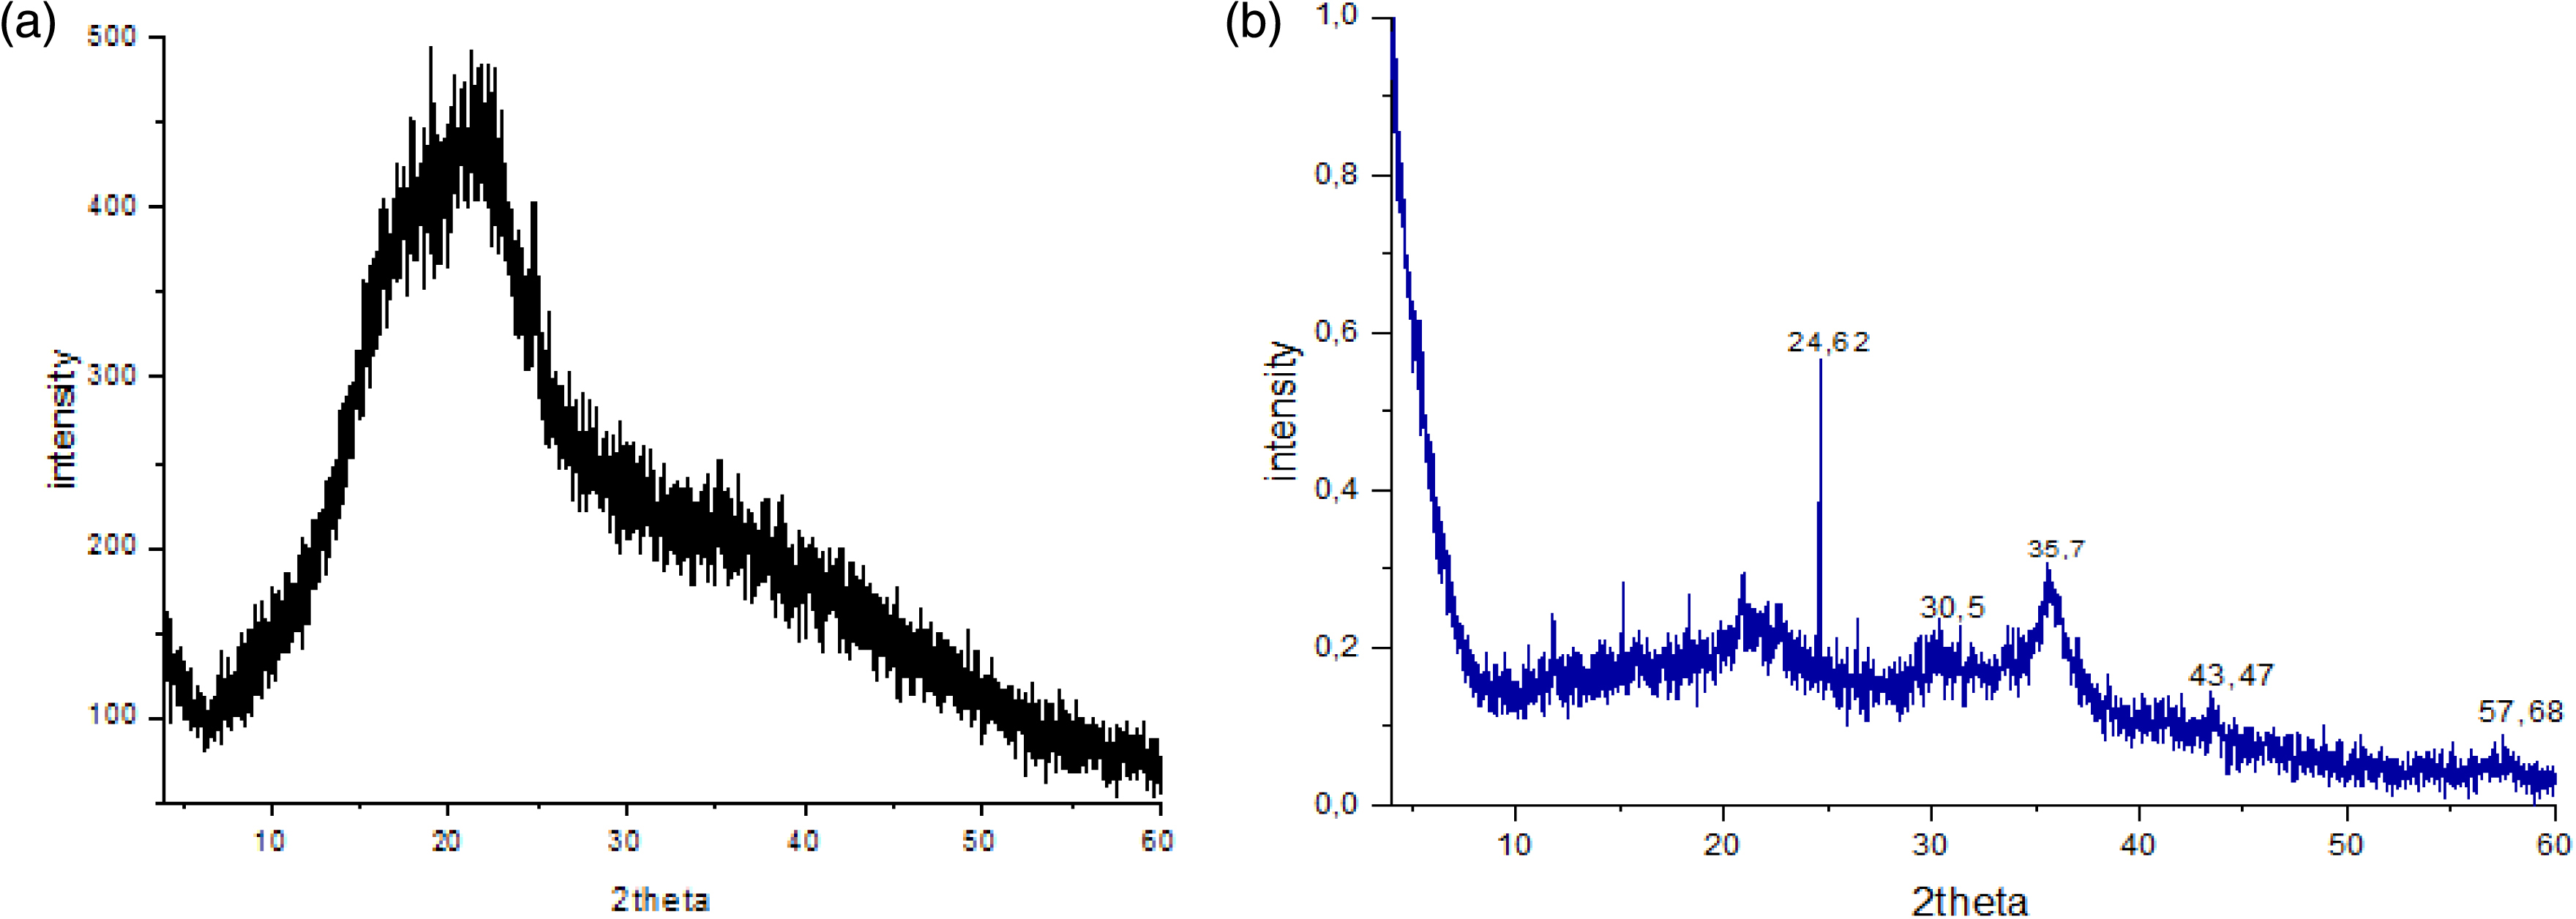
3.1.2. Textural properties
3.1.2.1. BET analysis
The specific surface areas of OP and OPC were estimated to be 64.4 m2⋅g−1 and 25.8 m2⋅g−1, respectively. The net reduction of this parameter after the magnetization process can be attributed to pore blockage caused by magnetite deposition. An equivalent finding was reported in previous studies [42, 43].
3.1.3. Surface chemistry properties
3.1.3.1. FTIR analysis
The FTIR spectra of OP and OPC showed the presence of several peaks (Figure 4). It can be clearly seen that most of the peaks exist in both OP and its magnetized form. Indeed, the highest and largest peak at 3418 cm−1 for OP and at 3416 cm−1 for OPC is related to the O–H stretching vibrations of cellulose, hemicellulose, pectin, lignin, and absorbed water [14]. The bands measured at 2939 cm−1 and 1384 cm−1 for OP and 2927 cm−1 and 1324 cm−1 for OPC correspond to the C–H stretching and bending vibrations of methyl, methylene, and methoxy groups [14]. The peak at 1743 cm−1 for OP can be assigned either to the elastic oscillation of the C–O bond due to non-ionic carboxyl groups (–COOH, –COOCH3) or to the carboxylic acids or esters in pectin [25]. The peak at 1636 cm−1 for OP and 1626 cm−1 for OPC may be related to the bond of the benzene ring structure in lignin [44]. In addition, the band at 1051 cm−1 for OP and 1.074 cm−1 for OPC is related to the glycosidic (C–O–C) bond existing mainly in cellulose, hemicellulose, and pectin [44]. The conservation of all these bands is due to the fact that co-precipitation is a smooth method and does not affect the original functional groups observed in the OP [45]. The magnetization process has induced the appearance of a new peak at 590 cm−1, which is attributed to the Fe–O group [46]. This finding indicates that iron oxides were deposited on the surface of the OPC. Similar results were reported by Zhao et al. [14] and Praipipat et al. [4] when they produced iron-doped materials from OPs.
FTIR spectra of orange peels and orange peel composite.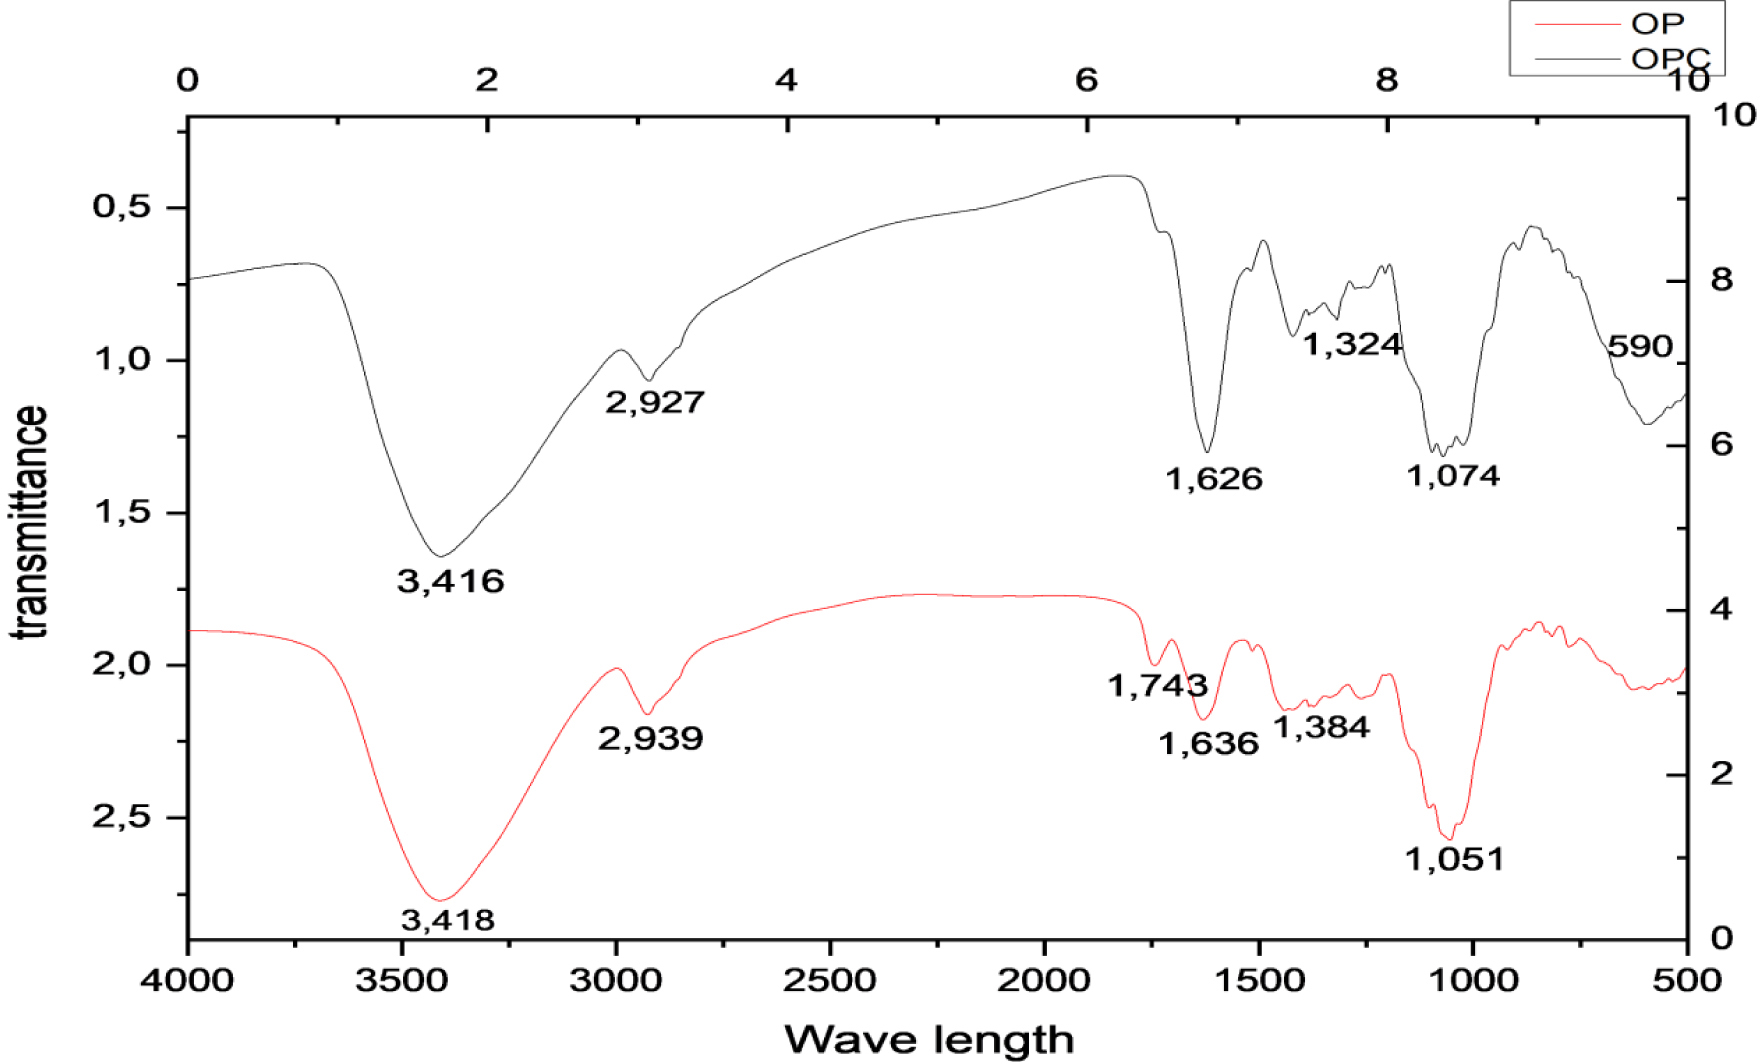
3.1.3.2. pH of zero-point charge
The pHPZC value of the OPC was estimated by the pH drift method to be 5.8. This value is close to those found for MAC-CP (magnetic activated carbon from pulp and paper mill) [31] and MNP/OPP (magnetic nanoparticles from OP powder) [40]. This implies that at pH values lower than 5.8, the adsorbent surface would be mainly positively charged and consequently would favor DFC removal through electrostatic interactions.
3.1.4. Thermal degradation behavior
The TGA and DTA curves for OP and OPC are shown in Figure 5a,b. The TGA curves of the OP material show the presence of three endothermic decomposition peaks in the tested temperature range of 30 °C–800 °C, corresponding to three weight losses. The first stage (10.75%) was observed for a temperature range of 30 °C–200 °C, indicating the removal of water, organic solvent or residual solvent, and physisorbed and chemisorbed H2O molecules in the sample [47]. In the second stage, the decomposition of capping biomolecules occurred at 220 °C–400 °C. The protein of the OP extract decomposed completely at temperatures higher than 600 °C [47].
Thermogravimetric study of orange peels (a) and orange peel composite (b).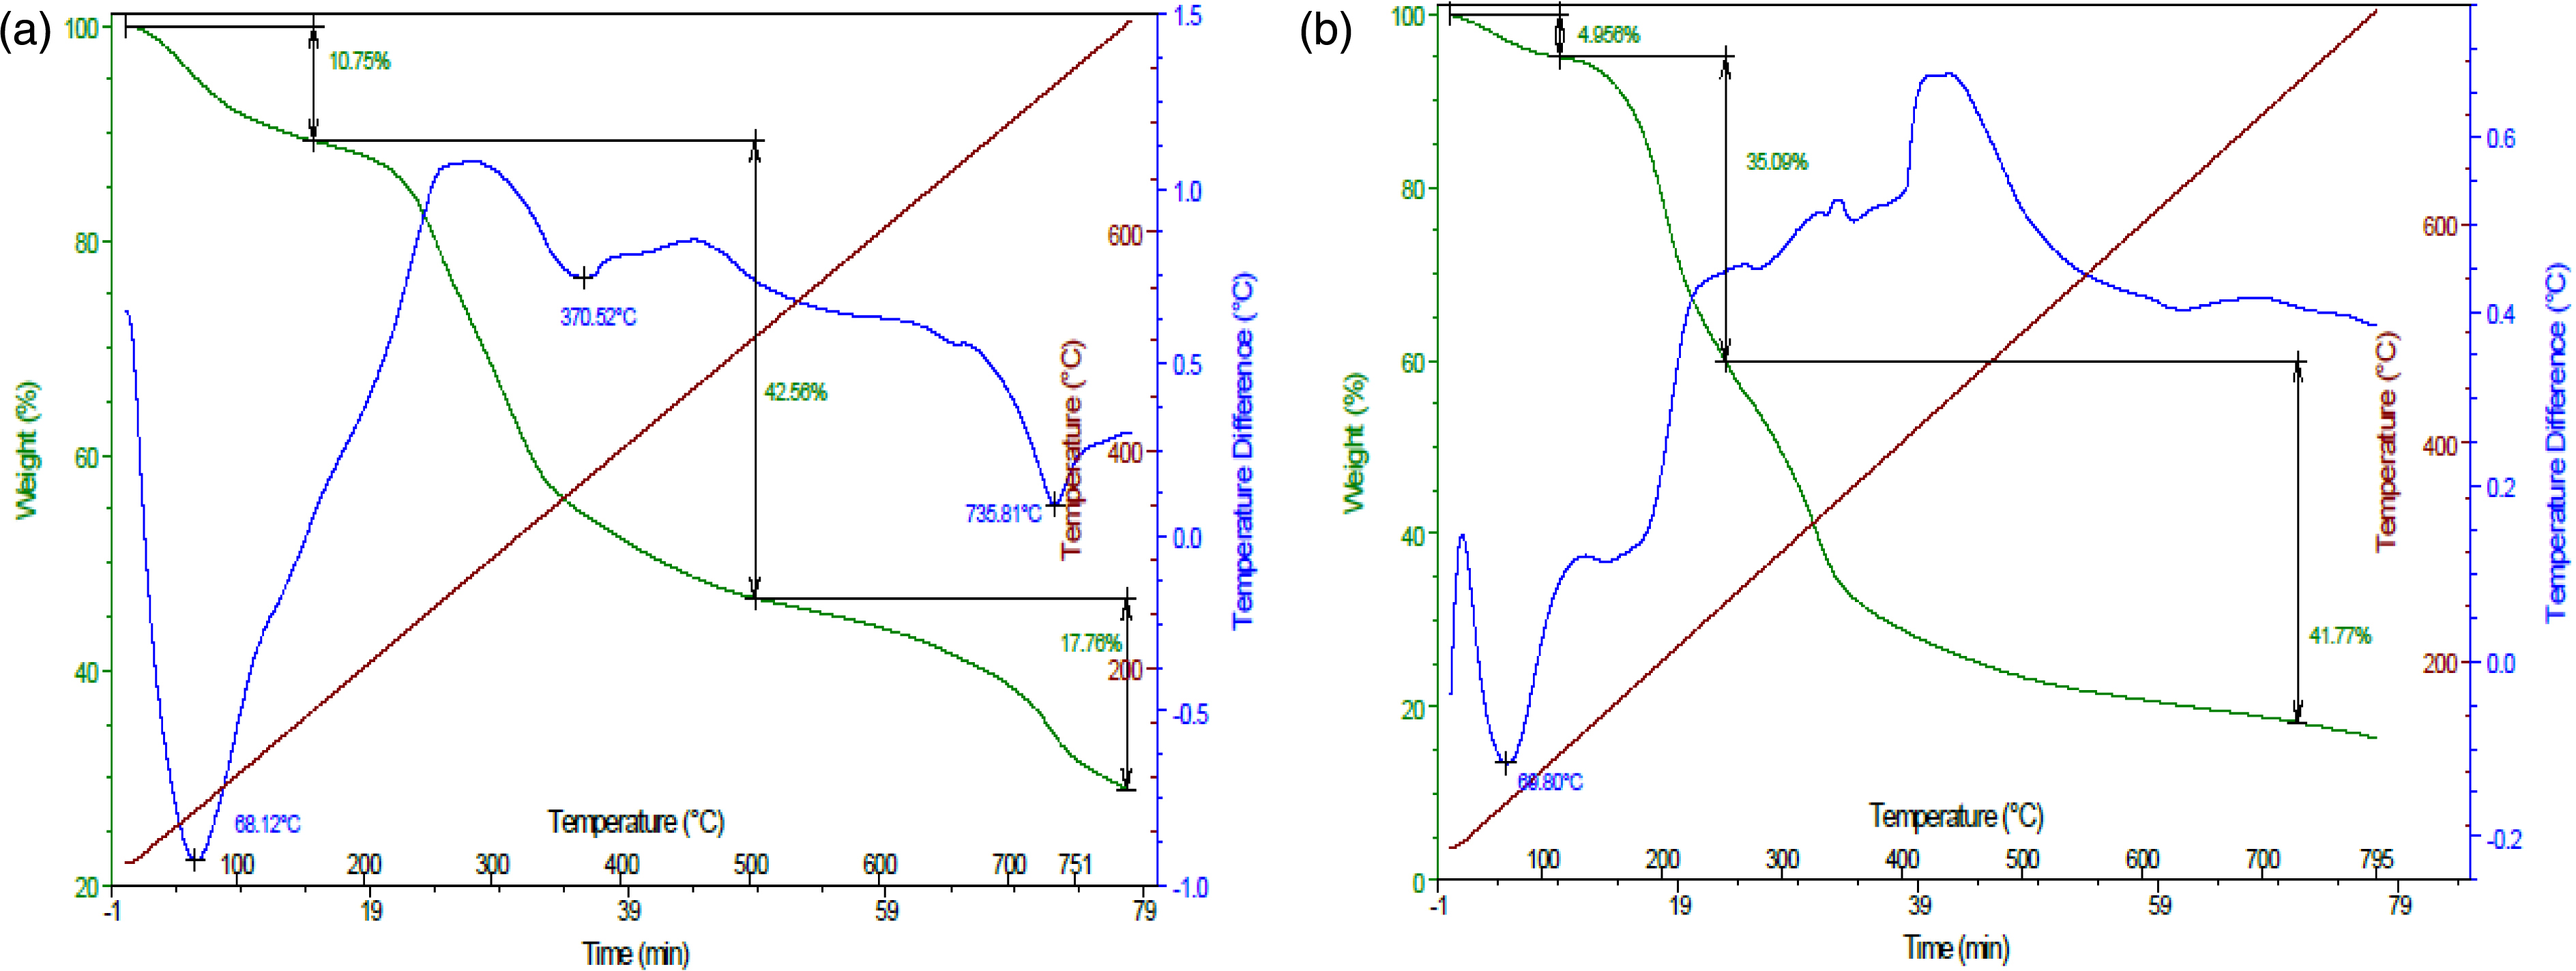
Figure 5b indicates that the initial mass loss of the OPC occurred below 100 °C (4.9%) and was due to the release of weakly bonded physisorbed water molecules. The second range between 135 and 250 °C is related to the degradation of hemicellulose [39, 40]. The third range 250–375 °C is due to cellulose decomposition [48]. Finally, the degradation occurring between 375 and 500 °C corresponds to lignin, which is more thermally stable and difficult to be degraded [49]. Overall, the thermal stability and degradation characteristics of OP and OPC are in line with those reported for oil-palm wastes [50]. This result highlights their high potential to be used as promising materials for various environmental applications such as wastewater treatment [51].
3.2. Study of DFC removal by the biocomposite
Preliminary assays aiming to assess the ability of the raw material (OP) in removing DFC were conducted in batch mode for an initial pH of 5.5, a DFC concentration of 100 mg⋅L−1, and a contact time of 180 min. The results show that despite its relatively higher BET surface area (64.4 m2⋅g−1), this material was inefficient in removing DFC from aqueous solutions. This finding may be due to the fact that the DFC adsorption may be mainly governed by other parameters such as structural and surface chemistry properties. For this reason, only the OPC material was selected for the study of DFC adsorption.
3.2.1. Effect of contact time–kinetic study
The kinetic removal of DFC by the OPC was conducted under the experimental conditions given in Section 2.5.1. The experimental results are depicted in Figure 6.
Kinetic removal of DFC by the orange peel composite at different initial concentrations (C0: initial DFC concentration; PFO: pseudo-first order).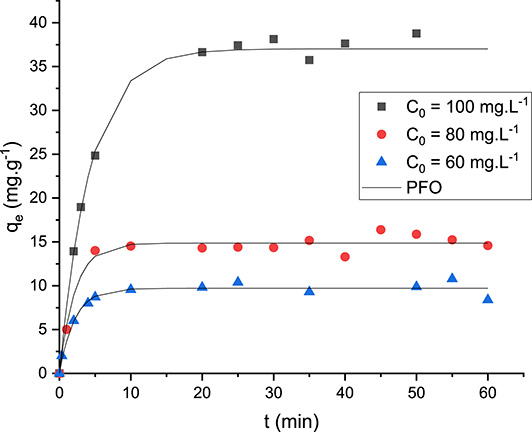
Figure 6 reveals that DFC adsorption on OPC is a very rapid process. Indeed, after only 5 min of contact time, the amount of removed DFC represents around 4.5%, 7.3%, and 12.4% of the totally adsorbed amount for initial concentrations of 60, 80, and 100 mg⋅L−1, respectively. After that, the DFC adsorption continues to increase but at a slower rate. The equilibrium is observed after about 20–25 min for all the studied initial concentrations (Figure 6). At this stage, the related experimental adsorbed amounts (qe,exp) were evaluated as 37.6, 15.2, and 9.8 mg⋅g−1 for initial DFC concentrations of 100, 80, and 60 mg⋅L−1, respectively. This is an important advantage when scaling up this process. This contact time is much lower than those observed for DFC removal by a three-dimensional graphene-based adsorbent [52], and activated carbon prepared from olive stones [53].
The experimental data fitting with the four kinetic models shows that the PFO model is the most appropriate model. Indeed, it exhibits the highest R2 and the lowest MAPE values (Table 3). Moreover, the calculated DFC adsorbed amounts at equilibrium by this model for the three studied initial concentrations were the closest to the experimental values (Table 3). This finding suggests that the DFC adsorption process is mainly controlled by an external diffusion step [54]. The PFO model was also found to best fit the experimental data for DFC adsorption by alginate-/carbon-based films [55] and three-dimensional graphene-based adsorbents [52]. However, better fitness of PSO was reported for DFC adsorption by magnetic carbon nanofibers derived from bacterial cellulose [24] and activated carbon derived from olive stones [53]. The Elovich model explains pollutant adsorption onto heterogeneous surfaces, where the rate slows down over time making it suitable for varying affinities. In contrast, the intraparticle diffusion model mainly occurs via diffusion from an aqueous solution though the boundary layer in the first step and then inside the adsorbent’s pores.
Parameters of used kinetic models for DFC removal by OPC
| PFO | C0 (mg⋅L−1) | k1 (min-1) | qe (mg⋅g−1) | R2 | MAPE |
| 100 | 0.232 | 37.0 | 0.989 | 2.2 | |
| 80 | 0.459 | 14.8 | 0.972 | 5.0 | |
| 60 | 0.474 | 9.7 | 0.969 | 6.7 | |
| PSO | C0 (mg⋅L−1) | k2 (g⋅mg−1⋅min−1) | qe (mg⋅g−1) | R2 | MAPE |
| 100 | 0.008 | 39.6 | 0.975 | 4.6 | |
| 80 | 0.044 | 15.6 | 0.954 | 6.6 | |
| 60 | 0.0830 | 10.1 | 0.963 | 6.6 | |
| Intraparticle diffusion | C0 (mg⋅L−1) | ki (mg⋅g−1⋅min0.5) | R2 | MAPE | |
| 100 | 5.255 | 0.413 | 30.0 | ||
| 80 | 2.443 | 0.352 | 20.1 | ||
| 60 | 1.655 | 0.094 | 37.2 | ||
| Elovich | C0 (mg⋅L−1) | A (mg⋅g−1⋅min−1) | 𝛽 (g⋅mg−1) | R2 | MAPE |
| 100 | 62.760 | 0.168 | 0.922 | 10.100 | |
| 80 | 95.950 | 0.496 | 0.895 | 10.300 | |
| 60 | 67.830 | 0.754 | 0.884 | 17.300 | |
3.2.2. Effect of pH
The effect of initial pH values on DFC removal by the OPC was studied under the experimental conditions described in Section 2.5. The results (Figure 7) show that the highest removal yield (85.9%) was observed at a pH of 3. Then, the removal yield gradually decreases with increase in initial pH value. The lowest value (7.5%) was measured at an alkaline pH of 10.4. This decrease in efficiency is due to the fact that for pH values higher than the pKa of DFC (4.0) and the pHzpc of the OPC material (5.8), both the DFC and the OPC particles are negatively charged. In contrast, for pH values lower than 4, electrostatic interactions are favored between the positively charged OPC particles and negatively charged DFC molecules.
Effect of pH on diclofenac adsorption by the orange peel composite (qe: amount of DFC removed at equilibrium).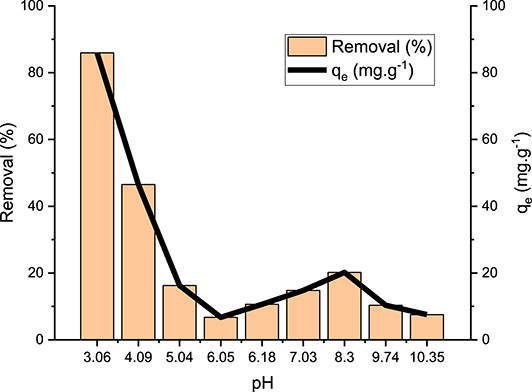
Similar results were reported by Yoong et al. [56] and Mizzaee et al. [57] when investigating DFC removal by a chitosan-based magnetic composite and wood-derived mesoporous activated carbon respectively. For instance, in the latter study, increasing the pH from 3 to 11 has resulted in a decrease in DFC removal yield from 92.3 to 23.9, respectively [57]. In our study, we choose to use an initial pH of 5.5 (without adjustment) even it has lower adsorption capacity. Indeed, avoiding the use of chemicals for pH adjustment to a value of 3 has both environmental and economic benefits.
3.2.3. Effect of temperature combined with the initial DFC concentration and isotherm study
The effect of temperature on the DFC adsorption isotherm by OPC is illustrated in Figure 8. It can be clearly seen that the adsorbed DFC quantity by the OPC decreases with increase in initial DFC concentration. Indeed, under fixed experimental conditions, the highest adsorbed DFC amounts were estimated as 23.7, 19.0, and 13.6 mg⋅g−1 at temperatures of 30, 40, and 50 °C, respectively (Figure 8). This finding implies that temperature increase has a negative impact on the removal of DFC. This behavior may be explained by the weakness of the physical bond between DFC molecules and OPC active sites, which decrease with increase in aqueous temperature [33]. This result is in line with the study by Thi Minh Tam [33], who reported that an increase in temperature from 15 °C to 45 °C had decreased the DFC removal efficiency of magnetic-gelatin-modified peanut shell biochar by 39%. In contrast, the study by Leone et al. [58] showed an increase in DFC removal rate by 14.4% when the temperature was increased from 10 °C to 45 °C.
Effect of temperature on DFC removal by the orange peel composite (T: temperature; BET: BET isotherm model).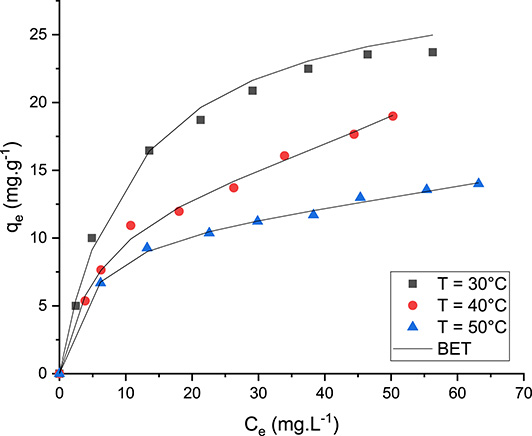
The experimental isotherm data were fitted using the four selected models—Langmuir, Freundlich, Temkin, and BET—by using Matlab R2016a software. Table 4 summarizes the obtained results.
Estimated parameters of Langmuir, Freundlich, Temkin, and BET isotherm models of diclofenac elimination by the orange peel composite
| Isotherm model | Temperature | Parameters | ||||
|---|---|---|---|---|---|---|
| Langmuir | T (°C) | KL (L⋅mg−1) | qm (mg⋅g−1) | R2 | MAPE | |
| 30 | 0.102 | 28.1 | 0.998 | 3.5 | ||
| 40 | 0.073 | 22.8 | 0.984 | 5.8 | ||
| 50 | 0.109 | 15.4 | 0.988 | 4.3 | ||
| Freundlich | T (°C) | KF | N | R2 | MAPE | |
| 30 | 5.500 | 2.6 | 0.973 | 11.0 | ||
| 40 | 3.500 | 2.3 | 0.991 | 4.4 | ||
| 50 | 4.100 | 3.3 | 0.996 | 2.0 | ||
| Temkin | T (°C) | B | KT (min−1) | R2 | MAPE | |
| 30 | 6.1 | 1.0 | 0.995 | 3.0 | ||
| 40 | 5.0 | 0.7 | 0.979 | 4.1 | ||
| 50 | 3.1 | 1.4 | 0.985 | 2.2 | ||
| BET | T (°C) | K1 | K2 | qm (mg⋅g−1) | R2 | MAPE |
| 30 | 0.090 | 0.000 | 29.9 | 0.986 | 4.6 | |
| 40 | 0.166 | 0.006 | 14.1 | 0.995 | 3.2 | |
| 50 | 0.219 | 0.004 | 11.4 | 0.998 | 1.5 | |
Table 4 shows that both the BET and Freundlich models fit the experimental data. Indeed, they exhibit correlation coefficients close to unity and the lowest MAPE values. This suggests that DFC removal by OPC occurs heterogeneously and on multilayers. This result is confirmed by the finding of Jaldin et al. [22] when studying pesticide removal by sugarcane bagasse and peanut shell magnetic composites. Moreover, the calculated Langmuir parameter values (RL = 1/(1 + KL × C0)) are less than 1, indicating that DFC removal by the OPC is a favorable process. In addition, under the studied conditions, the calculated Freundlich parameter (n) values are higher than 1 (Table 4), suggesting that the adsorption process is favorable. Finally, the estimated Temkin parameter (B) values are lower than 8 kJ⋅mol−1 (Table 4), implying that this biosorption might involve physical mechanisms.
Table 5 presents an effectiveness comparison of DFC removal by OPC with other engineered adsorbents. It clearly shows that the OPC can be considered a promising adsorbent. However, it is obvious that the OPC exhibits much lower efficiency than activated carbons and biochars (Table 5). This is attributed to the fact that these materials usually have very improved physicochemical properties. For instance, a magnetic-gelatin-modified peanut shell biochar [33] has a DFC removal capacity 10 times higher than our material. This can be partially explained by the fact that it has a BET surface area of 222.75 m2⋅g−1, which is much higher than that of our OPC (25.8 m2⋅g−1), in addition to the enhancement of its surface chemistry properties after modification. However, our synthesized OPC is cheaper and eco-friendlier than typical biochars.
Comparison of diclofenac removal by the orange peel composite with other engineered adsorbents
| Adsorbent | Diclofenac adsorption capacity (mg⋅g−1) | Reference |
|---|---|---|
| Magnetite rice husk activated carbon | 270.0 | [56] |
| Carbon nanotube tanned leather waste | 20.6 | [59] |
| Magnetic carbon from nanofibers | 48.8 | [24] |
| Alginate-/carbon-based films from sodium alginate solution and commercial activated carbon | 29.9 | [55] |
| Magnetic-gelatin-modified peanut shell biochar | 348.9 | [33] |
| Lignin-based magnetic nanoparticle adsorbent from alkaline bamboo | 106.4 | [60] |
| Orange peel composite | 37.0 | This work |
Thermodynamic parameters were calculated from the Van’t Hoff diagram according to the methodology given in Section 3.2. The results (Table 6) showed that all the calculated ΔG values at different temperatures were negative. This indicates that the adsorption phenomenon is feasible and spontaneous [61, 62]. Moreover, the enthalpy (ΔH) is negative (−22.3 kJ⋅mol−1), indicating that the DFC adsorption process is exothermic. In addition, this value is less than 40 kJ⋅mol−1, suggesting that DFC adsorption by OPC involves mainly physical mechanisms. The ΔS value is negative (−0.071 J⋅mol−1⋅k−1), suggesting that the adsorption is accompanied by an orientation of molecules leading to a reduction in the state of molecular disorder [63]. Similar results were reported for DFC adsorption by zeolites/resins [54].
Thermodynamic parameters of diclofenac adsorption by the orange peel composite
| T (°C) | ΔH (kJ⋅mol−1) | ΔS (kJ⋅mol−1⋅K−1) | ΔG (kJ⋅mol−1) |
|---|---|---|---|
| 30 | −22.273 | −0.071 | −1.626 |
| 40 | −0.921 | ||
| 50 | −0.216 |
It can be noted that textural properties do not highly affect DFC removal by our synthesized OPC. Indeed, even if this material has a lower surface area than the raw OP, it efficiently adsorbs DFC from aqueous solutions under a wide range of experimental conditions. In this context, Thi Minh Tam [33] reported that even if magnetized biochar has a lower specific area (70.2 m2⋅g−1) than raw biochar (222.7 m2⋅g−1), its DFC removal capacity was around 3.3 times higher. Other properties may influence this process to a greater extent. For instance, on the basis of the pH effect and isotherm modeling studies, it appears that the DFC removal is highly influenced by the electrostatic interaction mechanism. However, chemical interactions may be also involved in this process. Indeed, it has been previously proven that π–π interactions established between the aromatic ring in DFC and the OPC may play a crucial role in this process [64]. In addition, DFC adsorption through complexation with functional groups (C–H stretching vibration) may be important under specific conditions [64]. Further investigations are required to better elucidate the contribution of each one of them. Moreover, sustainable management of the DFC-loaded OPC is an important research work to be carried out in the future. An effective desorption step followed by the use of an advanced oxidation process may be applied [65]. Furthermore, laboratory column experiments are needed in order to assess the scale-up design parameters of large-scale columns. As detailed in the recent work of Bian et al. [66], this operation will be based on the combination of these laboratory assay outputs and theoretical concepts.
4. Conclusion
The current work shows that a magnetic OPC could be considered a promising material for removing DFC from aqueous solutions under a wide range of experimental conditions. The in-depth characterization by using numerous techniques and the experimental and modeling adsorption analysis indicate that DFC removal by adsorption is favorable, spontaneous, exothermic, and involves mainly physical mechanisms. The highest removal efficiency was achieved for low acidic pH values due to a favorable electrostatic interaction mechanism. Additional research will be undertaken to assess this OP-derived adsorbent in removing/oxidizing DFC and also other typical pharmaceuticals from actual wastewater. Moreover, dynamic assays involving laboratory columns and reactors are necessary for the following processes: (i) evaluate the effect of key adsorption parameters (flow rate, adsorbent bed heights) and (ii) guarantee a successful and smooth scaling up of laboratory devices to real-world situations.
Declaration of interests
The authors do not work for, advise, own shares in, or receive funds from any organization that could benefit from this article, and have declared no affiliations other than their research organizations.
Acknowledgments
The authors were supported by the National Engineering School of Gabes (ENIG), University of Gabes, Tunisia and the Instituto de Ciencia de Materiales de Madrid, Spain. They express special thanks to Professors Pilar Aranda and Marga Darder for their valuable help and work co-supervision.