


 CC-BY 4.0
1. Introduction
Pyrolysis consists of the thermal decomposition of carbonaceous materials (generally wood or agricultural residues) into a solid, liquid and gaseous fraction in absence of oxygen [1]. Products originating from pyrolysis strongly depend on the temperature at which the pyrolytic process occurs as well as on the chemical reactions taking place during the intermediate decomposition of the feedstock material [2]. With respect to the biochemical constituents, cellulose, hemicellulose and lignin have the highest polymeric distribution in plants and, generally, in plant-derived materials. Therefore, the study of their thermal degradation is fundamental to gain awareness on the feedstock chemical composition, on its thermal stability and the decomposition kinetics of the pyrolysis process.
As studied by Ranzi et al. [3], a way to deal with the chemistry of pyrolysis consists in the characterization of the initial biomass and both primary and secondary gasification reactions. In their paper, the authors developed a model to predict the gas composition deriving from biomass gasifiers particularly focusing on primary constituents (cellulose, hemicellulose and lignin) and their degradation. In their subsequent work, they derived the yield of gas, tar and solid residue [4]. A similar contribution can be recognized in the study of Liden et al. [5] focusing on the kinetic prediction model for the liquid fraction from fast pyrolysis. On the same issue, but focussing on slow pyrolysis, Hu et al. [6] compared different kinetic models on the ground of data derived from thermogravimetric analyses (TGA). Carrier et al. [7] based their research on the application of TGA to determine the chemical structure of biomass feedstock. The study of the thermal behaviour of biomass by thermogravimetric analysis is also tackled by Zhou et al. [8] and by Zhang et al. [9]. TGA data are also used by Huang et al. [10] to predict chemical kinetics. Lee et al. [11] developed a methodology based on experimental analyses in order to derive the chemical composition of gaseous products originating from pyrolysis. Differently from the previous experimentally driven contributions, Di Blasi developed a mathematical model to couple the effects deriving from heat, momentum and mass transfer phenomena with the thermal degradation of wood [12]. A numerical study is also presented in the work of Babu and Chaurasia [13], who investigated the optimum set of parameters (temperature, concentration, time and heating rates) for the pyrolysis of biomass.
Thus, in general terms, biomass pyrolysis can be studied considering the initial feedstock composition [14], reaction pathways [15, 4] and final products composition [16]. Apart from the chemical viewpoint, pyrolysis has been extensively studied either as a stand-alone process or as an integration to gasification processes [17]. In particular, simulations can be targeted to specific pyrolysis plants [18] and including sensitivity analysis [19] or can be directed to investigate dedicated energy recovery lines [20, 21], but rarely investigations in the literature include both aspects. To fill this gap, in this paper, simulations aim at increasing awareness on both the decomposition process of biomass (including the chemical evolution of secondary reactions) and the energy performance evaluation of a micro-cogeneration unit coupled with an energy recovery line.
In Table 1, a synthetic framework for prediction-based models tackled from the aforementioned literature is offered. Each paper has been classified as a function of the operative temperature range, the feedstock biomass, modelling or numerical approaches vs. experimental investigation and the kind of analyses.
A synthetic summary of the literature review
| Paper | Temperature range | Feedstock biomass | Modelling approach/ experimental investigation | Analyses |
|---|---|---|---|---|
| Ranzi et al. [3] | 100–1000 °C | Softwood Hardwood | Experimental | Gas composition prediction |
| Liden et al. [5] | 400–700 °C | Wood | Experimental | Organic liquid yield prediction |
| Hu et al. [6] | 150–650 °C | Cellulose | Thermogravimetric experiments | Biomass decomposition |
| Di Blasi [12] | 100–1000 °C | Wood | — | Heat transfer and secondary reactions |
| Blanco Lopez et al. [16] | 100–700 °C | Olive stones | Experimental | Gas mixture composition |
| Carrier et al. [7] | 100–700 °C | Wood and fern | Thermogravimetric experiments | Fractionation of biomass |
| Benanti et al. [19] | 100–600 °C | Olive pits | CHEMCAD model and experimental measurements | Simulation of char production vs. experimental data |
| Ducom et al. [20] | 100–900 °C | Olive residues | Experimental | Energy recovery |
As emerged from the literature review, several experimental studies and models have been proposed by researchers with respect to the chemical and physical behaviours of different types of feedstock material during pyrolysis.
However, due to the intrinsic complexity of the chemical evolution of biomass, it may be useful to develop numerical simulations able to offer a simplified but reliable description of the pyro-products yields and their chemical decomposition. In this perspective and drawing lessons from the existing literature, a novel simulation model for biomass pyrolysis is presented in this study.
The proposed model includes an accurate characterization of the initial feedstock material and predicts the yield and composition of pyrolysis products in order to estimate to what extent the produced pyro-gas can be exploited for energetic purposes, i.e. to recover thermal energy to support plant operations.
In comparison to existing numerical pyrolysis models which provide a simplified composition of the produced pyrogas, the presented model proposes a very detailed analysis of the chemical species originating from the pyrolysis process.
This high granularity is a strategic detail if planning to exploit the produced biogas to fed mechanical engines, for which the exact knowledge about the chemical composition is necessary. The relationships between biomass and its primary constituents are used to accurately correlate the degradation of the feedstock material with the evolution of the chemical species originating from pyrolysis. As a further added value, the decomposition model takes into account both the dependence of degradation from temperature and the kinetics of reactions involved during the process. The model provides information not only on the evolution of the main pyro-products as a function of the temperature but also with respect to the thermal degradation of chemical species.
The paper is structured as follows. Section 2 presents the materials and methods with a focus on the feedstock composition, the modelling of the decomposition process and the characterization of final products. In addition, the simulation scheme and the modelling of the implemented energy recovery line are explained. Section 3 introduces the case study and discusses the main results of the simulations for both the primary and secondary reactions and the energy performances of the micro-cogeneration unit and the thermal recovery line.
2. Materials and methods
2.1. Preliminary consideration about the feedstock composition
Biomass properties are usually determined by taking into consideration the biochemical and elementary composition and the energy content. With respect to the biochemical constituents, as underlined by Chen et al. [15] and Yang et al. [22], the decomposition process for cellulose begins around 300 °C, with mass loss maximum peak around 340 −−360 °C. At higher temperature, typically over 400 °C, almost all cellulose has been pyrolysed leaving a solid residue of circa 7%. Hemicellulose decomposes easier than cellulose, usually between 200 −−300 °C, with mass loss peak around 270 °C. At the end of the pyrolysis process, however, a residue of circa 20% of hemicellulose can still be recognized. Lignin decomposition occurs within a large temperature range (from 100 °C to 900 °C), presenting lower conversion rates and lower mass losses compared to cellulose and hemicellulose; in this case, the solid residue from pyrolysis is around 45% of the initial feedstock.
Going into the detail of intermediate compounds from biomass pyrolysis, at the increase of the temperature, cellulose separates into water and carbon from the initial starting matrix and results in an intermediate compound called “active cellulose”, CELL-A [3, 23]. The further degradation of CELL-A results in the formation of Levoglucosan, a characteristic compound deriving from cellulose pyrolysis, and a mixture of other minor components. Hemicellulose (HCE) firstly decomposes into the two main intermediate compounds: HCE1 and HCE2. Three different sub-reactions, one of them yielding the Xylosan, characterise the HCE1 decomposition, whilst HCE2 decomposed in a mixture of minor components [3, 23]. The thermal degradation of lignin is more complex if compared to cellulose and hemicellulose. Lignin decomposition yields three main intermediate products, each of them characterized by the dominance of either carbon (C), hydrogen (H) or oxygen (O) and indicated, respectively, as LIG–C, LIG–H and LIG–O. The LIG–C decomposes in LIG–CC and a mixture of common compounds and from LIG–CC Coumaryl is obtained. Going forward, LIG–H and LIG–O interact to obtain LIG–OH from which Sinapaldehyde originates. The pyrolysis of lignin is also responsible for the production of Phenol.
To build a reliable feedstock, it is fundamental to consider the elemental composition of biomass along with its biochemical characterization. In this study, the elemental composition is derived from previous studies available in literature [24, 25, 16] and free online databases [26]. Thus, the preliminary biomass structure was obtained by rearranging the information obtained from elemental composition and the stoichiometric balances of complete biomass thermo-chemical decomposition derived from the literature [3]. From this obtained feedstock, the atomic ratios H/C and O/C ratios were calculated.
The energy content of biomass is described by the higher heating value (HHV) calculated using the empirical correlation developed by Ebeling and Jenkins [27], reported in (2.1):
| (2.1) |
2.2. Modelling of the decomposition process
The decomposition of biomass can be modelled with respect to just the primary or to both the primary and secondary reactions [12]. The initial feedstock decomposes into solid, liquid and gaseous products; in particular, primary reactions produce intermediates that evolve in the final products after the secondary reactions [28]. In this work, a two-steps decomposition scheme has been adopted, as reported in Figure 1.
Biomass decomposition scheme.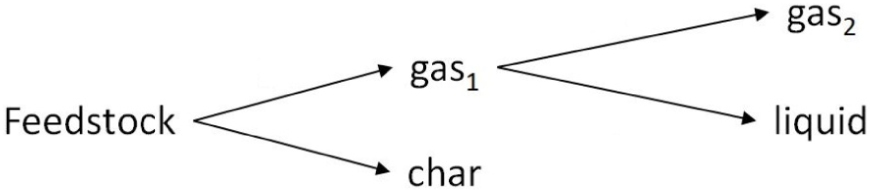
The initial feedstock decomposes into solid char and a gaseous fraction. The solid fraction (char) is mainly constituted by carbon and contains volatiles and ash; the gaseous fraction includes both condensable and non-condensable gases. Due to cooling and cleaning gas systems, the condensable gaseous fraction undergoes further secondary reactions yielding a liquid fraction (composed of water and pyrolytic oil) and a permanent gaseous fraction. Thus, in compliance with the scheme of Figure 1, the mass balance equation of the entire decomposition process can be written as:
| (2.2) |
Software simulation logic.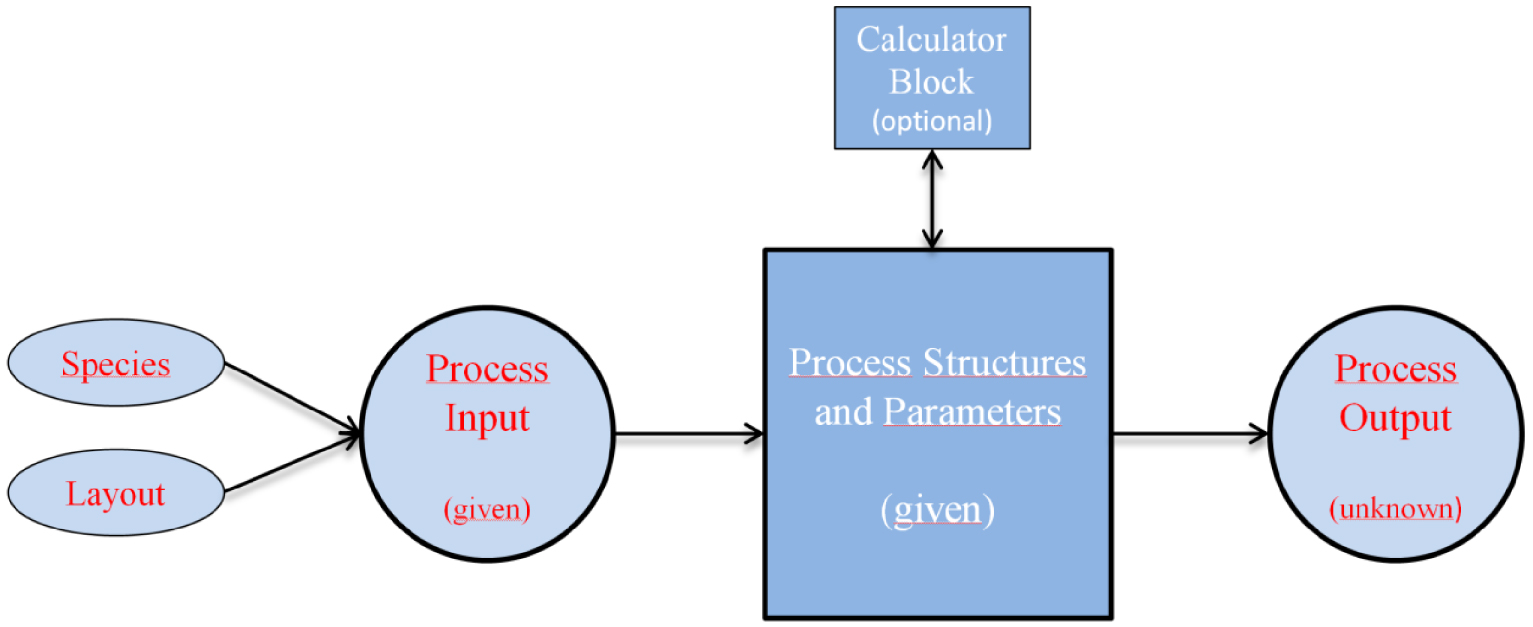
To ensure the accuracy of simulations, the kinetic of the chemical decompositions should be reproduced taking into consideration all factors mostly affecting the pyrolysis. The mass changes occurring during the reactions can be calculated from the TG-Analysis through the calculation of the conversion rate 𝛼, expressed as:
| (2.3) |
| (2.4) |
The derivative of the conversion rate in (2.4) depends on two factors: the coefficient k, expressing the heating rate and necessary to describe the kinetics of the reaction, and the polynomial function f(T) correlating the species in the compound with the increase of temperature.
The kinetic law of any chemical reaction is governed by the Arrhenius equation as expressed in (2.5):
| (2.5) |
The polynomial function f(T) can be determined through the percentages of each species for a temperature range of 773 < T < 1173 K:
| (2.6) |
The coefficients , b and c were determined through interpolation from the data available in literature.
2.3. Simulation scheme
The understanding of kinetics reactions underlying the pyrolysis process is a multi-faceted problem. To build a reliable simulation model, the chemical species involved during pyrolysis as well as their physical and chemical characteristics should be properly specified as input parameters within any simulation environment. Indeed, the main idea behind the simulations consists of the right choice of a layout ensuring the interaction between compounds and unit blocks [29, 30]. Calculation of mass and energy balances, thermodynamic equilibrium, rate equations, mass-flow rate, temperature, pressure are based on mathematical models and empirical correlations. These are already available in the software library or are developed by users and fed to the calculator block tools. This simulation logic is summarized in Figure 2.
The simulation of biomass decomposition is a complex issue, for which dedicated models are not available within software packages [31, 32]. A way to overcome this difficulty is to build a user-defined material, usually referred to as a nonconventional component, in order to set the composition and characteristics of the feedstock material [29]. Several examples of implemented operation blocks simulating thermochemical conversion processes have been adopted from the current literature. For instance, Benanti et al. simulated a plug flow reactor to study the correlation between temperature and composition of the final products obtained by slow pyrolysis [19]. In their study, they used the decomposition reactions of biomass to obtain the input kinetic parameters. Fonseca et al. chose a Yield Reactor block for simulating wheat straw as nonconventional material and calculated properties and heat capacity of the obtained products from fast pyrolysis [33].
2.4. Characterization of final products
The heat capacity of the gas mixture can be calculated according to (2.8):
| (2.7) |
Being and cp,n the mass fraction and heat capacity of each chemical species and x the number of chemical species. In detail, the heat capacities of each component have been calculated according to the NASA polynomial method [34, 35]:
| (2.8) |
| (2.9) |
| (2.10) |
The HHV for oil can be expressed by the formula [37]:
| (2.11) |
Eventually, for both products, the lower heating value (LHV) can be expressed using (2.12), as recommended in [1]:
| (2.12) |
2.5. Recovering
One way for valorising the gas obtained from pyrolysis is to feed an engine connected to an electrical generator for the simultaneous production of electrical and thermal energy. The heat released during the combustion process is recovered from the cooling water and exhaust gases and redirected to the main plant at the service of drying and/or pyrolysis stages.
The theoretical quantity of oxygen mO 2 necessary to complete the combustion of a fuel can be expressed as [38]:
| (2.13) |
In this equation, is the molecular mass of each compound i, being i = O2, CO2 (kgi∕kmol), Mj the molecular mass of element j, being j = C, H,S,O (kgj∕kmol) and, Yj the mass fraction of element j, with j = C,H,S,O (kgj∕kgfuel).
From these data, and knowing the oxygen percentage in air, the stoichiometric air/fuel ratio A∕Fstoich can be calculated. However, considering complete combustion and high performances for the engine, the air/fuel equivalence ratio 𝜆 is used; in this case, the actual air/fuel ratio A∕F is obtained by taking into account the excess of air:
| (2.14) |
The recycling system is schematically represented in Figure 3.
Cogeneration system cycle.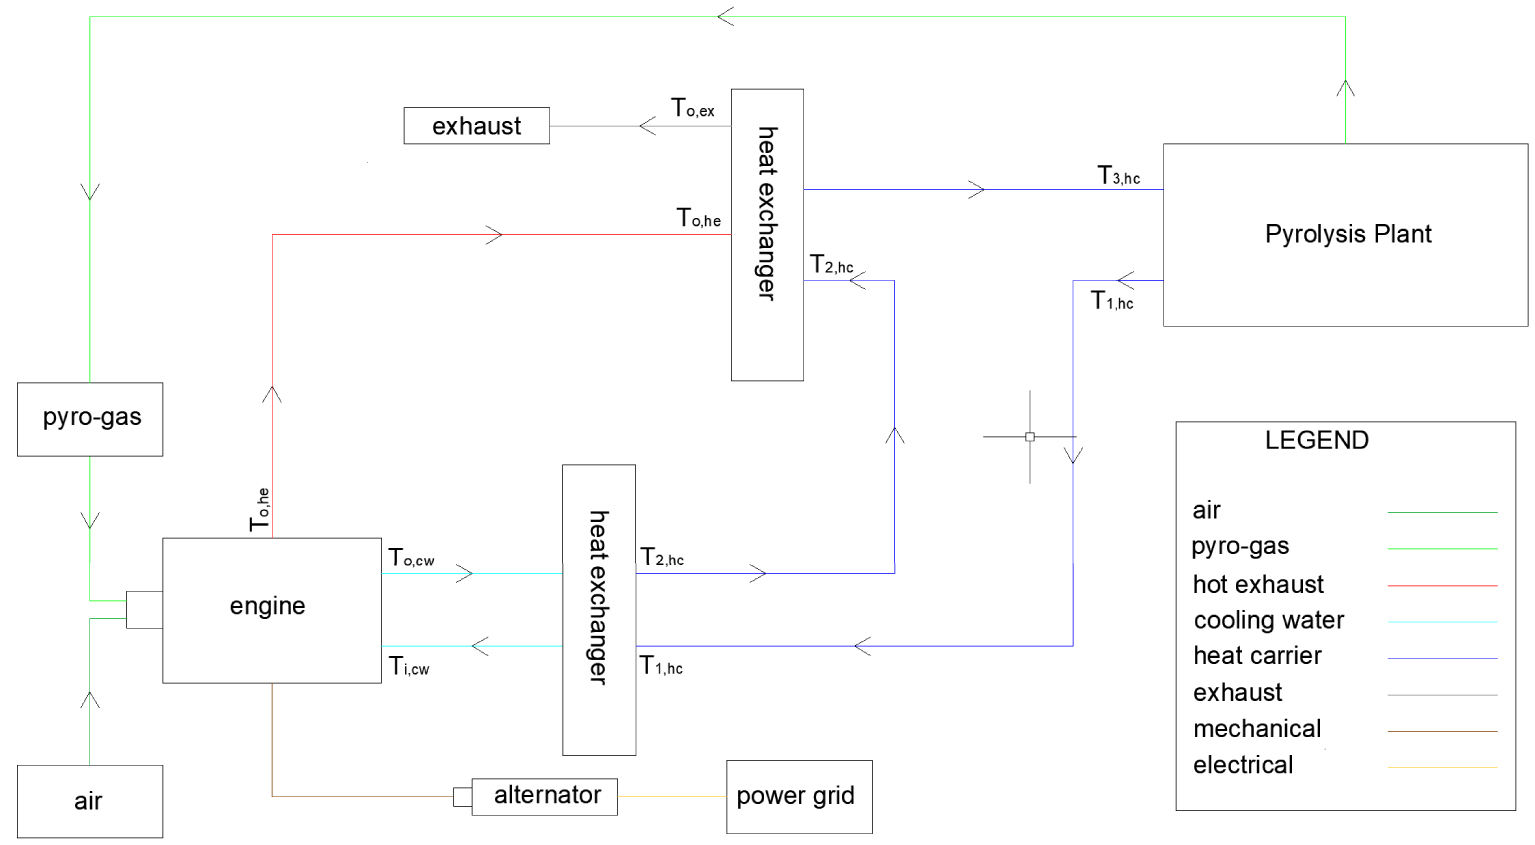
Biochemical distribution in the final feedstock
| Component | [C] (wt%) | [H] (wt%) | [O] (wt%) | MW (g/mol) | H/C (—) | O/C (—) | Cell (wt%) | HC (wt%) | Lig (wt%) | HHV (MJ/kg) |
|---|---|---|---|---|---|---|---|---|---|---|
| Biomass | 49.43 | 6.03 | 44.54 | 4130.76 | 1.453 | 0.67 | 31.40 | 41.58 | 26.02 | 20.13 |
In accordance with the specification of the CHP system, thermal energy from cooling water and exhaust gas can be recovered by a heat exchanger and recirculated [39]. The thermal energy from cooling water is calculated as:
| (2.15) |
In (2.15), and 𝛥Tcw are the mass of the cooling water and the temperature variation, both derived from the datasheet of the equipment; cp,cw is the heat capacity of water.
Similarly thermal energy Qex is defined as:
| (2.16) |
Being the total mass of the exhaust gas (considering the mass of air and the mass of syngas, respectively), 𝛥Tex = Ti,ex − To,ex the temperature variations and cp,ex the heat capacity of exhaust.
The mechanical power Pm generated by the system can be calculated as:
| (2.17) |
| (2.18) |
3. Case study and results
In this study, olive pits have been chosen as feedstock material. Their biochemical and elemental compositions have been determined by averaging data and experimental measures available from previous works of the authors [24, 40], other current literature [16] and online databases [26]. The final feedstock has been modelled as a non-conventional solid named “Biomass”, which biochemical and elemental compositions, molecular weight, H/C and O/C ratios and calorific value have been reported in Table 2.
Simulations run considering 30 kg/h of feedstock material with of moisture content. The calculator block processes all components entering the reactor: in this process, the temperature is an import variable, whilst the twenty-one chemical species involved during the thermochemical conversion represent export variables. During the conversion, the evolution of each compound is analysed within the temperature range 500 −−900 °C. It is worth pointing that, in this study, the high granularity of the considered chemical species enhance the validity of the proposed simulation model and ensures a more comprehensive characterization from the chemical evolution viewpoint.
The distribution law is obtained by combining the Arrhenius equation in (2.5) and the polynomial function of the temperature expressed in (2.6). The derived equation for the mass mx of the x compound is reported in (3.1):
| (3.1) |
Coefficients for yield distribution
| Compound | a | b | c | |
|---|---|---|---|---|
| C2H4O2 | HAA | 7.12 | − 0.01273 | 5.76 × 10⁻⁶ |
| C2H2O2 | GLYOXAL | 0.979 | 0.00115 | − 1.62 × 10⁻⁶ |
| C2H4O | ACETA | − 13.98 | 0.031 | − 1.6 × 10⁻⁵ |
| C6H6O3 | HMFU | − 30.65 | 0.0688 | − 3.7 × 10⁻⁵ |
| C3H6O | PROPILEN | 1.61 | − 0.00387 | 2.32 × 10⁻⁶ |
| CO2 | C-DIOX | 6.678 | − 0.0105 | 4.84 × 10⁻⁶ |
| CO | C-MON | − 14.48 | 0.03041 | − 1.4 × 10⁻⁵ |
| CH4 | METHANE | 5.204 | − 0.0118 | 7.00 × 10⁻⁶ |
| H2 | HYDROG | − 24.7 | 0.0482 | − 2.1 × 10⁻⁵ |
| H2O | WATER | 10.86 | − 0.01615 | 7.53 × 10⁻⁶ |
| CH2O2 | FORMIC AC | − 45.05 | 0.107 | − 5.8 × 10⁻⁵ |
| C | CHAR | 12.91 | − 0.02248 | 1.02 × 10⁻⁵ |
| C6H10O5 | LVG | − 49191 | 109.97 | − 0.05743 |
| CH2O | FORMALD | − 7.91 | 0.017824 | − 9.44 × 10⁻⁶ |
| C2H6O | ETHANOL | − 4.13613 | 0.007301 | − 2.91 × 10⁻⁶ |
| CH3OH | METHANOL | − 3.09 | 0.00718 | − 3.87 × 10⁻⁶ |
| C2H4 | ETHYLENE | 4.14 | − 0.01 | 6.03 × 10⁻⁶ |
| C5H8O4 | XYLOSAN | − 4345 | 8.31 | − 0.00179 |
| C9H10O2 | COUMARYL | − 27.89 | 0.0374 | 9.93 × 10⁻⁶ |
| C6H6O | PHENOL | − 27.7 | 0.0273 | 3.83 × 10⁻⁵ |
| C11H12O4 | FE2MACR | 90610 | − 215.7 | 0.1285 |
Simulations were carried out using ASPEN PLUS [29]; the plant design and the flow process used to perform the pyrolysis are reported in Figure 4.
The initial feedstock passes through the inlet (S1). The dryer (B1) removes the moisture from the feedstock and ejects it at (S3). Afterwards, both the daf (dry and ash-free) and pre-heated materials are fed through (S2) to the Yield Reactor (B2). The thermochemical conversion of biomass is simulated by coupling the reactor with a calculator block. More precisely, the chosen reactor does not require exact information on the stoichiometry or kinetic of the material; users just need to specify the production yields of the involved chemical species. It is worth noting that, being these specifications independent from the temperature, the calculator block can be usefully implemented to deal with the formation of chemical species [43]. Outlet products from the reactor are directed in the cyclone (B3) for the gas–solid separation. The gas fraction is firstly cooled in a heat exchanger (B4) and then directed to the cleaning/washing section, simulated as a distillation column (B5). A second calculator is used to set the amount of water needed to enable the condensation process in the scrubber, also taking into consideration that the gas mixture leaving the reactor depends on the temperature. A water flow is then injected from (S8) to decrease the temperature and to separate the condensable products from the permanent gas. The water flow rate is an export-variable of the H2O calculator and is formulated as:
| (3.2) |
In this equation, and Tf,w (°C) are, respectively, the initial and final temperature of water in (S8), i.e. at the inlet and outlet of the scrubber, and cp,w (kJ∕kg⋅K) the heat capacity of water. At the numerator, and Ti,g are the mass flow rate and the temperature of the gas at the inlet of the line (S7). These values are defined in the calculator block as imported variables.
Simulation plant design and flow process.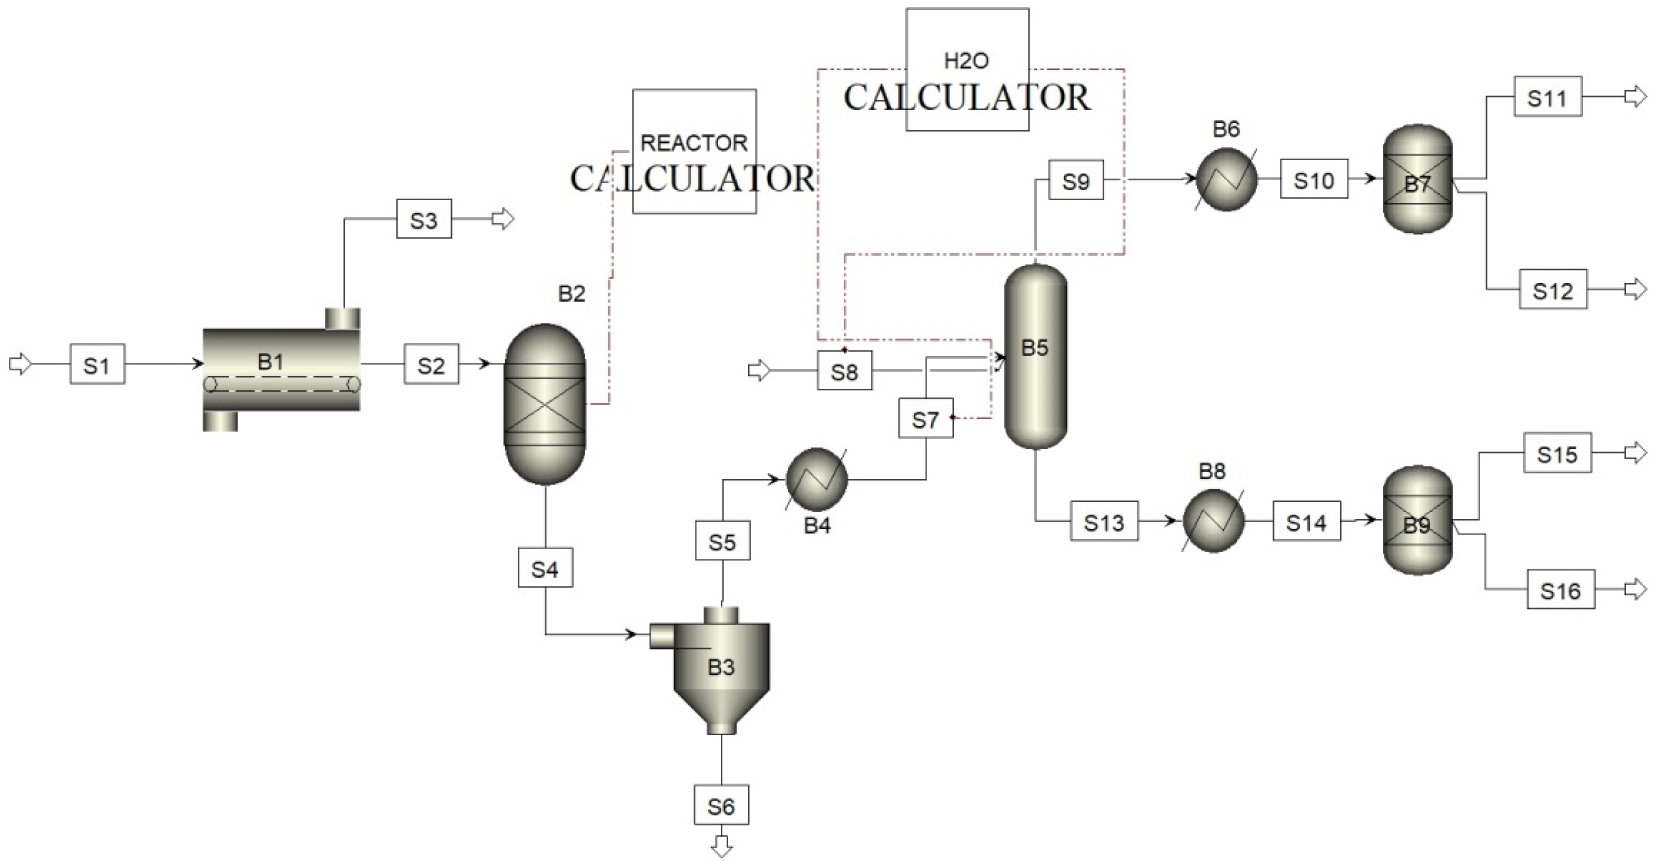
The yields of char, liquid and gaseous fractions as a function of the temperature are reported in Figure 5, whilst the evolution of the chemical species in the range 500 −−900 °C is illustrated in Figure 6.
Yields of the solid, liquid and gaseous fractions at the increase of the temperature.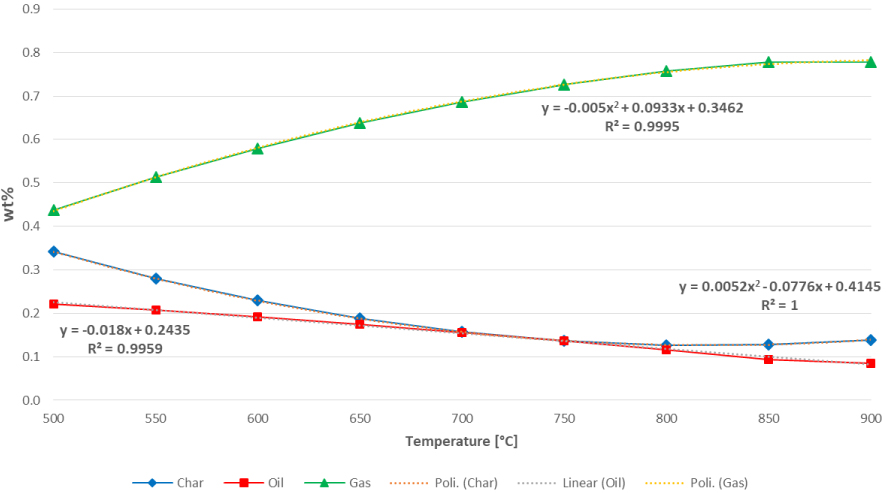
Char production has a decreasing trend up to 750 °C beyond which it becomes almost constant. Liquid production decreases slowly and continuously with temperature; this fraction needs some refinery stage to yield chemicals and biofuels.
Gas production shows a rapid increase up to 850 °C and then becomes stable at 900 °C. As said, the gas obtained from this process can be used to feed an engine for the cogeneration of electrical and thermal energy.
The yield of the three main pyrolysis products as a function of the temperature can be described by a polynomial or a linear interpolation. Interpolations provide a simple but effective way to estimate the analytical expression of any process. As can be seen from Figure 5, char and gas productions are well characterized by a quadratic function y = aT2 + bT + c, being respectively:
| (3.3) |
| (3.4) |
The sign of the term indicates either the convexity or concavity of the curve: indeed, in (3.3), as a result of the positive sign of the second-order term, the curve of the char yield is convex, whilst on the other case, in (3.4), the curve of the gas yield is concave.
Oil yield is better described by a simple linear interpolation y = mT + c, such as:
| (3.5) |
The analytical expression in (3.5) implies a constant decreasing trend of oil production (also confirmed by the negative sign of the slope ) at increasing the temperature.
A common way to evaluate the effectiveness of the derived analytical expressions consists of calculating the coefficient of determination R2. Values nearby the unit implies a good/optimal prediction capability of the model, i.e. a more than acceptable goodness of fit. From this perspective, as can be read in Figure 5, the derived analytical interpolations (both the quadratic for char and gas and the linear one characterizing the oil) can be considered satisfactory.
As said, the coefficient of determination is a good indicator to confirm the effectiveness of a given analytical law; however, to be more accurate, it could be helpful to include the evaluation of the coefficient of correlation r in the analysis as it allows measuring the strength of the analytical relation between the two variables concerning the simulated dataset.
The coefficient of correlation r can be either positive or negative: if one of the considered variable increases (as in the case of the temperature in the simulation model), the other variable increases (positive correlation) or decreases (negative correlation), as well. It can be calculated as the ratio between the covariance of two variables and the product of their standard deviations.
In this case, the coefficients of linear correlation are rchar = −0.9065, roil = −0.998 and rgas = 0.9675.
It is worth pointing that the coefficient of linear correlation implies some approximations for char and gas, both characterized by a quadratic expression, remaining however highly descriptive for the scope of this study. As can be noted, the coefficient of linear correlation is negative in the case of char and oil, highlighting that the increase of the temperature produces a decrease in the yield of both components. Vice versa for the gas, for which the direction of the relationship is positive, i.e. higher temperatures permit to achieve a higher amount of pyro-gas.
As regards the prediction of the chemical species, Figure 6 depicts the evolution of the main compounds deriving from the pyrolysis of cellulose, hemicellulose and lignin at increasing temperature. The chemical species with higher percentages are reported in Figure 6(a). A drop of carbon (C) can be observed between 450 °C and 700 °C probably due to the decrease of the char production in this temperature range. Similarly, CO2 decreases, whilst H2 and CO rapidly increase becoming the two main components around 750 −−800 °C. The increase of H2 combined with the increase of CO and CH4 and a consequent drop of CO2 significantly changes the composition and properties of pyro-gas. The water content is approximately constant during the considered interval. Cellulose, hemicellulose and lignin contribute to the production of methane CH4, which becomes particularly evident at higher temperatures, i.e. in correspondence with the higher production of pyro-gas.
Evolution of the chemical species.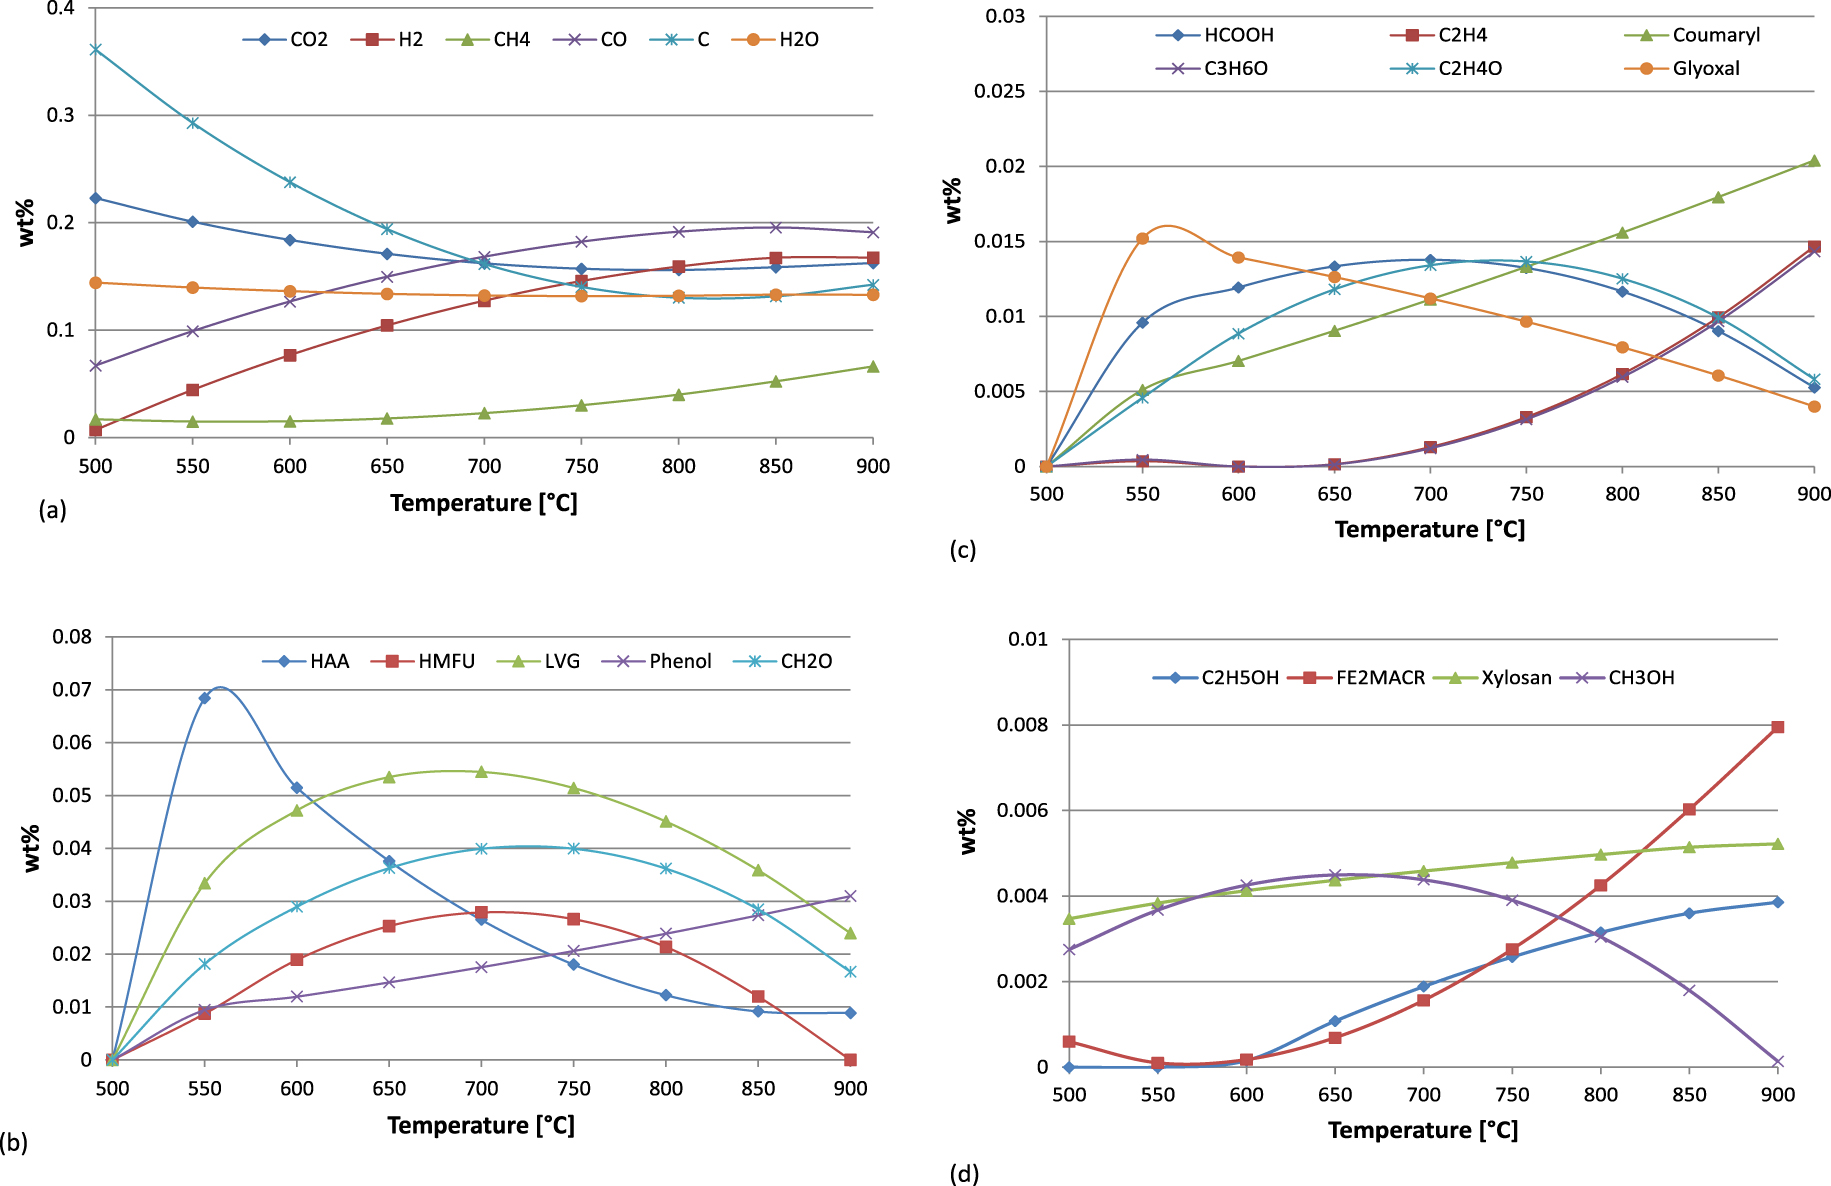
Going into the detail of the main biochemical components of biomass, during pyrolysis, cellulose degrades into water and carbon and, as a secondary reaction, in active cellulose CELL-A from which Levoglucosan LVG and other minor components derive. As can be seen, the percentage of CELL-A converted into LVG increases at higher temperatures, reaching a maximum of around 650 −−700 °C. Beyond LVG, cellulose thermal degradation produces other volatiles such as Hydroxyacetaldehyde HAA and Glyoxal, two of the main products deriving from pyrolysis of carbohydrates in biomass and directly affecting the formation of char (coherently with the fact that lower temperatures favour charring reactions and with the trend of HAA). At higher temperatures, typically beyond 600 °C, HAA decomposes into methane CH4, carbon monoxide CO, carbon dioxide CO2, Hydroxymethylfulfural HMFU, formaldehyde CH2O, ketene C2H2O and acetaldehyde C2H4O.
The decomposition scheme for hemicellulose proposed by Ranzi et al. [4] yields the two main activated hemicellulose, HCE1 and HCE2. The first compound, HCE1, decomposes into Xylosan and ethanol C2H5OH, whose evolutions display a slight increase at increasing the temperature. In minor percentages, other components deriving from the hemicellulose sub-components are methane CH4, formaldehyde CH2O and methanol CH3OH. The evolution of these last two compounds, i.e. formaldehyde and methanol, almost imitates the trends of the chemical species originating from cellulose, such as LVG and HMFU. In this sense, from the qualitative viewpoint, the pyrolysis of cellulose and hemicellulose is quite similar and the decomposition schemes for both components with respect to the temperature can be easily compared.
Finally, following the scheme of Ranzi et al. [3], lignin decomposes into LIG–C, LIG–H and LIG–O. The first sub-component, LIG–C, mainly decomposes into LIG–CC, whose evolution produces Coumaryl, phenol C6H6O and, in smaller quantities, methane CH4, carbon monoxide CO and carbon dioxide CO2. The other two sub-components, LIG–H and LIG–O, interact to obtain LIG–OH that decomposes into Sinapaldehyde FE2MACR.
3.1. Energy recovery line
To optimize the process, an energy recovery line consisting of a micro-CHP system with output power up to 100 kWe has been taken into account [44]. Calculations are based on the REC2-40G system of Enerblu Industry [45], working with an electrical output of 43 kWe in full-load and 22 kWe in half-load. The working temperature of 800 °C is chosen to investigate to what extent the heat generated from the combustion of the gaseous fraction in a CHP system can be recovered to feed the process. Outlet products from the reactor (S4), as obtained from the first calculator block using (3.1), are reported in Table 4.
Products at the reactor outlet
| Compound | kmol/h | mol% | kg/h | wt% |
|---|---|---|---|---|
| CO2 | 0.097393 | 2.99871 | 4.286245 | 14.28748 |
| HCOOH | 0.005385 | 0.1658 | 0.247844 | 0.826146 |
| HAA | 0.004189 | 0.128977 | 0.251558 | 0.838526 |
| H2 | 2.16926 | 66.79113 | 4.372967 | 14.57656 |
| CH4 | 0.068515 | 2.109562 | 1.09917 | 3.6639 |
| HMFU | 0.002608 | 0.08029 | 0.328859 | 1.096196 |
| LVG | 6.07 × 10⁻³ | 0.187036 | 0.984952 | 3.283173 |
| C2H5OH | 0.001879 | 0.057842 | 0.086546 | 0.288487 |
| C2H4 | 0.009743 | 0.299986 | 0.273329 | 0.911095 |
| Coumaryl | 0.003285 | 0.101144 | 0.493327 | 1.644425 |
| FE2MACR | 5.61 × 10⁻⁴ | 0.017274 | 1.17 × 10⁻¹ | 0.38937 |
| Phenol | 0.007979 | 0.245676 | 0.75094 | 2.503134 |
| Xylosan | 1.03 × 10⁻³ | 0.031813 | 1.37 × 10⁻¹ | 0.455022 |
| CH3OH | 0.002612 | 0.08041 | 0.083681 | 0.278936 |
| CH2O | 0.026043 | 0.80185 | 0.781966 | 2.606554 |
| C3H6O | 0.004576 | 0.140909 | 2.66 × 10⁻¹ | 0.886008 |
| C2H4O | 0.006188 | 0.190543 | 0.272622 | 0.908741 |
| Glyoxal | 0.002871 | 0.088397 | 0.166622 | 0.555405 |
| CO | 0.187901 | 5.785441 | 5.263186 | 17.54395 |
| Char | 0.297766 | 9.168156 | 3.576465 | 11.92155 |
| H2O | 0.341965 | 10.52905 | 6.160602 | 20.53534 |
| Total flow | 3.247826 | 100 | 30 | 100 |
These products enter the cyclone (B3) that separates about the 97.47% of the produced char, i.e. circa 3.5 kg/h of the initial feedstock. The remaining fraction, i.e. 26.5 kg/h, corresponds to the gas mixture exiting from the cyclone and moving towards the scrubber. In this section, Equations (2.7) and (3.2) are used into the second calculator block to define the heat capacity of the gas mixture and the water mass flow rate needed to cool the gas mixture and to separate the condensable products from permanent gas. In this specific case, these calculations give as results cp,g = 3.498 kJ∕kg⋅K and .
Figure 7 reports the products distribution at the end of the cycle. As can be seen, the yield of permanent gas is significantly higher than the other two pyrolysis products and has a production rate of circa 75%; char and oil have comparable yields, around the 12%.
Tables 5, 6 and 7 summarize the composition of the solid, liquid and gaseous fraction, respectively. Here, again, the high granularity of the chemical species can be considered as a benefit for the model, giving that such level of detail also leads to more aware choice with respect to the prime motor of the micro-CHP system.
As can be observed, the resulting chemicals from oil (Table 6) and gas (Table 7) are comparable; this, as explained by [16], can be since both gaseous and liquid products directly derive from secondary reactions of cellulose and hemicellulose, whose degradation mechanism and chemical composition can be considered similar.
Char production at the cyclone outlet (S6)
| Compound | kmol/h | kg/h |
|---|---|---|
| Char | 0.29 | 3.48 |
| T (°C) | 800 | |
Oil at the phase separator outlet (S16)
| Compound | kmol/h | mol% | kg/h | wt% |
|---|---|---|---|---|
| CO2 | 8.26 × 10⁻⁶ | 0.021464 | 3.63 × 10⁻⁴ | 0.011451 |
| HCOOH | 2.45 × 10⁻⁴ | 0.636238 | 0.011265 | 0.354976 |
| HAA | 0.00324 | 8.421775 | 0.194564 | 6.130782 |
| H2 | 2.44 × 10⁻⁶ | 0.00635 | 4.92 × 10⁻⁶ | 0.000155 |
| CH4 | 1.70 × 10⁻⁶ | 0.004406 | 2.72 × 10⁻⁵ | 0.000857 |
| HMFU | 2.61 × 10⁻³ | 6.778361 | 3.29 × 10⁻¹ | 10.36242 |
| LVG | 6.07 × 10⁻³ | 15.7903 | 9.85 × 10⁻¹ | 31.03614 |
| C2H5OH | 3.50 × 10⁻⁵ | 0.091078 | 0.001614 | 0.050863 |
| C2H4 | 9.12 × 10⁻⁷ | 0.002372 | 2.56 × 10⁻⁵ | 0.000807 |
| Coumaryl | 0.003232 | 8.400642 | 4.85 × 10⁻¹ | 15.29314 |
| FE2MACR | 5.61 × 10⁻⁴ | 1.458262 | 1.17 × 10⁻¹ | 3.680663 |
| Phenol | 0.007489 | 19.46657 | 0.704802 | 22.20854 |
| Xylosan | 1.03 × 10⁻³ | 2.685771 | 1.37 × 10⁻¹ | 4.301363 |
| CH3OH | 2.66 × 10⁻⁵ | 0.069131 | 0.000852 | 0.026852 |
| CH2O | 2.10 × 10⁻⁵ | 0.054619 | 0.000631 | 0.019881 |
| C3H6O | 1.96 × 10⁻⁵ | 0.050866 | 1.14 × 10⁻³ | 0.035813 |
| C2H4O | 1.60 × 10⁻⁵ | 0.041485 | 0.000703 | 0.022154 |
| Glyoxal | 1.84 × 10⁻⁵ | 0.047958 | 0.001071 | 0.03374 |
| CO | 2.21 × 10⁻⁶ | 0.005735 | 6.18 × 10⁻⁵ | 0.001947 |
| Char | 0.007543 | 19.60691 | 0.090598 | 2.854756 |
| H2O | 0.006294 | 16.3597 | 0.113382 | 3.572702 |
| Total | 0.038471 | 100 | 3.173564 | 100 |
| T (°C) | 65 | |||
At 800 °C, carbon monoxide CO is the predominant component reaching a fraction of 26%, followed by carbon dioxide CO2 and hydrogen H2 with a percentage of 21%. Before investigating the CHP energy performance, it is fundamental to conduct a preliminary analysis on the physical properties and of the energy content of the obtained gaseous fraction at the outlet of the phase separator (S12). The obtained results are summarized in Table 8.
Gas at the phase separator outlet (S12)
| Compound | kmol/h | mol% | kg/h | wt% |
|---|---|---|---|---|
| CO2 | 9.74 × 10⁻² | 3.505002 | 4.285882 | 20.59914194 |
| HCOOH | 0.00514 | 0.185 | 0.236579 | 1.137062126 |
| HAA | 0.000949 | 0.034158 | 0.056993 | 0.273925665 |
| H2 | 2.17 × 100 | 78.07438 | 4.372962 | 21.01767266 |
| CH4 | 6.85 × 10⁻² | 2.465883 | 1.099142 | 5.282782416 |
| HMFU | 5.64 × 10⁻⁹ | 2.03 × 10⁻⁷ | 7.12 × 10⁻⁷ | 3.42072 × 10⁻⁶ |
| C2H5OH | 0.001844 | 0.066353 | 0.084932 | 0.408206834 |
| C2H4 | 9.74 × 10⁻³ | 0.350632 | 0.273303 | 1.313570296 |
| Coumaryl | 5.32 × 10⁻⁵ | 0.001915 | 0.00799 | 0.038401491 |
| FE2MACR | 1.30 × 10⁻⁸ | 4.67 × 10⁻⁷ | 2.70 × 10⁻⁶ | 1.29981 × 10⁻⁵ |
| Phenol | 0.00049 | 0.017644 | 4.61 × 10⁻² | 0.221752071 |
| CH3OH | 0.002585 | 0.093037 | 0.082829 | 0.398096828 |
| CH2O | 0.026022 | 0.936555 | 0.781335 | 3.755314949 |
| C3H6O | 4.56 × 10⁻³ | 0.164009 | 0.264666 | 1.27205847 |
| C2H4O | 0.006173 | 0.222157 | 2.72 × 10⁻¹ | 1.306919849 |
| Glyoxal | 0.002853 | 0.102666 | 1.66 × 10⁻¹ | 0.795683709 |
| CO | 1.88 × 10⁻¹ | 6.762725 | 5.263124 | 25.29603902 |
| H2O | 0.194988 | 7.017886 | 3.512771 | 16.88335526 |
| Total | 2.778449 | 100 | 20.80612 | 100 |
| T (°C) | 65 | |||
Physical properties and energy content of the produced gas
| Compound | kmol/h | kg/h | Volume (m3) | 𝜌pg (kg∕m3) | cp,pg (kJ∕kg⋅K) | HHV (MJ/kg) | LHV (MJ/kg) |
|---|---|---|---|---|---|---|---|
| S12–Gas | 2.78 | 20.81 | 77.10 | 0.27 | 4.06 | 29.04 | 23.92 |
Starting from the molar compound, the partial pressure of each compound and the total density of the permanent gas 𝜌pg (i.e. the sum of the partial densities of each gas component) can be calculated. The same approach is used to derive the heat capacity of the gas mixture before condensation, as expressed in (2.6). Finally, the higher and lower heating values have been calculated by (2.9), (2.10) and (2.12).
The available power of the obtained gas can be obtained by multiplying the mass flow rate and the lower heating value LHV [46]. According to the available initial power, the chosen REC2-40G micro-CHP system works at 95.73% of the load. In accordance with the efficiencies specified in the datasheet of the company [45], the theoretical electrical and thermal power are reported in Table 9.
Theoretical electrical and thermal power
| Available initial power | Efficiency | Final power |
|---|---|---|
| Pg = 138.27 (kW) | 𝜂el = 29.5% | Pel = 40.79 (kWel) |
| 𝜂th = 62.5% | Pth = 86.42 (kWth) | |
The balances used for power generation are based on the scheme represented in Figure 3 [45]. The oxygen necessary to complete the combustion of the pyro-gas is calculated by (2.13). According to the literature, the Excess Air Coefficient 𝜆 vary between 1.5–2.5. In this study, 𝜆 = 1.8 is assumed as reference value [47, 48, 49]. Thus, the derived values used are listed in Table 10.
Mechanical power is obtained by the difference between the energy content of the pyro-gas, produced thermal power and power losses occurred during the cycle [25]. The power losses due to mechanical friction, heat losses and oil lubrication are assumed to be 5%. Thermal power coming from cooling water and exhaust gases is recovered through the two heat exchangers as depicted in Figure 4. The recovered thermal power values are
| (3.6) |
| (3.7) |
Assuming as energy efficiency for the alternator, the resulting electrical power will be Pel = 40.80 (kWel).
The Sankey diagram of Figure 8 shows the normalized input and output energy fluxes resulting from the combustion of the syngas in the micro-CHP system.
Products distribution at the end of the cycle.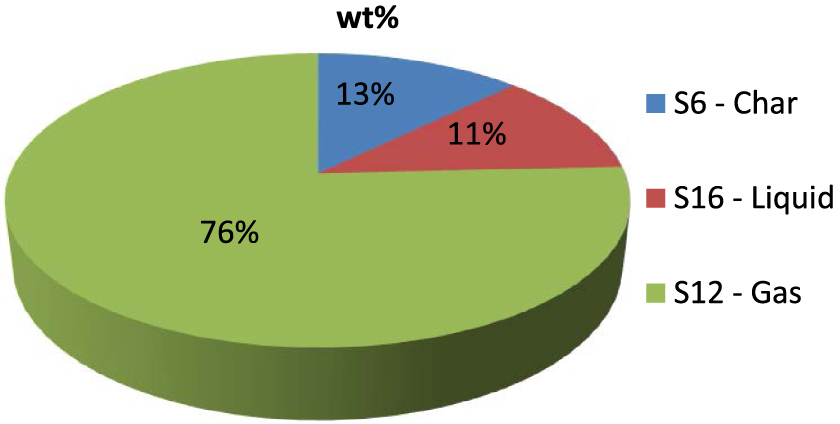
Sankey diagram for thermal energy fluxes.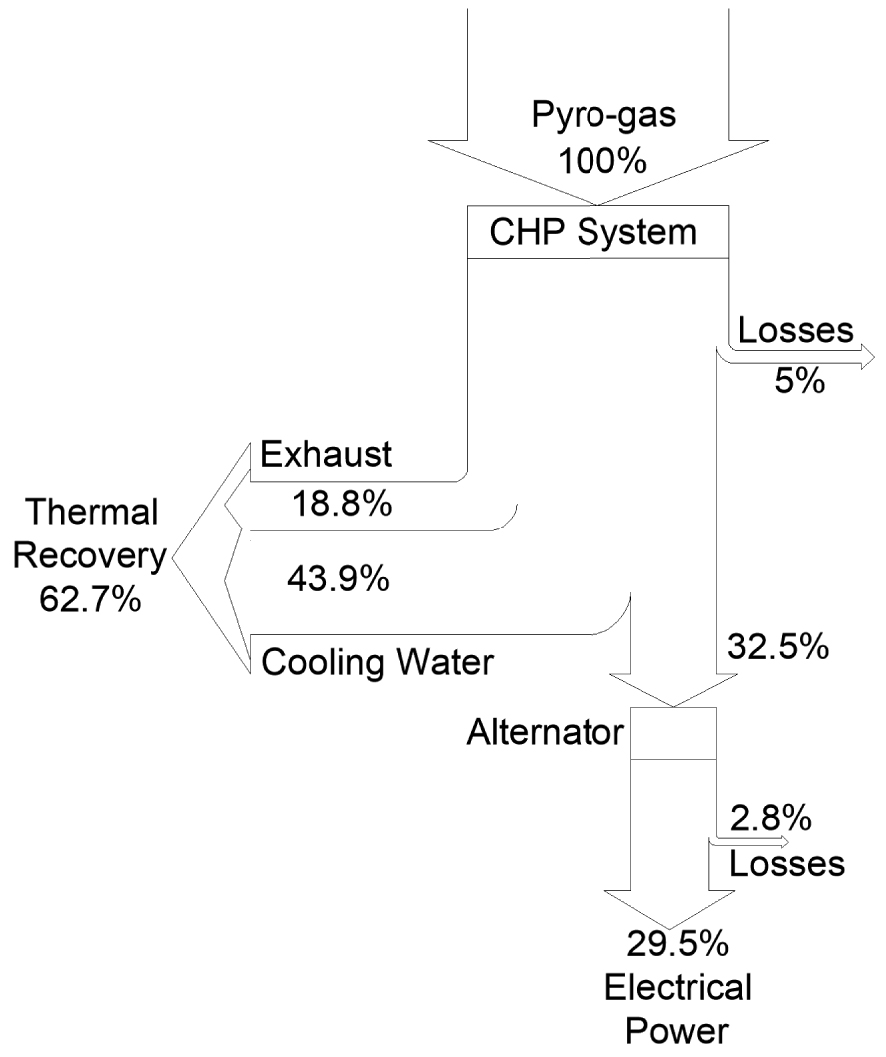
Air necessary for a complete combustion
| mO˙2 (kgO 2∕kgpyro) | mair,stoich (kgair∕kgpyro) | mair,p (kgair∕kgpyro) |
|---|---|---|
| 1.94 | 9.26 | 16.66 |
As can be observed from the diagram, a significant percentage of thermal recovery can be attained with respect to the initial percentage of biogas and being, moreover, the electrical power estimated to be around the 29.5%.
4. Conclusions
This research proposes a reliable and accurate model aiming at simulating the pyrolysis of biomass. The developed methodology permits to gain awareness on:
- The creation of suitable biomass to feed the process;
- The prediction of the production yield at the end of the cycle;
- The composition of primary products;
- The modelling of a micro-CHP system for the valorisation of the produced biogas.
The choice of a yield-reactor coupled with a calculator block allows operating on the evolution of products with temperature, improving the evaluation and checking stages. Results indicate that, within the range of the considered operative parameters, permanent gas grows at increasing temperature; instead, char and pyro-oil fractions decrease rapidly. Beyond the analysis of the macro-components of pyrolysis, the model is also able to offer a high granularity of the chemical species involved during the first and second reactions. This feature can be considered an added value for the proposed modelling methodology, also in view of the fact that a higher awareness of the composition of chemical species enhances the down-stream decisional process for any energy application purposes.
The proposed case study highlights that the micro-cogeneration unit effectively operates near the full-load, reaching interesting and promising results in terms of both thermal and electrical efficiency.
In particular, about 62.7% of thermal recovery can be attained with respect to the initial percentage of biogas and being, moreover, the power output estimated to be around 30%, which are very promising results.
In addition, the chosen system is also able to work in a wide range of load values (until 50%), allowing the implementation of the process even with lower input power. On the other hand, working at lower temperatures reduces the overall performances.
From the conducted analysis, the choice of the right micro-CHP system depends on the operative parameter of the plant: if it works every time at the same predetermined and standard temperature, it is possible to choose the system concerning that parameter. Otherwise, it is preferable to choose a system able to work in a wide range of input values, even with reduced efficiencies.
Further research will include the utilization of experimental data to improve the model and to highlight the dependence from other working parameters, such as the heating rate, residence time in the reactor and particle grind size, as well as a sensitivity analysis to deepen how biomass quality and types could affect the results.