


 CC-BY 4.0
1. Introduction
Since pioneering studies in the early 2000s [1], deep eutectic solvents (DESs) have developed as a new class of alternative solvents, complementing the potential offered by other unconventional media such as ionic liquids. They are promising in many applications [2, 3], notably as extracting media for natural compounds or for pesticide recovery or even for CO2 capture to name a few [4, 5, 6, 7, 8].
Conservatively, a DES is defined as a mixture of two or more H-bonded compounds that exhibits an eutectic point and large non-ideal mixing effects [9]. The non-ideal character of DES that relates to specific interactions between a hydrogen-bond donor (HBD) and a hydrogen-bond acceptor (HBA) significantly enhances the temperature depression of the melting point at the eutectic point. Interestingly, this effect has significantly expanded the number of candidates as ingredients for the formulation of these new solvents, as it allows the inclusion of compounds that are normally found in solid form at room temperature in their pure state. Beyond melting, non-ideality also implies that DESs present properties that differ from those of their constituents when considered independently, thus offering new opportunities to design solvents for specific applications.
The DESs have been divided into five classes. Notably, class III is of interest in this work where the HBA is an ionic constituent of an organic salt, typically a quaternary ammonium halide similarly to ionic liquids [10]. Type III systems have been largely represented in the DES panel, and are especially interesting for electrochemical applications. Most DESs proposed so far have been of hydrophilic nature although increasing their hydrophobicity has become an important goal in order to expand their application scope [11, 12]. For instance, higher hydrophobicity is interesting because it provides DESs the ability to dissolve natural products with limited water solubility like carotenoids for instance, also helping preserve their antioxidant properties [7] and enabling better performance in CO2 capture [8].
These characteristics are promoted by the combination of organic salts comprising long alkyl chains with poorly water miscible HBD molecules such as fatty acids. Since a pioneering study in 2015, such systems have been commonly classified as “hydrophobic DESs” due to their low water content and low ion leaching after mixing with water [12].
They have generally higher viscosities than hydrophilic DESs and exhibit lower to very weak conductivities. Few of them could be used as electrolytes in electrochemistry since the “hydrophobic DESs” often belong to type V, that is, composed solely of molecular substances [13, 14]. Yet, for application in electrochemistry, the composition of “hydrophobic DESs” necessarily involves an organic salt. However, a question arises about the evolution of polarity and conductivity as a function of molar composition and temperature. Herein, we address this point by focusing on one of the first reported and since widely studied “hydrophobic DESs” consisting of a mixture of decanoic acid (DA) as the HBD and tetrabutylammonium chloride (TBACl) as the HBA (Figure 1). We present a systematic study of thermal, dielectric, and ionic conductivities and electrochemical properties of the DA–TBACl mixture as a function of molar composition for three compositions (1:2, 1:1, 2:1) in order to cover the range of interest related to previous studies, including the most widely studied one (2:1) [11, 12]. The mixing of the corresponding eutectic mixtures with a large amount of water is also qualitatively investigated according to the molar ratios of eutectic components. The results show the strong impact of the hydrophobic DA component with respect to the ammonium salt to design a stable solvent of low polarity having good conductivity, reasonable viscosity, and good electrochemical property.
Chemical structure of (a) decanoic acid and (b) tetrabutylammonium chloride.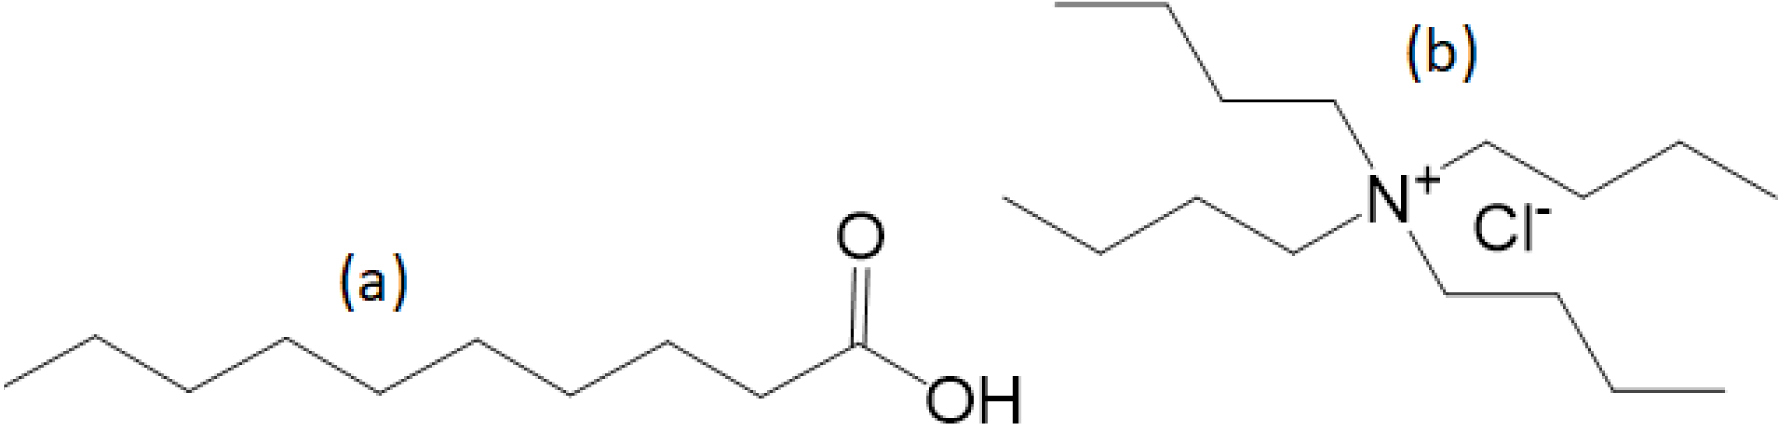
2. Materials and methods
The DA–TBACl liquid mixtures were prepared for three different compositions denoted as DA–TBACl (n:m), with n:m corresponding to the molar stoichiometry. DA and TBACl were purchased from Acros Organics and were used without further purification. DA (melting point 31.5 °C) and TBACl (melting point 83 °C–86 °C) were mixed in molar ratios 1:1, 2:1, and 1:2 at 80 °C under stirring for 2 h until a homogeneous and transparent liquid was obtained. Then, the mixtures were allowed to cool at room temperature and stored under ambient conditions. The colorless fluids are visually stable over time (more than 1 year). The water content of the resulting mixtures was determined by Karl Fischer titration (831 KF Coulometer with a generator electrode with diaphragm, Metrohm) with an average of three measurements: DA–TBACl (1:1) has 2.8% of water (w/w); DA–TBACl (2:1) has 1.7% of water (w/w); DA–TBACl (1:2) has 3.4% of water (w/w).
For differential scanning calorimetry (DSC) experiments, the weighted samples were sealed in Tzero© aluminum hermetic pans. The measurements were taken with a Q20 TA instrument equipped with a liquid nitrogen cooling system. The standard calibration of temperature and heat flux was performed by measuring the melting transition of an indium sample. Thermograms were acquired on cooling, followed by a heating ramp in the temperature range from −120 °C to 35 °C with the same scanning rate of 5 °C⋅min−1. For DA–TBACl (2:1), an additional measurement of the heating ramp at 5 °C⋅min−1 was recorded after a fast thermal quench at the maximum cooling rate (approximately 200 °C⋅min−1) to avoid crystallization (see the discussion in Section 3 for details).
For dielectric spectroscopy experiments, the samples were injected with a pipette between two stainless steel electrodes maintained by Teflon spacers in order to form a parallel plate capacitor geometry with a diameter of 20 mm and a spacing of 260 μm. During this operation, both the liquids and the sample cell were heated up to about 60 °C to decrease viscosity and ensure fast and complete filling of the cell by the action of capillary forces. Then, the cell was placed in a cryostat and maintained under a dry nitrogen atmosphere. The complex impedance of the as-prepared capacitor was measured from 1 Hz to 106 Hz with a Novocontrol high-resolution dielectric Alpha Analyzer with an active sample cell. The measurements were taken at thermal equilibrium along a cooling branch and a subsequent heating branch with a temperature step of 2 °C, and typically covering the temperature range from −120 °C to 60 °C. The temperature of the samples was controlled by a Quatro temperature controller (Novocontrol) with nitrogen as the heating/cooling agent providing a temperature stability within 0.1 °C. The temperature scan rate, although discontinuous, was 0.3 °C⋅min−1 on average.
For electrochemical experiments, the measurements were performed by using a home-made three-electrode cell [15]. A glassy carbon disk electrode (Ø 1 mm), a platinum wire, and a silver wire were used as working, counter, and quasi-reference electrodes, respectively. The working electrode was carefully polished with SiC paper and diamond paste (Struers) and then rinsed with ultrapure water and dried with argon flow prior to experiments. Cyclic voltammetry (CV) was carried out with an Autolab PGSTAT30 potentiostat/galvanostat (Metrohm Autolab BV).
3. Results and discussion
3.1. Differential scanning calorimetry
The phase behavior of the three different samples was determined by DSC. For the three systems, the same thermal cycling was first applied. It consists in cooling from 35 °C to −120 °C and heating up to 35 °C at 5 °C⋅min−1. For DA–TBACl (1:2) and DA–TBACl (1:1), no crystallization was observed, neither on cooling nor on heating as presented in Supplementary Information (Figures S1 and S2). This means that for these compositions, DA–TBACl mixtures can be easily supercooled and form very good glass-forming systems. Indeed, a glass transition was clearly demonstrated by a jump in the heat capacity. In contrast for DA–TBACl (2:1), crystallization occurred during cooling as indicated by an exothermic peak in Figure S3. This crystallization concerned only a fraction of the sample. In fact, the remaining liquid phase performed a glass transition and eventually fully crystallized during the subsequent heating (Figure S3). In order to form a glass that was free from partial crystallization, the DA–TBACl (2:1) system was quenched by cooling at the maximum rate (200 °C⋅min−1). Under these conditions, the absence of an exothermic signal during cooling indicated the successful formation of a pure amorphous glassy state.
On heating above the glass transition temperature Tg, the supercooled liquid of DA–TBACl (2:1) crystallized at −55 °C (cold crystallization) and then melted on a broad temperature with two main endothermic peaks centered at −25 °C and −10 °C. These features are characteristic of the melting of eutectic forming binary systems at a composition that differs from the eutectic point [16]. On the other hand, it has been shown that the DES exhibits a better glass-forming tendency for compositions neighboring the eutectic one as seen for the other two DA–TBACl systems. The precise determination of the eutectic point, though interesting, would require a systematic study of the entire phase diagram, which lies out of the scope of the present study dedicated to liquid phase properties. Moreover, due to its very good glass-forming capability on a broad range of compositions, the precise determination of the eutectic point would probably be elusive.
In order to focus on the long-time liquid dynamics, the glass transitions of the three samples are compared in Figure 2. On increasing the relative amount of organic salt (TBACl) in the mixture, the position of the heat capacity jump systematically shifted to a higher temperature, with the glass transition temperatures being respectively Tg = −83.8 °C, −76 °C, and −63.1 °C. This means that for this range of compositions, the relaxation dynamics of the mixture slow down by adding TBACl to DA. This is in agreement with the observed increase in viscosity of the solvents at room temperature.
Thermograms measured during heating at 5 °C⋅min−1 of DA–TBACl mixtures with compositions 2:1 (dash-dotted green), 1:1 (solid black), and 1:2 (dashed red). These heating ramps were acquired after cooling at the same rate except for DA–TBACl (2:1), where a thermal quench was applied.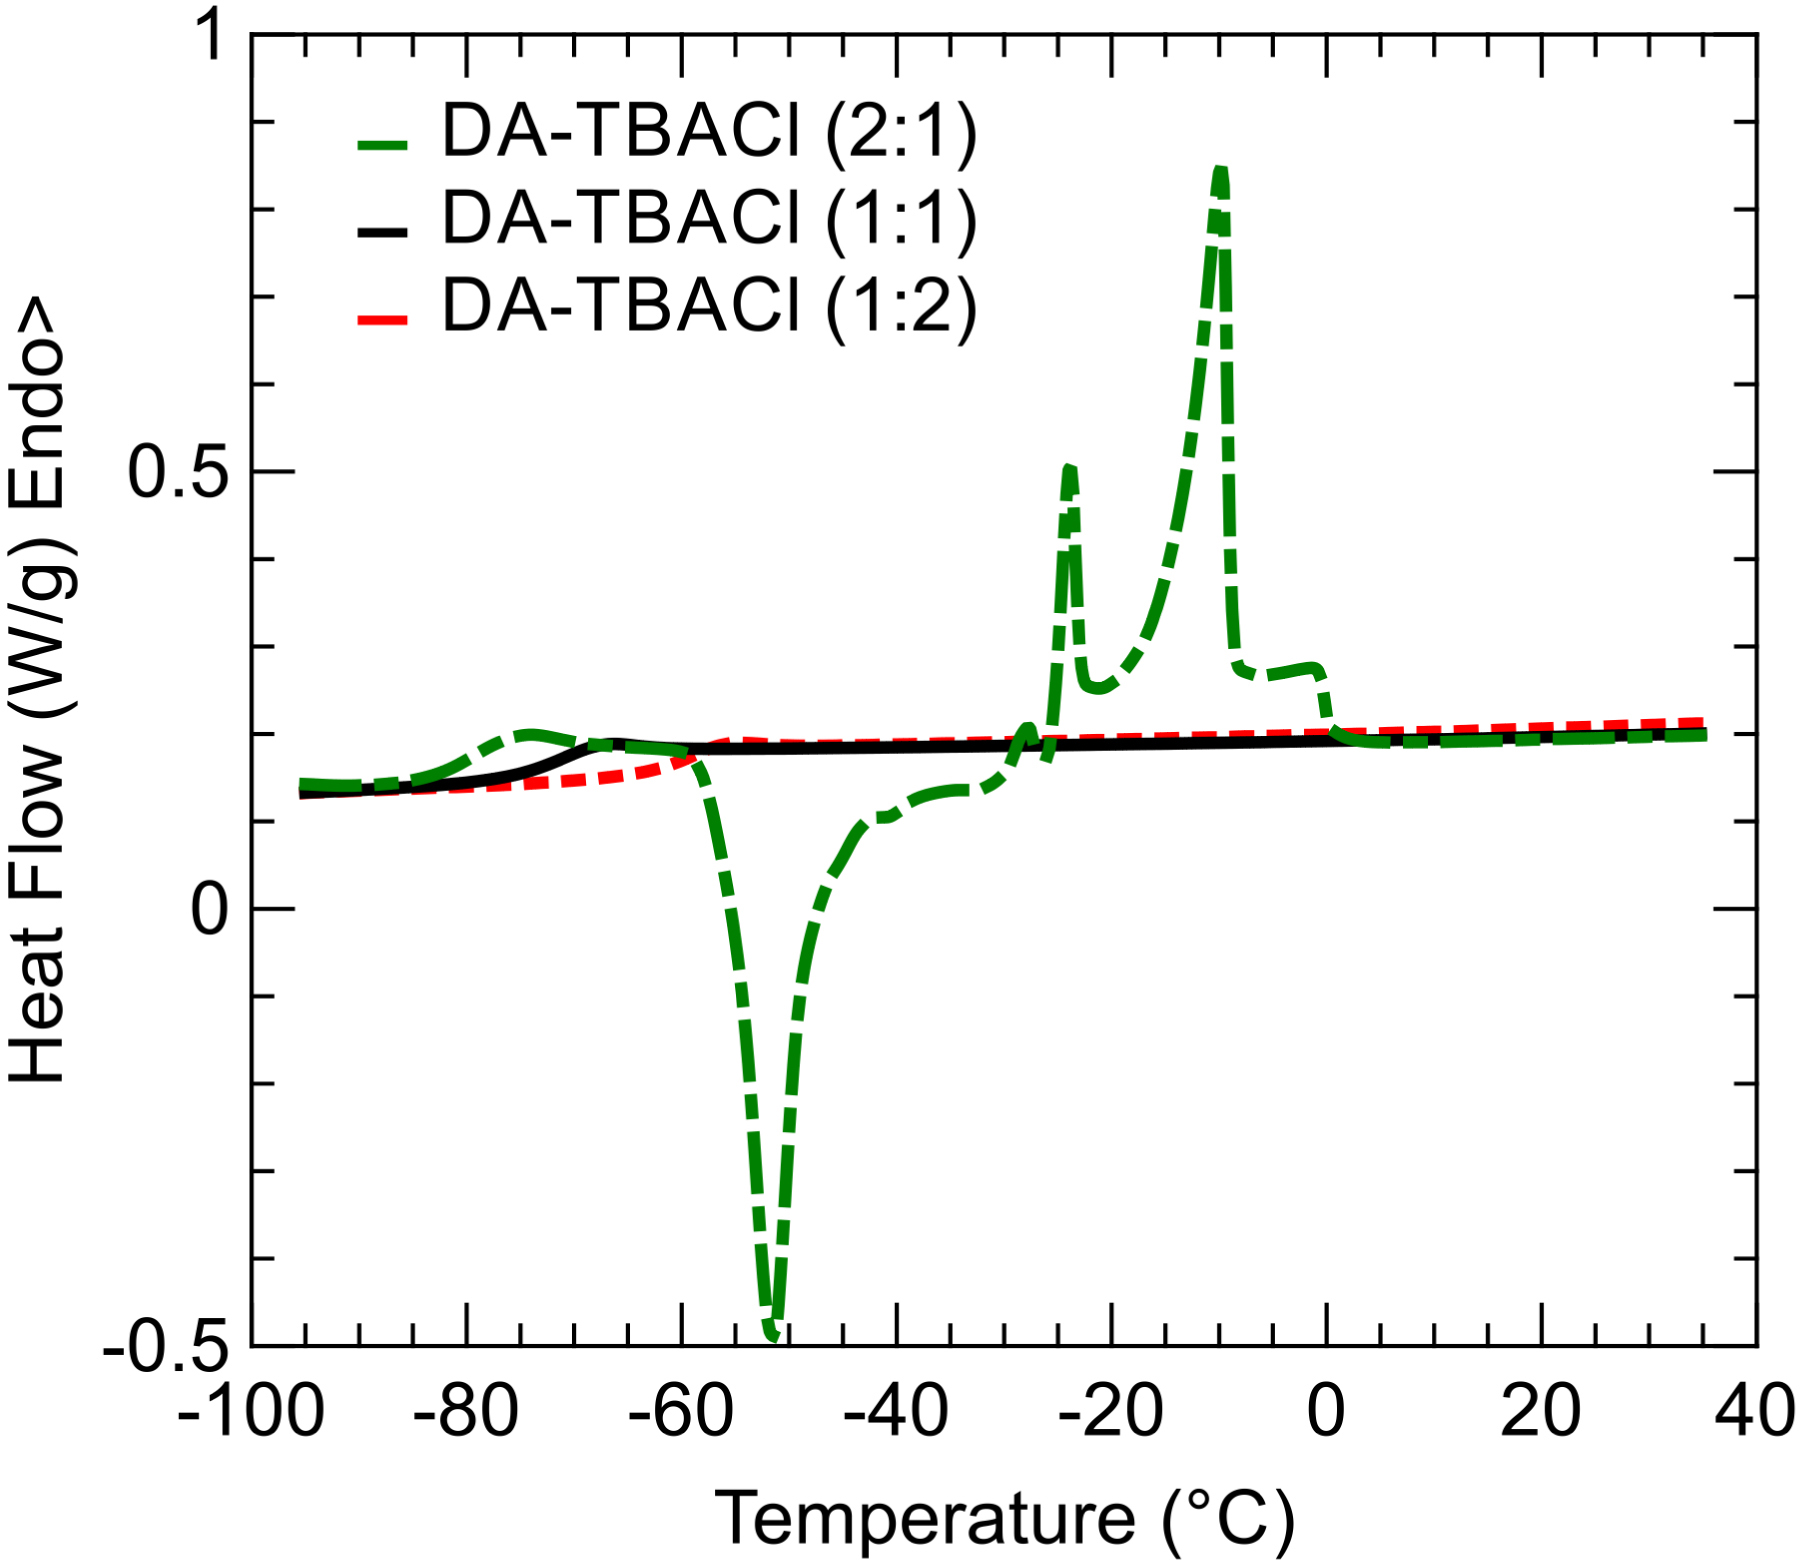
This dependence of Tg on the composition can be interpreted as resulting from an increase in intermolecular correlations between the different species of the mixtures due to enhanced H-bonds and electrostatic interactions between DA and TBACl. Such interactions are often invoked in DESs and also related to unusual thermodynamic or structural features, such as the formation of supramolecular species [17, 18, 19, 20, 21, 22]. However, it is worth pointing out that mixing effects on the dynamical properties of DESs are not systematically observed. For instance, opposite effects of adding choline chloride into neat polyols have been reported for glyceline and ethaline [23]. As a whole, the different dependences of the glassy dynamics on the composition of the liquid mixture illustrate the complexity of intermolecular correlations in DESs that result from the balance between H-bonds, electrostatic interactions, and herein, hydrophobic interactions.
The calorimetric glass transition offers a limited view of the DES dynamics, typically restricted to a relaxation timescale of the order of 102 s. This corresponds to a temperature at which the system is extremely viscous. In order to link the glass transition to the actual dynamics in the fluid liquid state, a complementary study by spectroscopic methods is valuable.
3.2. Dielectric spectroscopy
Dielectric spectroscopy has been demonstrated to be a very powerful method for DES studies [16, 23, 24, 25]. It covers an extended dynamical range bridging the gap from molecular to calorimetric timescales while providing insights into both the ionic transport (conductivity) and dipolar relaxation (polarization).
The complex dielectric function of the sample 𝜀∗(f) = 𝜀′(f) − i𝜀′′(f) was measured for the three samples by cooling steps of 2 °C, where f denotes the frequency of the electric field that ranges from 0.1 Hz to 1 MHz, 𝜀′ and 𝜀′′ are the real and loss parts of the complex dielectric function, and i symbolizes the imaginary unit [26]. They are illustrated in Figure 3 for DA–TBACl (1:1) and for a selection of temperatures. Different contributions can be identified as a function of frequency and temperature. First, a considerable increase in the real part of permittivity was observed at high temperature and low frequency. This effect is classically attributed to electrode polarization induced by the accumulation of ions at the surface of the blocking electrodes [26]. This phenomenon does not reveal any useful physical information about liquid properties, and its contribution to the total intensity could be simply accounted for by a phenomenological power law function.
(a) Real and (b) loss parts of the complex dielectric function of DA–TBACl (1:1) as a function of frequency for a selection of temperatures regularly spaced by steps of 2 °C (the lowest and highest temperature values are indicated in each panel). The total fitted functions (thin dashed lines) are virtually indistinguishable from the experimental data points (symbols). The individual contributions from dipolar relaxation (thick black solid line) and conductivity (thick dashed line) to the total fitted function are illustrated for the temperature T = −52 °C.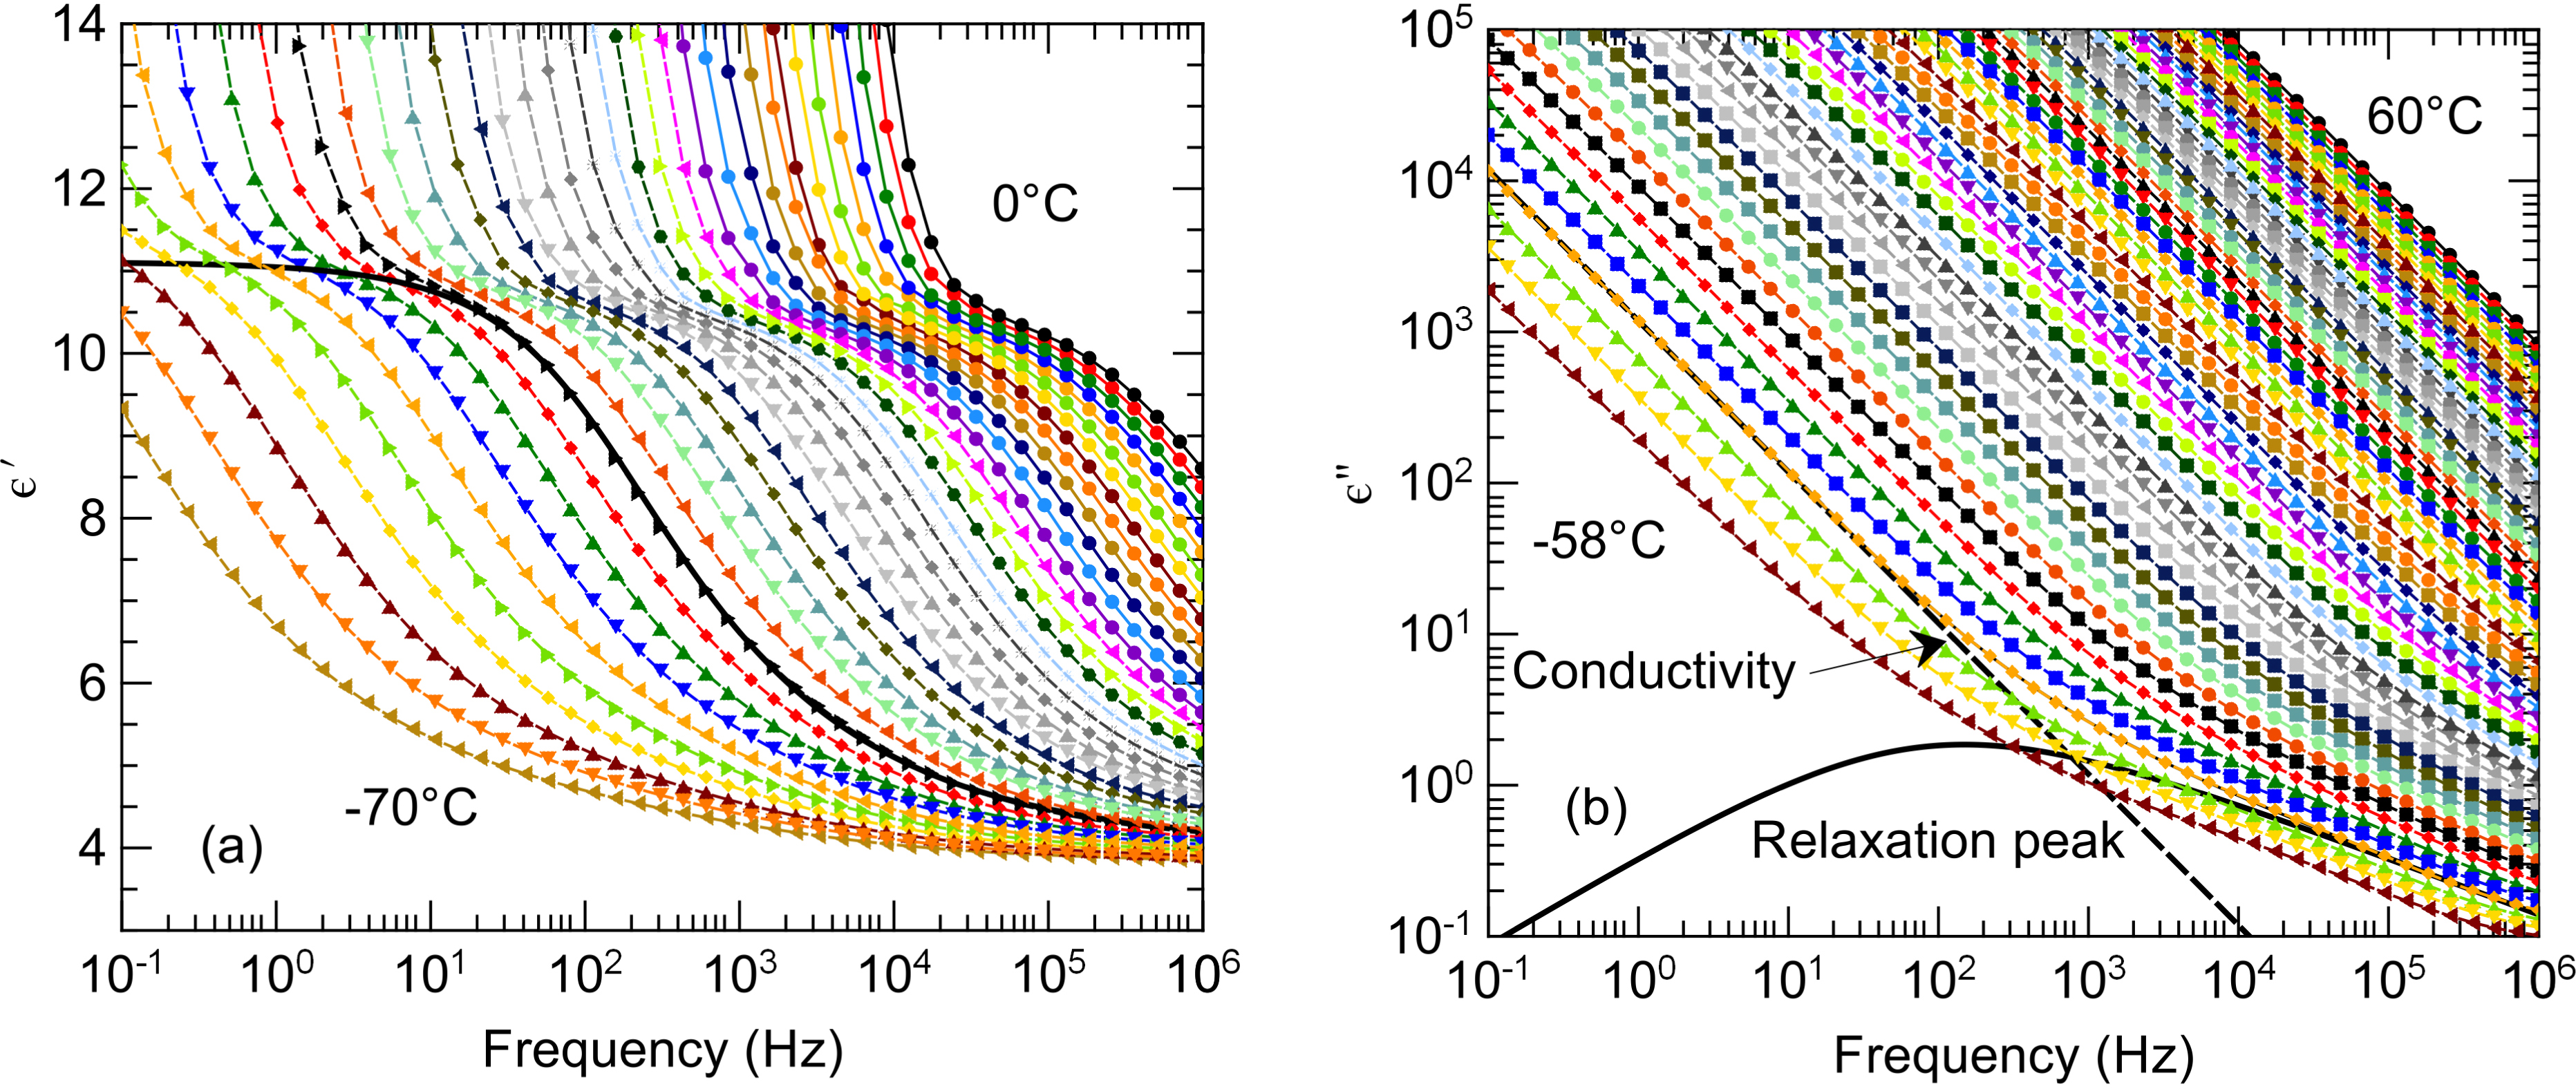
The most remarkable observed feature is the prominent dipolar relaxation process that is illustrated in Figure 3a by the jump of 𝜀′(f) from static permittivity 𝜀s to high-frequency permittivity 𝜀∞. This relaxation process is also apparent in the loss part 𝜀′′(f) although its corresponding peak (see the dashed line in Figure 3b) is overwhelmed by conductivity that additionally contributes to 𝜀′′(f).
The dielectric relaxation and the ionic conductivity were analyzed quantitatively at each temperature by fitting a model comprising a Havriliak and Negami function (HN-model) [27] and a dc-conductivity term according to Equation (1).
| (1) |
In this model, 𝜔 = 2πf, 𝜀∞ is the sample permittivity in the limit of high frequency, and Δ𝜀 = 𝜀s − 𝜀∞ and 𝜏HN are, respectively, the dielectric strength and the HN relaxation time; 𝜎 stands for the dc-conductivity of the sample and 𝜀0 the permittivity of vacuum. According to the formalism of the HN-model, the exponents 𝛼HN and 𝛽HN (0 < 𝛼HN; 𝛼HN𝛽HN ⩽ 1) are fractional parameters describing, respectively, the symmetric and asymmetric broadening of the complex dielectric function with respect to the Debye model.
First, we consider the static dielectric permittivity 𝜀s, which is an important indicator of the polar character of solvents. For DA–TBACl (2:1), we found 𝜀s = 6.5 ± 0.5, with negligible temperature effects in the range studied while larger values were found for the other two compositions (𝜀s = 11 ± 1). The increase in 𝜀s with the addition of TBACl when going from (2:1) to (1:1) is most probably associated with the large polar character of the ionic component TBACl. However, the saturation of 𝜀s with salt content when further increasing the fraction of TBACl from (1:1) to (1:2) demonstrates that not only the individual dipoles of species in the mixture but also their relative spatial arrangement determines the dielectric permittivity of the solvent. Indeed, the Kirkwood–Fröhlich formalism accounts for the role of angular correlations between the dipoles of different molecules present in the liquid. In this framework, the evolution of 𝜀s among the three samples would be consistent with the gradual formation of DA–TBACl supramolecular arrangements that promote the antiparallel dipolar configurations of TBACl ions [28]. This possibility definitely necessitates complementary structural characterizations as accessible by optical spectroscopy or diffraction methods.
Beyond static information gained from 𝜀s, we discuss now the liquid dynamics. The average relaxation time, which is classically related to the maximum peak position in the loss part of the complex dielectric function, was evaluated by Equation (2) [29].
| (2) |
The temperature dependence of the relaxation time is illustrated in Figure 4 in Arrhenius coordinates. Note that for DA–TBACl (2:1), the accessible temperature range was reduced due to crystallization on cooling at about −36 °C. Deviation from the Arrhenius law was observed for the three samples. This phenomenon is typical for supercooled liquids, and it has also been reported for many DESs [16, 23, 24, 25]. It is often associated with the emergence of cooperativity, which leads to an increase in the apparent activation energy on approaching the glass transition. Very good fits to the data were achieved with the VFT law as illustrated by the solid line. The extrapolation of the relaxation time using the VFT law toward 𝜏 = 102 s provides an estimate of the glass transition temperature that is in perfect agreement with the calorimetric temperature (see the symbol in Figure 3). This demonstrates that the dipolar relaxation measured by dielectric spectroscopy is directly coupled to the main structural relaxation of the liquid. A systematic slowdown of the relaxation dynamics is obtained when increasing the fraction of TBACl into the liquid mixture. This agrees with the conclusion made from the DSC part. In addition, we have used the Vogel–Fulcher–Tammann (VTF) fits to compute the fragility index m, which is a measure of deviation from the Arrhenius behavior [30]. The obtained values are in the range m = 58–81, and they increase with increasing TBACl fraction. They are located between values obtained for choline chloride based DESs and their aqueous solutions (m = 40–60) [23, 24], which are classified as intermediate liquids on the one hand, and hydrophobic DESs based on menthol–thymol mixtures (m = 77–86), which are classified as fragile (i.e., showing larger deviation from the Arrhenius law) on the other hand [16].
Arrhenius plot of the dipolar relaxation time of the studied DA–TBACl mixtures with compositions 2:1 (green triangles), 1:1 (black circles), and 1:2 (red squares). The calorimetric glass transition is indicated by the symbol located at 𝜏 = 102 s. VTF fits are illustrated by solid lines.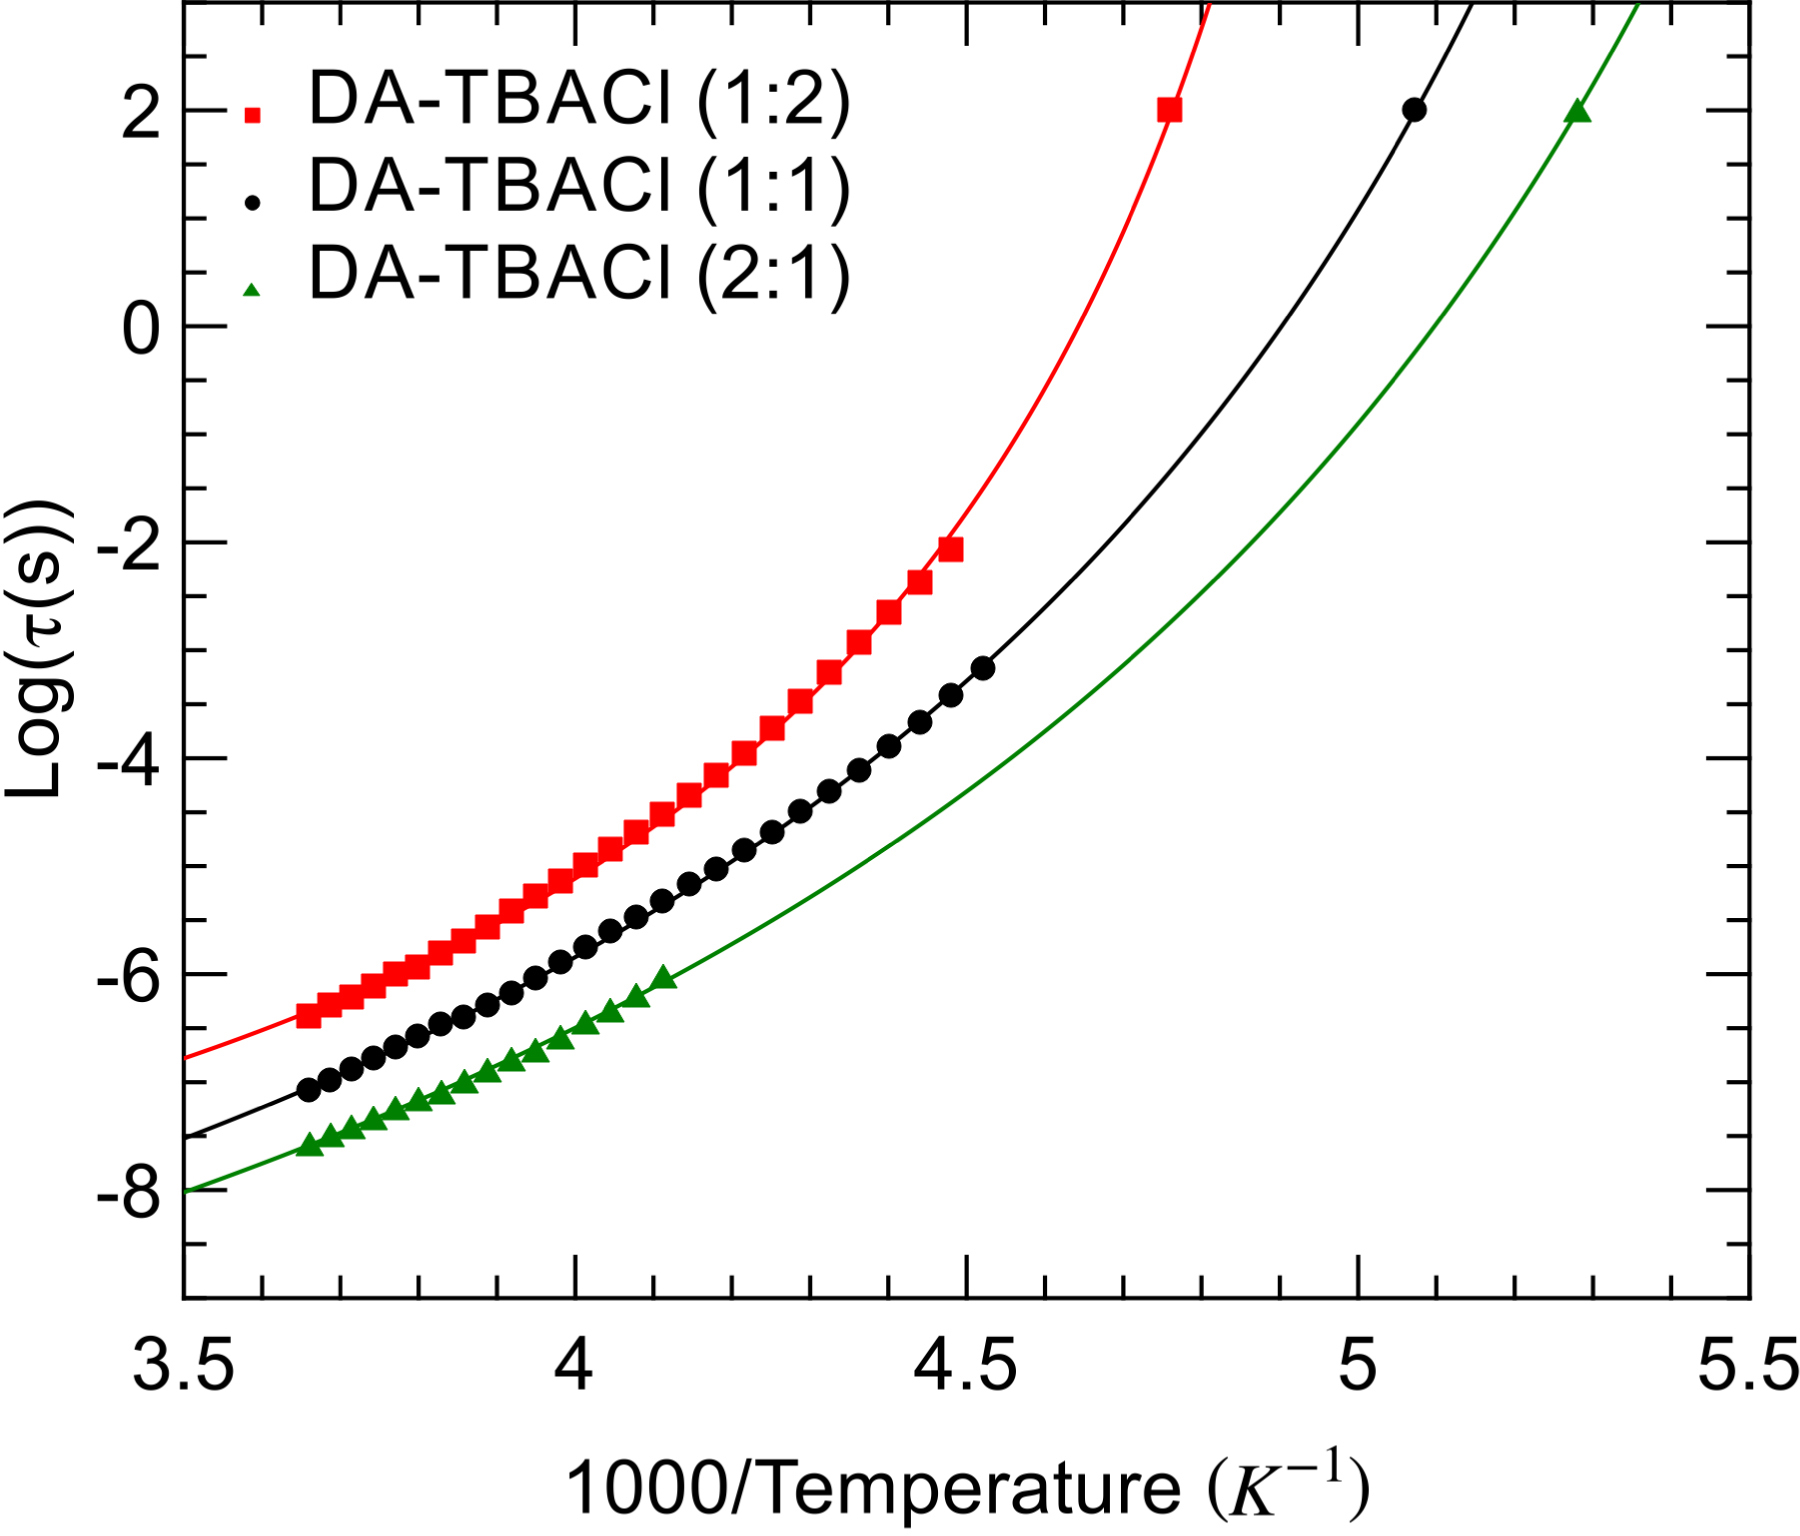
In addition to the temperature dependence of the average relaxation time, another important feature is the deviation of the dipolar relaxation function from a simple Debye process. This salient behavior can be expressed in time domain by a stretched exponential function e−(t/𝜏)𝛽, which is also known as the Kohlrausch–Williams–Watts (KWW) law. While simple Debye relaxation is recovered for 𝛽 = 1, a stretched relaxation process is obtained for lower values of the 𝛽 exponent. We evaluated the value of 𝛽 using HN fractional exponents obtained from the fit in the frequency domain and the numerical ansatz 𝛽 = (𝛼HN𝛽HN)1/1.23 [31].
On the temperature range studied, the stretching exponent was 𝛽 = 0.7 ± 0.05 for DA–TBACl (2:1), which indicates relatively weak deviation from the Debye law. On the contrary, much lower values of the KWW exponent (𝛽 = 0.45 ± 0.05) were found for the other two compositions having a larger fraction of ionic species, namely, (1:1) and (1:2). For glass-forming liquids, the non-Debye relaxation behavior is often attributed to dynamic heterogeneity. For DESs, dynamic heterogeneity possibly stems from the association of different components of mixtures, which has been shown to result in the formation of mesoscopic domains [20, 21, 22]. In this context, the broader distribution of relaxation times can arise from molecules experiencing different local environments.
3.3. Ionic dc-conductivity
Complementary to dipolar relaxation, dielectric spectroscopy experiments provide useful information about liquid dynamics from dc-conductivity. As shown in Figure 3b, the conductivity of DESs appears as an intense component of the loss part of the dielectric function, which is inversely proportional to frequency,
The temperature dependence of conductivity, as determined by the fitting of Equation (1), is illustrated in Figure 5 in Arrhenius coordinates. For all samples, a super-Arrhenius behavior is obtained, which again could be well reproduced by a VTF model. This temperature behavior is close to that of dipolar relaxation, which suggests that both properties are actually linked. A possible explanation is that both processes reflect the temperature dependence of viscosity. On the one hand, dielectric relaxation relates to a large extent to the rotational dynamics of dipolar species. Assuming the validity of classical hydrodynamic laws, the relaxation time should scale with the viscosity 𝜂 according to the Stokes–Einstein–Debye equation 𝜏 ∝ 8πr𝜂/(k T), with r being the hydrodynamic radius. On the other hand, the ionic conductivity should be inversely proportional to the viscosity, assuming that both the Nernst–Einstein and Stokes–Einstein relations apply. This predicted behavior was actually confirmed for DA–TBACl (2:1) and (1:1) as illustrated in Figure S4. Contrariwise, this scaling law was only partly obeyed for DA–TBACl (1:2), which showed deviation in the high temperature limit.
Arrhenius plot of the dc-conductivity of the studied DA–TBACl mixtures with compositions 2:1 (green triangles), 1:1 (black circles), and 1:2 (red squares). VTF fits are illustrated by solid lines.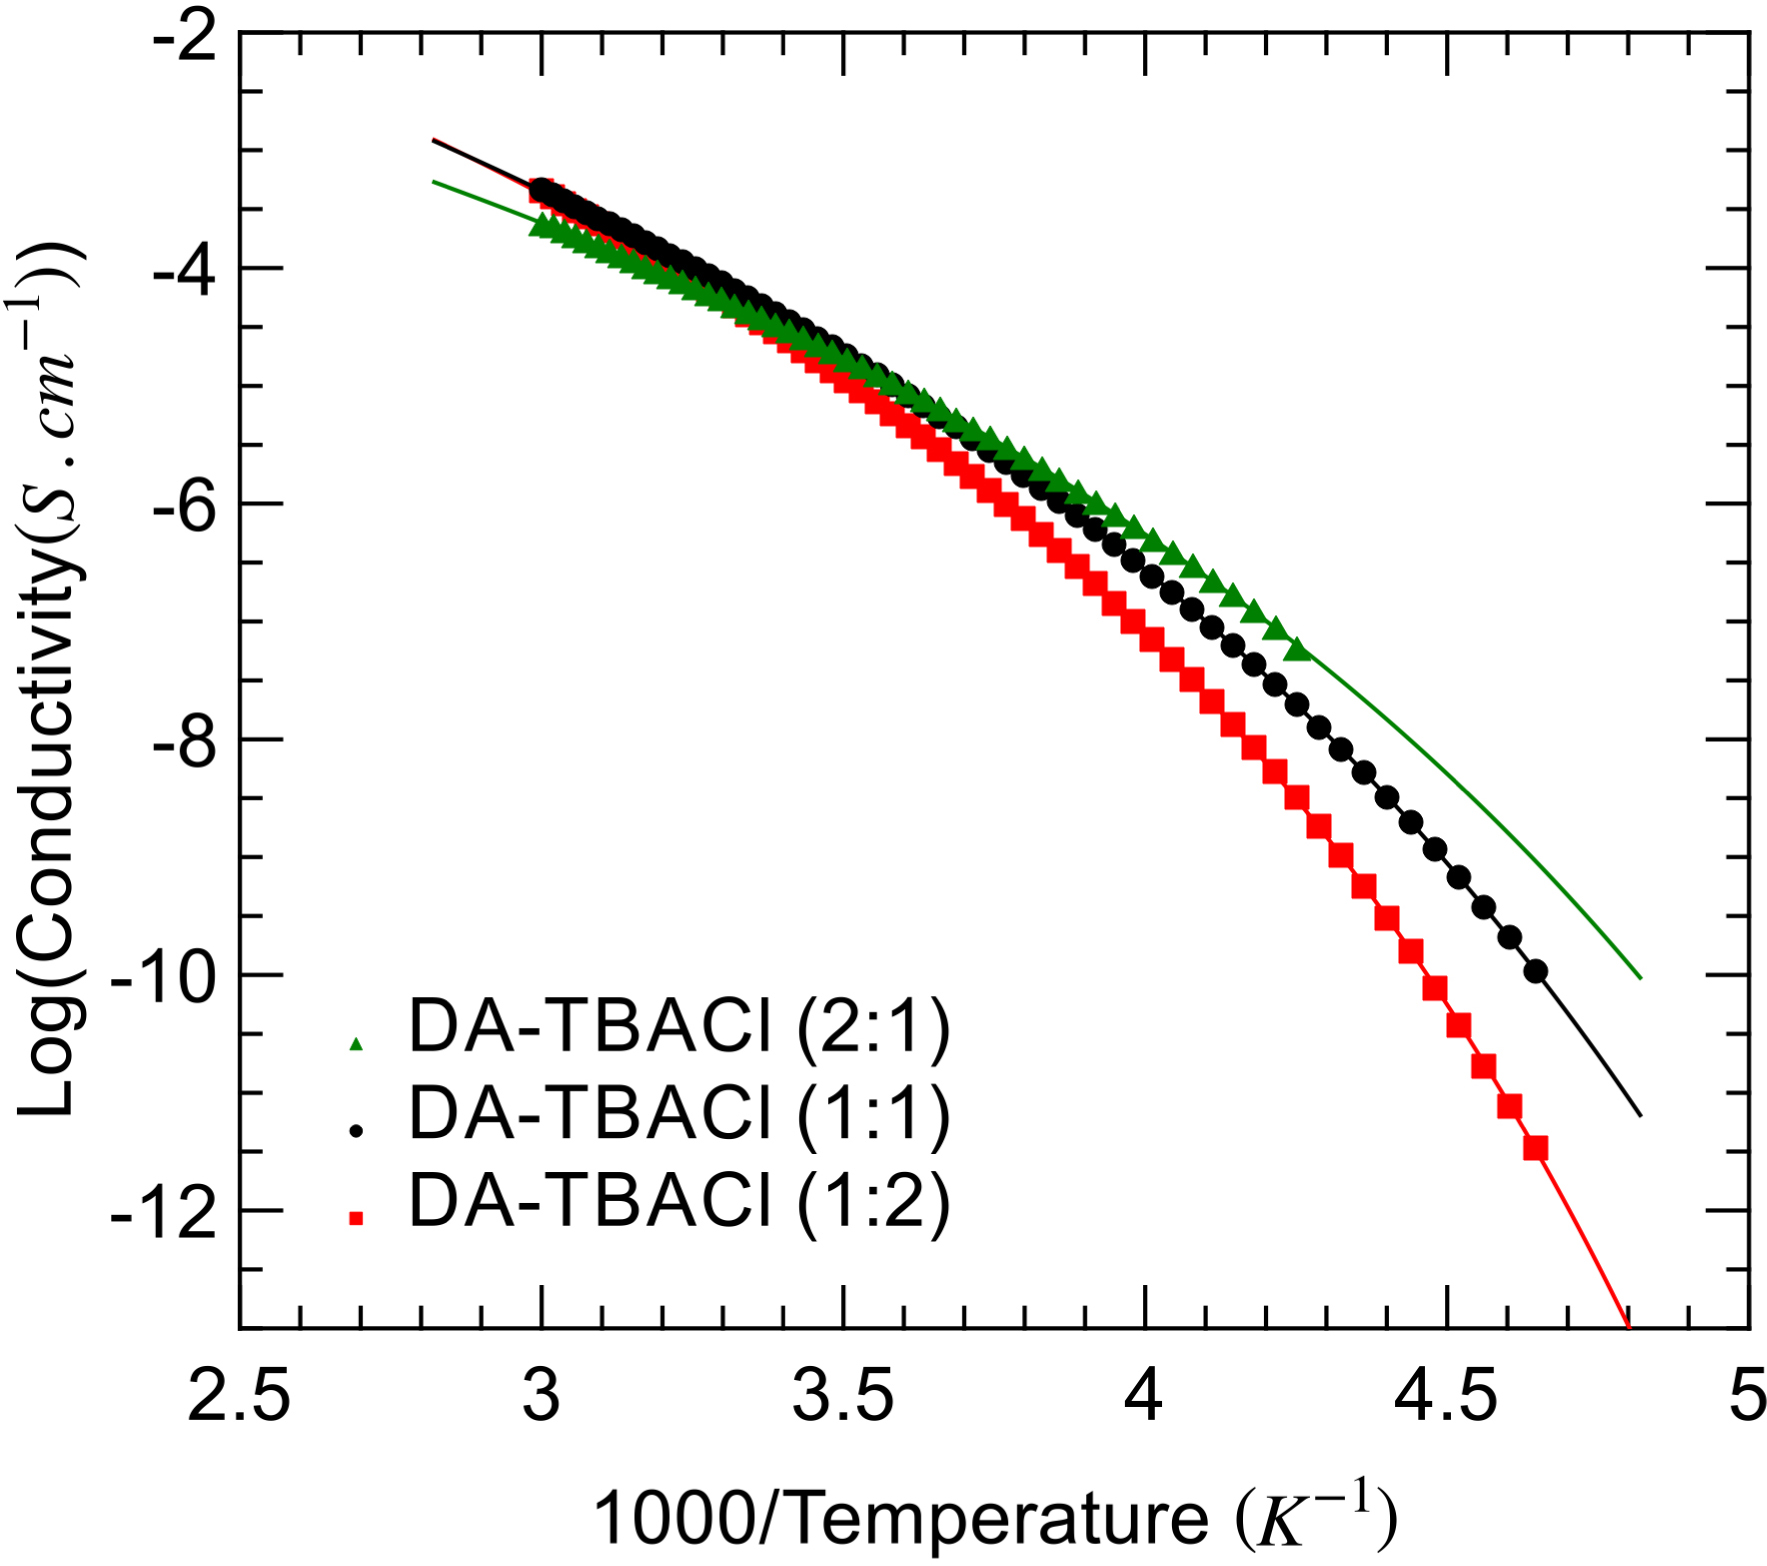
In the literature, different situations have been recently reported about the (de-)coupling between rotation and translation dynamics in DESs. In the case of the prototypical ionic DES ethaline, translation–rotation decoupling was observed neither for the neat mixture nor for its moderately hydrated variants [23, 24, 25]. For the non-ionic menthol–thymol DES instead, a power law 𝜎 ∝ 𝜏−𝛼 was observed, with a fractional exponent 𝛼 that was close to unity for equimolar composition but increasingly deviated as the fraction of thymol in the mixture increased [16]. This partial decoupling was interpreted as a possible hint for the development of spatial dynamic heterogeneities in this range of compositions. Similarly, for reline, the deviation from the Walden rule that links ionic conductivity to viscosity was reported [25]. The presence of complex supramolecular structures was invoked as a possible origin of this unusual charge transport. Although based solely on dynamical properties, the observation made for DA–TBACl by increasing the amount of salt also points toward the possible formation of supramolecular entities involving both ionic (TBACl) and H-bond donors (DA).
Finally, the inversion in the order of conductivity values, which intersect approximately at room temperature, reflects the different impacts of TBACl on the liquid property. On the one hand, going from (2:1) to (1:2), DA–TBACl increases both the concentration of ionic mobile species and water content, which contributes to high conductivity at high temperature. On the other hand, it increases liquid fragility, which has a negative impact on conductivity at sub-ambient temperature since viscosity increases more drastically on cooling with TBACl stoichiometry.
3.4. Electrochemistry
The electrochemical behavior of the three mixtures is displayed in Figure 6. The CVs have been recorded using a glassy carbon electrode with anodic and cathodic potential limits arbitrarily chosen. In agreement with the results above, all the mixtures are sufficiently conducting to serve as electrolytes. The electrochemical window (i.e., the potential range between anodic and cathodic limits) is relatively shrunk compared to ionic liquids. The potential windows are about 2 V while ionic liquids show typical windows of 4.5–5 V [32]. This is probably due to the presence of water (2–3 wt%) and oxygen from air that accompanies water. However, the corresponding electrochemical windows are still larger than that of aqueous electrolytes.
Cyclic voltammetries of the three DA–TBACl mixtures at 0.2 V⋅s−1 at a glassy carbon disk electrode: DA–TBACl (1:1) (black), DA–TBACl (2:1) (green), and DA–TBACl (1:2) (red).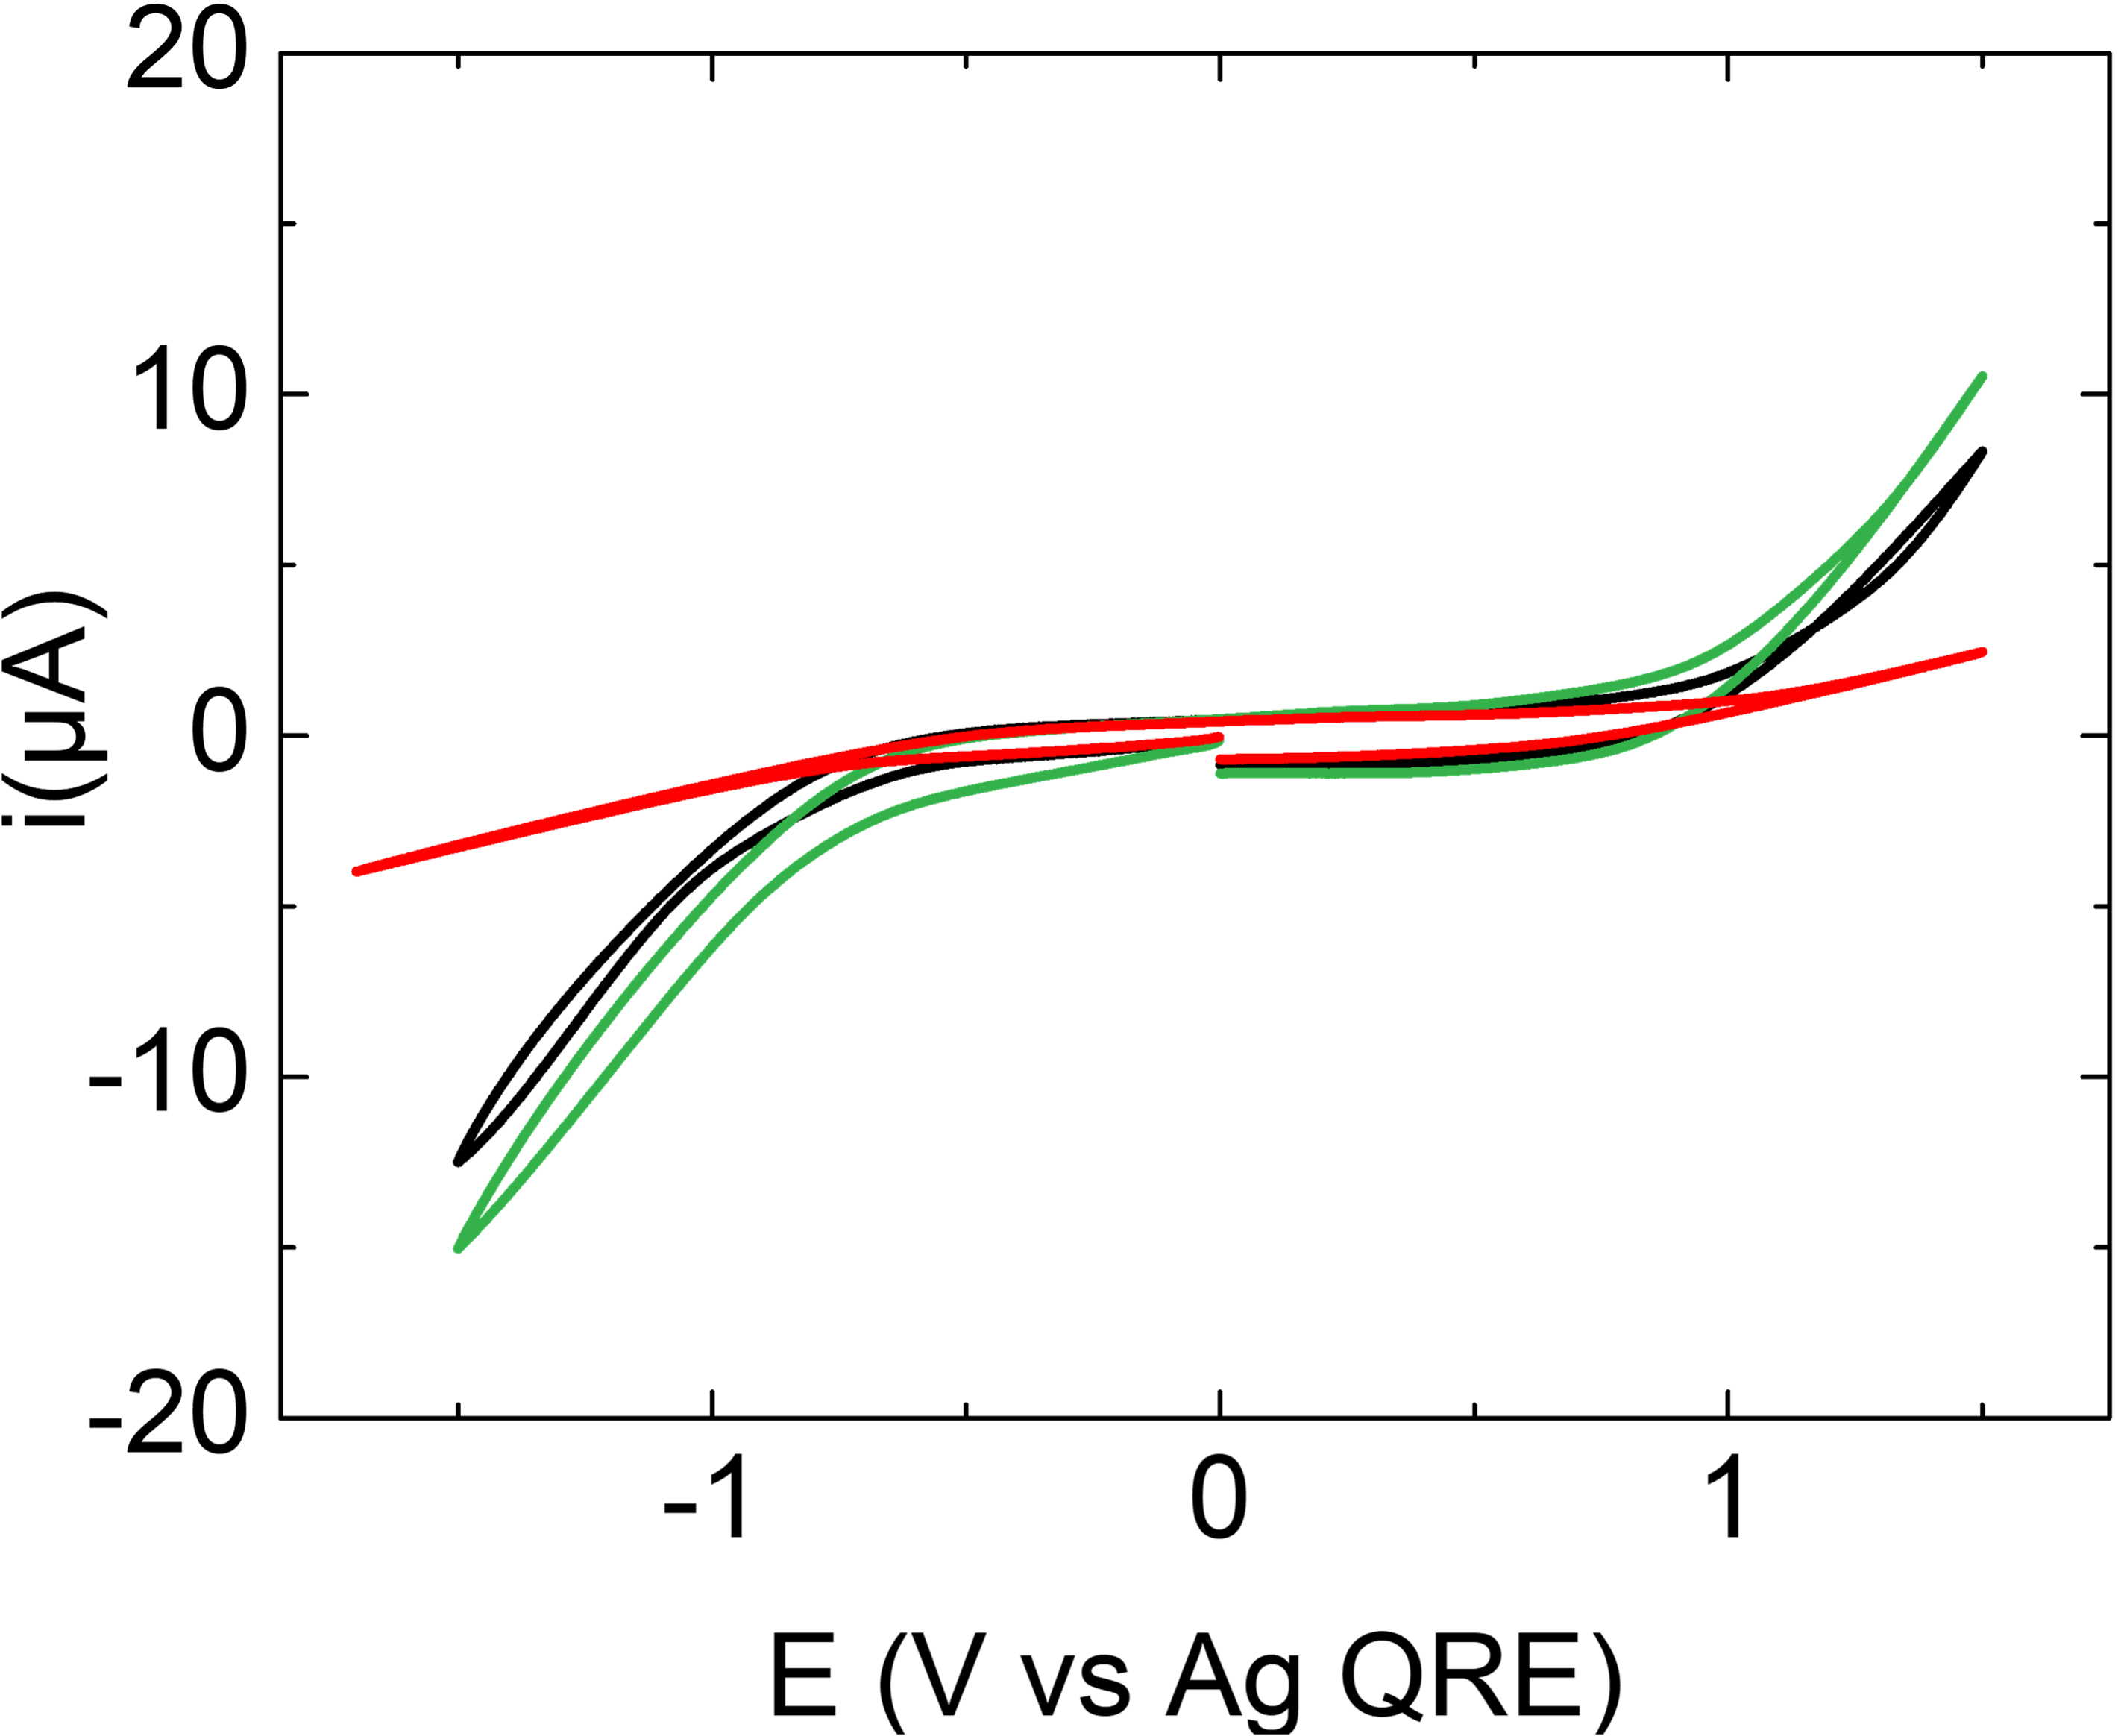
Another interesting point is the shape of the CVs. The CV shape for DA–TBACl (1:2) is different from that for DA–TBACl (1:1) and DA–TBACl (2:1). On the one hand DA–TBACl (1:1) and DA–TBACl (2:1) show similar behavior, but on the other hand the CV corresponding to DA–TBACl (1:2) is much more flattened than the former two. This indicates a more resistive behavior of DA–TBACl (1:2) than those of the other two compositions. This observation is in fair agreement with the ionic dc-conductivity analyses.
3.5. Behavior of mixtures with water: qualitative examination
Hydrophobicity of the DES could be qualitatively assessed by the appearance of a phase separation after being mixed with a large amount of water. After vigorous stirring at ambient temperature, the three compositions tend to phase-separate (Figure 7) just after mixing with 29 wt% of water. These behaviors are in good agreement with the dielectric measurements above, suggesting that all the compositions give non-polar fluids. However, after 3 days, another equilibrium is reached and only the composition DA–TBACl (2:1) still exhibits a phase separation with water while the other two compositions remain mixed with water (Figure 7). Considering that TBACl is a hydrophilic and DA a hydrophobic component, these observations show that the hydrophobicity character obviously stems from DA, which is in molar excess for this mixture composition. Of course, leaching of the hydrophilic component could occur in the water-rich phase as already observed [5]. The clear mixing of hydrophobic DES with water is known to be sensitive to the amount of water. For instance, the upper limit is found around 10 wt% for a DES formed with decanoic acid and tetrabutylammonium bromide (2:1) [8]. A higher value of the water content upper limit is nevertheless found herein although tetrabutylammonium bromide is less hydrophilic than its corresponding chloride counterpart. Interestingly, we also observe that water mixing is also strongly dependent on the molar ratio composition. A more precise microscopic description of the DES would be interesting to better understand the phenomenon. However, we may rationalize the observations on the basis of hydrogen-bonding effects since these interactions are of major importance in the preparation of these mixtures. Indeed in the DES, TBACl is likely to be hydrogen-bonded with DA to form a stable structure even if a small amount of water is part of the structure, probably through the formation of hydrogen bonds between the eutectic and water. When increasing the water content, a competition may occur between the formation of hydrogen bonds of water with the HBD and HBA components of the eutectic mixture and the formation of hydrogen bonds between the two components that preserve the eutectic structure. At a certain point, and for a large amount of water, the hydrogen bonds arise mainly from the association of water-isolated components, hence destroying the fluid structure to enable efficient mixing with water. In the case of choline chloride based DESs, a cross-over separating two distinct thermodynamic behaviors was observed for a water content of 30 wt% from a “water-in-DES” to “DES-in-water” situation although no macroscopic liquid–liquid phase separation occurred at room temperature due to their strong hydrophilic character compared to DA–TBACl [33, 34, 35]. A larger amount of HBD, namely, DA helps maintain the structure even if the eutectic point is not necessarily reached. Hydrophobic eutectic mixtures can form stable mixing systems with a certain molar fraction of water depending on their own molar composition.
Pictures of 800 μL DA–TBACl (1:1), DA–TBACl (2:1), and DA–TBACl (1:2) just after mixing with 300 μL of water (top) and after 3 days (bottom).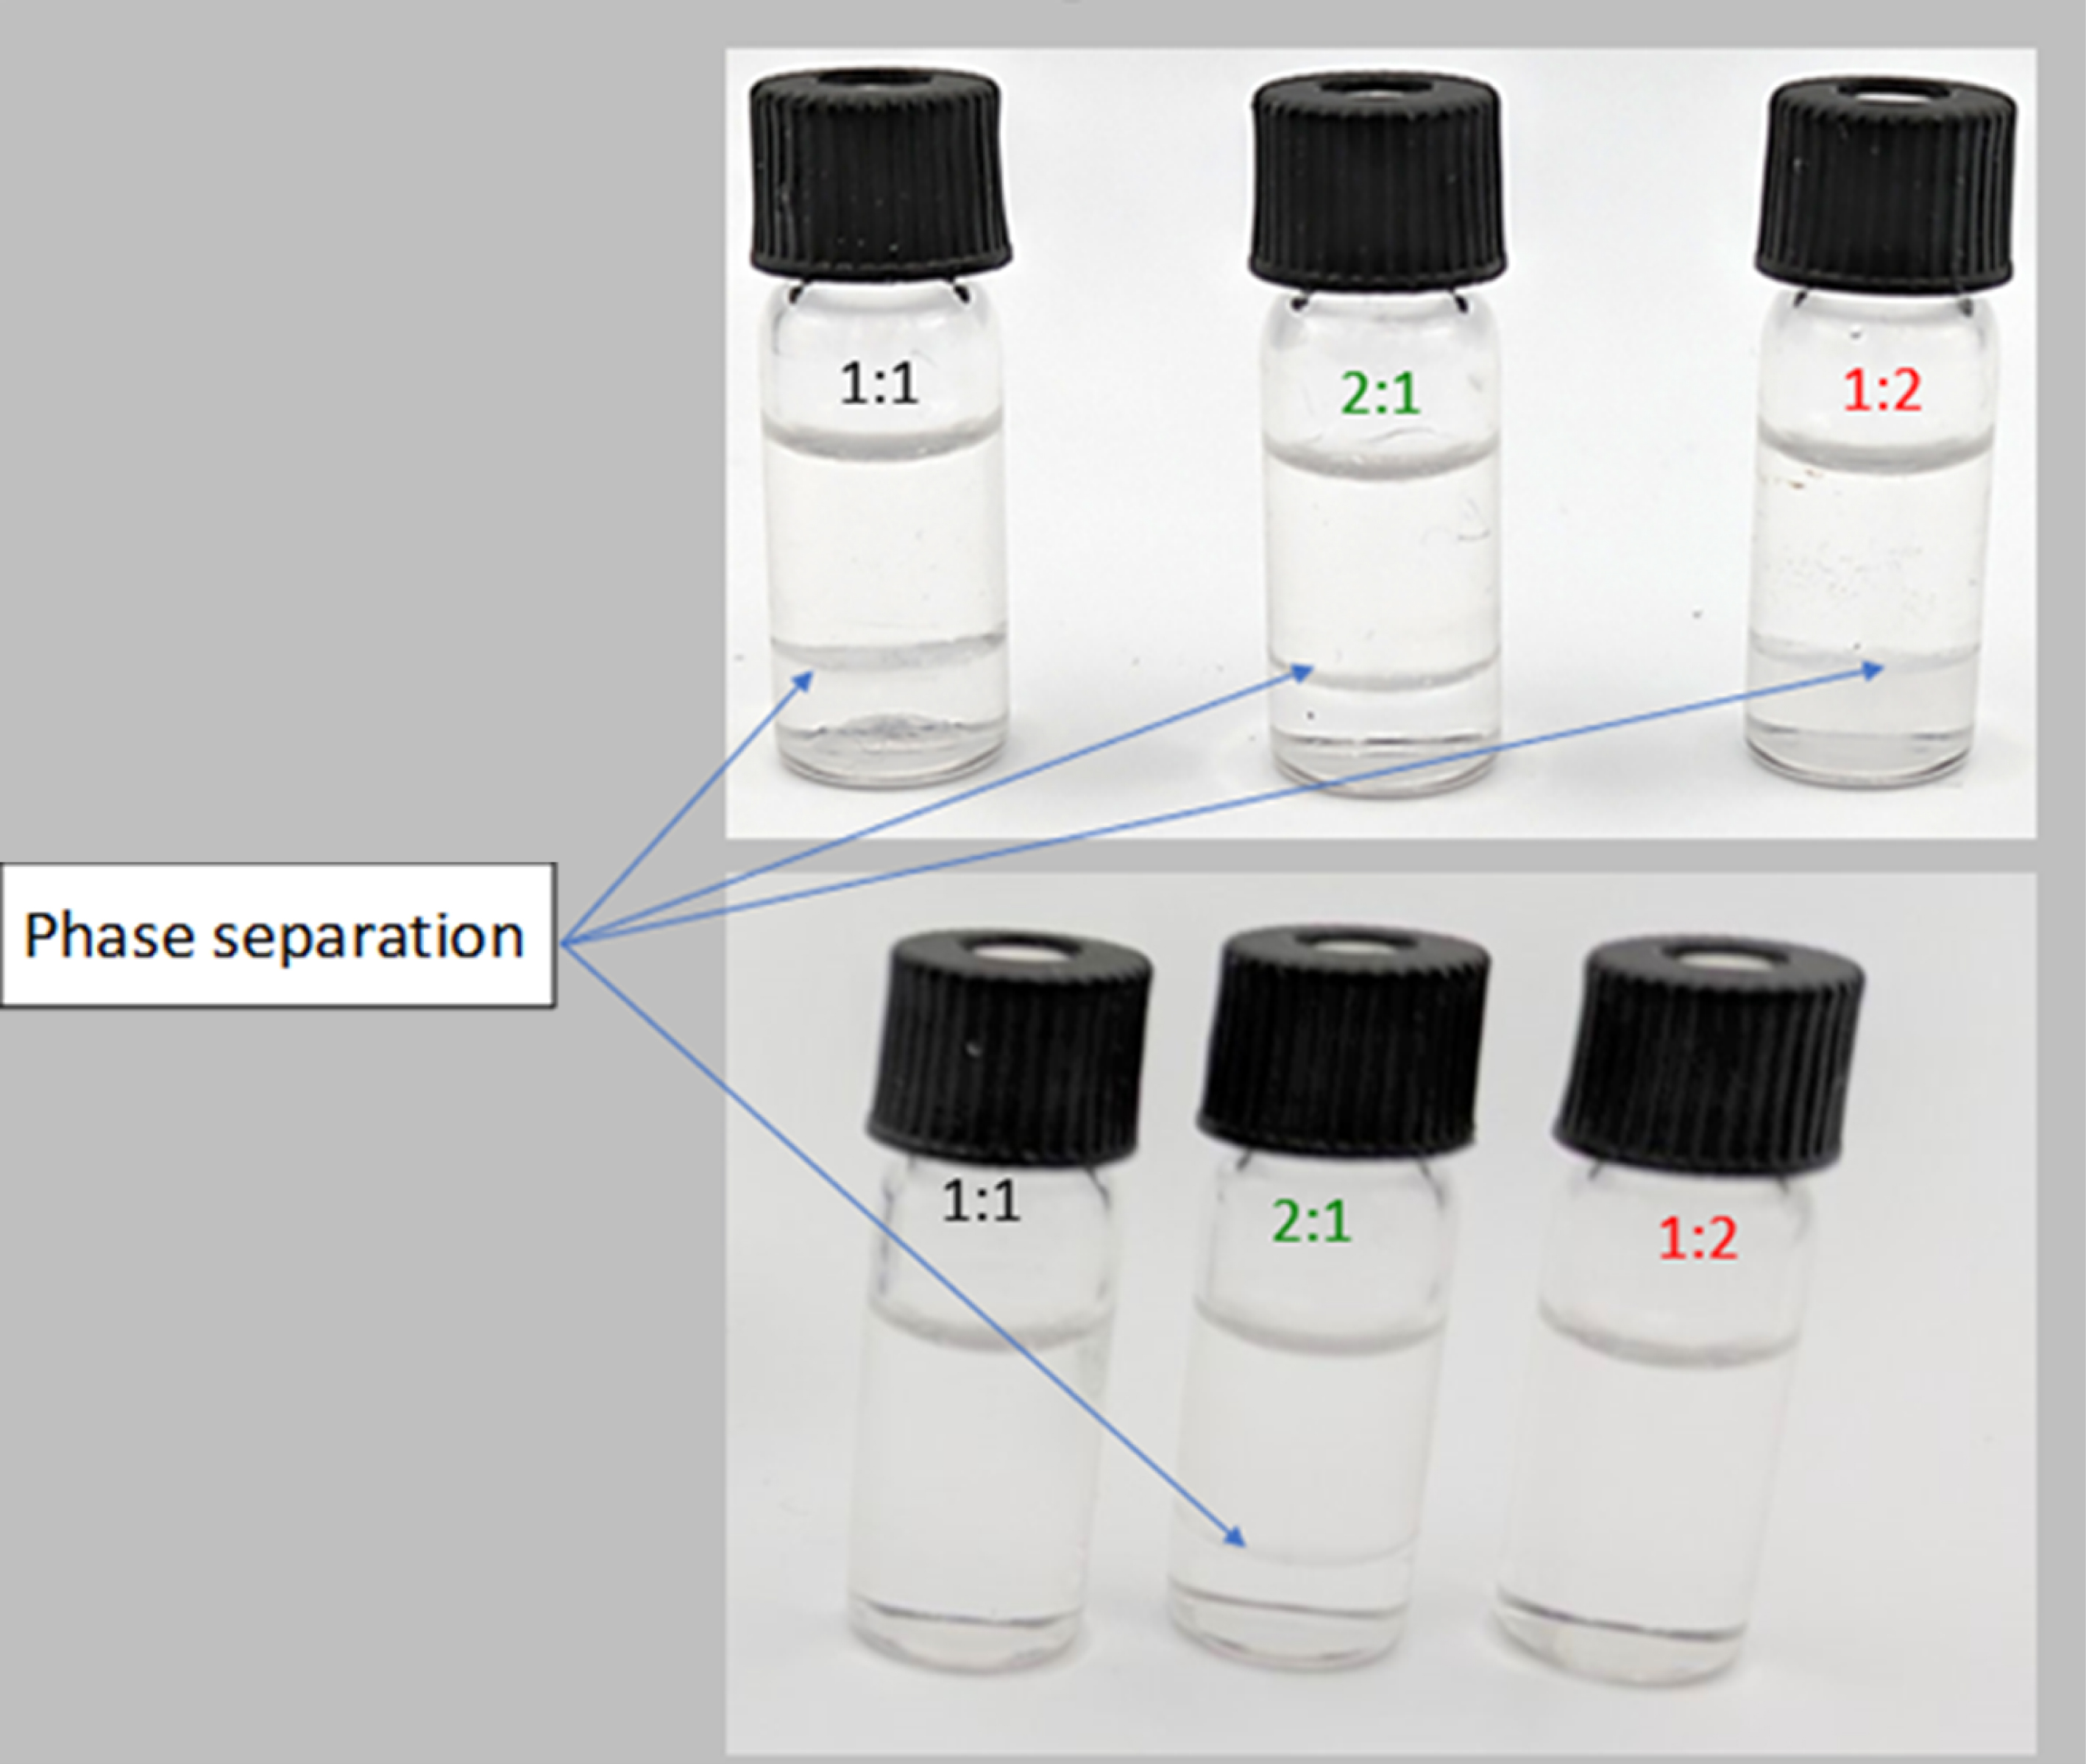
4. Conclusion
In the quest for new solvents with designed properties, hydrophobic DESs are promising candidates for meeting important needs for the extraction of compounds that are poorly soluble in water or for electrochemical applications. The present experimental study highlights the specific interest in DESs based on decanoic acid and tetrabutylammonium chloride.
Combining experimental approaches, we demonstrate the low polarity of this solvent, which has suitable viscosity, good conductivity, and electrochemical property. Moreover, comparing three different compositions (n:m) 2:1, 1:1, and 1:2, we reveal the central impact of stoichiometry on these properties. This regards thermal stability, which is virtually unlimited for n ⩽ m due to the suppression of crystallization. Furthermore, an acceleration by two orders of magnitude of molecular dynamics, as evaluated from dipolar relaxation and glass transition, is achieved by increasing the DA content. This also results in different ionic conductivities and electrochemical activities. Finally, the different long-time evolutions of DESs after water addition also indicate, at least at a qualitative level, that stoichiometry deeply influences the resistance of the DES structure to hydration. Overall, these findings support the interest in DA–TBACl as a solvent with real potential to fine-tune its properties by varying stoichiometry in order to adapt it to specific application requirements.
Declaration of interests
The authors do not work for, advise, own shares in, or receive funds from any organization that could benefit from this article, and have declared no affiliations other than their research organizations.
Acknowledgments
Support from Rennes Metropole and European Union (ERDF—CPER PRINT2TAN) is acknowledged. The authors are grateful to the CNRS—Network SolvATE (GDR 2035) for financial support and fruitful discussions.