





 CC-BY 4.0
1. Introduction
Industrial discharges undeniably contribute to water pollution, posing significant threats to both environmental and human health [1]. As industrialization accelerates, huge amounts of wastewater are produced worldwide, requiring the establishment and application of effective purification methods. In numerous countries, inadequately treated wastewater is released into rivers and lakes, or seeps into aquifers, compromising the quality of freshwater resources [2]. Currently, approximately 80% of the wastewater generated is not adequately treated and is discharged into the environment, leading to harmful impacts on ecosystems [3]. Discharging organic pollutants into aquatic environments has raised serious concerns due to their potential to cause harmful biological effects on ecosystems [4, 5]. For instance, the occurrence of synthetic dye residues in wastewater poses a substantial problem, as they can harm ecosystems and adversely affect human health and well-being [6, 7].
Dyes are widely employed in different industrial fields, such as the textile industry [8, 9], paper production [10], food technology [11], photochemical cells [12], and hair coloring [13, 14]. Approximately, 15% of the dyes used are released into rivers and other aquatic environments. According to the World Bank, the textile and dyeing industries contribute to 17–20% of global water pollution [15]. Malachite green (MG) represents one of the most largely used dyes in the textile industry [16]. It is a water-soluble cationic dye, appearing as a green crystalline powder, and belongs to the triphenylmethane class of dyes [17]. This dye has to be removed from wastewater due to its confirmed negative impacts on both human health and the environment [18].
Different methods have been tested for the removal of dyes in general and MG in particular from aqueous solutions, such as solvent extraction, flocculation, chemical oxidation, coagulation, microbial fuel cells, and catalysis [19, 20]. Over the past few years, adsorption has become one of the most widely used and efficient techniques, owing to its high efficiency, minimal waste generation, low operational and maintenance costs, simple design, and adsorbent regeneration and reusability [21]. Numerous adsorbents have been tested for the removal of MG from aqueous systems, including nanosilica clay, bioactivated carbon, modified diatomite, and zeolites [22, 23, 24, 25].
Zeolites are three-dimensional, tetrahedral hydrated aluminosilicate minerals with mesoporous and microporous structures. They naturally occur as minerals (such as chabazite, mordenite, and garronite), and are formed through chemical interactions between volcanic glass and saline water [26]. In addition to natural types, synthetic zeolites such as A, X, P, and Y can be produced from inexpensive, naturally abundant materials rich in aluminum and silicon under strongly alkaline conditions (typically pH ∼ 12–14) [27]. Owing to their porous architecture and significant ion-exchange capacity, zeolites have found extensive applications in environmental remediation, industrial catalysis, agriculture, and biomedical fields [28]. They are also used as feed additives in animal husbandry [29], catalysts in separation and refinery industries [30], and as efficient adsorbents for wastewater treatment [31], particularly for dye removal [32]. Among synthetic zeolites, Z-X that is produced under controlled laboratory or industrial conditions offers high purity, well-defined crystallinity, and reproducible physicochemical properties that ensure consistent adsorption and ion-exchange performance [33]. These features make Z-X especially valuable for scientific investigations, process optimization, and commercial applications, including its use in chemical sensors, environmental monitoring, and medical diagnosis [34].
Recent studies have demonstrated that Z-X, owing to its tunable properties and high efficiency, exhibits promising potential to be used as a novel sorbent for the elimination of diverse environmental pollutants. For example, Samanta et al. [35] synthesized sodium-rich zeolites A and X from ladle furnace slag via a fusion-assisted hydrothermal method, achieving high methylene blue removal efficiencies of more than 98% and 94%, respectively, following a Langmuir-type monolayer adsorption mechanism. Moreover, Sivalingam and Sen [36] synthesized Z-X from nanosized fly ash and highlighted its strong ability in removing crystal violet dye from aqueous solutions (greater than 250 mg⋅g−1). This same material was found to be highly effective in removing methylene blue [37]. However, most of the studies on zeolites used for dye-rich effluent treatment have the following drawbacks: (i) the lack of detailed characterization of this adsorbent material, (ii) the imprecise assessment of dye adsorption characteristics and the mechanisms involved in the overall removal process, and (iii) the cost of Z-X synthesis and application for dye removal.
Therefore, the novelty of this work lies in various combined simultaneous points: (i) in-depth characterization of the synthesized adsorbent (Z-X) by using complementary analytical devices, (ii) the detailed study of MG removal and desorption by Z-X under wide experimental conditions (contact time, solution pH, initial dye concentration, sorbent dose, and temperature), (iii) the exploration of the involved mechanisms and properties of the adsorption process through specific analyses of the material before and after MG removal, and (iv) the economic cost of the production and application of Z-X for the treatment of a MG-rich effluent.
2. Experimental procedures
2.1. Chemical reagents
The chemicals used are aluminum chloride (AlCl3; Carlo Erba), sodium metasilicate (Na2SiO3 [63% SiO2, 19% H2O, 18% Na2O]; Merck product), sodium hydroxide (NaOH; Sigma-Aldrich, USA), and MG (C23H25N2Cl, 96% purity; Fluka, Germany). The solvent used in the whole experiment is deionized water generated from a controlled water deionizer (Tradesworth Group, Bangladesh).
2.2. Z-X synthesis procedure
The preparation of Z-X is carried out following the procedure recognized by the International Zeolite Association (IZA) [38] with minor adjustments. The first solution (A) is prepared using 2.75 g of AlCl3 dissolved in 25 mL of 0.025 M NaOH. The second solution (B) is prepared by dissolving 13 g of Na2SiO3 in 25 mL of 0.025 M NaOH. Afterwards, the two solutions (A and B) are mixed based on the molar composition of the starting gel: 3.5 Na2O:1 Al2O3:2.9 SiO2:150 H2O under continuous agitation for 40 min by a magnetic agitator (DLAB, China). Then, the resulting mixture is transferred into a polypropylene bottle and heated at 90 °C for 24 h. Afterwards, the resulting product is filtered with Whatman filter paper and washed several times with deionized water until the pH of the washing solution becomes less than 9. The collected product is dried in an oven at 100 °C and then stored in a glass bottle for characterization and application for MG adsorption. The resulting material is labeled in this study as Z-X.
2.3. Characterization of Z-X
The morphological characteristics and chemical composition of Z-X were analyzed using a field emission scanning electron microscope (SEM) JEOL JSM-6060LV coupled with EDS analysis (JEOL, USA). The crystalline phases in Z-X were examined by X-ray powder diffraction (XRD) with a Benchtop Proto AXRD instrument (Proto Manufacturing Inc., USA). The XRD data were collected for a 2𝜃 range between 5° and 70° using a step size of 0.02°⋅s−1. The surface area of the material was evaluated using the Brunauer–Emmett–Teller (BET) method based on nitrogen adsorption–desorption isotherms with a Quadrasorb SI-KR/MP analyzer (Quantachrome Instruments, Boynton Beach, USA) at a liquid nitrogen temperature of 77 K. The Fourier-transform infrared (FTIR) spectra were obtained using a CARY 600 instrument (Agilent Technologies, Inc. USA) in the wavenumber range of 400–4000 cm−1 with a resolution of 2 cm−1. The pH at the point of zero charge (pHpzc) was determined through the pH drift method for initial pH (pHi) values of 2, 4, 6, 8, 10, and 12. The pHpzc value of Z-X corresponds to the intersection point between the bisector line and the curve, giving the variation of the final pH (pHf) versus the initial pH (pHi).
2.4. Adsorption study
The MG-adsorption efficiency by Z-X was evaluated through batch experiments. These assays were carried out in 100 mL Erlenmeyer flasks, each containing a fixed mass of adsorbent and 25 mL of MG solution at a given initial concentration and temperature, and then agitated for a required contact time. Unless specified, the following default adsorption parameters were used: a contact time of 60 min, a pH of 6, a MG initial concentration of 10 mg⋅L−1, an adsorbent dose of 0.4 g⋅L−1, and an ambient room temperature (20 °C). Throughout this work, we evaluate the effect of (i) contact time for values varying between 5 and 300 min, (ii) the initial pH values between 3 and 10, (iii) the initial MG concentration for a variation range of 10–100 mg⋅L−1, (iv) the adsorbent dose for values from 0.4 to 2 g⋅L−1, and (v) temperature (between 10 °C and 30 °C) on MG removal efficiency from synthetic aqueous solutions. Following each adsorption test, the suspensions were centrifuged by a Sigma 2–7 centrifuge (Sigma, Germany) and the residual MG concentration was measured using a UV–visible spectrophotometer V-630 (JASCO, France) at a wavelength of 622 nm.
At a given time t, the MG-adsorbed amount Qt (mg⋅g−1) is estimated using the following equation:
| \begin {equation}\label {eq1} Q_t= \frac {V}{m} (C_0-C_t) \end {equation} | (1) |
The kinetic experimental data are examined by the pseudo-first-order (PFO), pseudo-second-order (PSO), intraparticle diffusion (IPD), and Elovich models. Likewise, the isotherm experimental data are fitted with Langmuir, Freundlich, and Temkin models. The equations corresponding to these models are provided in the supplementary material (Table S1). For both cases, the goodness of fit between the experimental and calculated values is deduced from the related correlation coefficients and the mean absolute percentage error (MAPE):
| \begin {equation}\label {eq2} \mathrm {MAPE}(\%)= \frac {100}{n}\sum _{i=1}^{n} \frac {|Q_{\mathrm {exp}}-Q_{\mathrm {calc}}|}{Q_{\mathrm {exp}}} \end {equation} | (2) |
The effect of temperature on MG uptake by Z-X was assessed for aqueous solution temperatures of 10 °C, 20 °C, and 30 °C. Then the related thermodynamic parameters—free energy (ΔG [kj⋅mol−1]), enthalpy (ΔH [kJ⋅mol−1]), and entropy (ΔS [j⋅mol−1⋅K−1])—of the MG adsorption onto Z-X were deduced from the following equations:
| \begin {eqnarray} \Delta G\text {\textdegree } &=& \Delta H\text {\textdegree }-T\Delta S\text {\textdegree } \label {eq3}\end {eqnarray} | (3) |
| \begin {eqnarray} \Delta G\text {\textdegree } &=& -R\times T\times \mathrm {Ln}(K_{\mathrm {d}}) \label {eq4}\end {eqnarray} | (4) |
| \begin {eqnarray} \mathrm {Ln}(K_{\mathrm {d}}) &=& \frac {-\Delta H\text {\textdegree }}{R}\times \frac {1}{T}+ \frac {\Delta S\text {\textdegree }}{R} \label {eq5} \end {eqnarray} | (5) |
| \begin {equation}\label {eq6} K_{\mathrm {d}}= \frac {Q_{\mathrm {e}}}{C_{\mathrm {e}}}\times \frac {V}{m} \end {equation} | (6) |
2.5. Regeneration study
The MG desorption experiments were conducted by using the experimental protocol from previous works [40]. Briefly, 0.1 g of MG-loaded sorbent was agitated in 100 mL of distilled water at 100 °C and under reflux for 6 h. Then the solid matrix was dried at 105 °C for 12 h and used for the second adsorption cycle. During the new adsorption cycle, this dried mass was shaken in a concentration of MG solution at 100 mg⋅L−1 for 180 min. This procedure was repeated for four adsorption/desorption cycles. At a given cycle i, the desorbed amount per unit of modified adsorbent (Qdes,i [mg⋅g−1]) and the desorption yield (Ydes,i) are calculated as follows:
| \begin {eqnarray} Q_{\mathrm {des},i} &=& \frac {V_{\mathrm {des}}}{m_{\mathrm {des}}} C_{\mathrm {des},i} \label {eq7}\end {eqnarray} | (7) |
| \begin {eqnarray} Y_{\mathrm {des},i} &=& \frac {Q_{\mathrm {des},i}}{Q_{\mathrm {e}}} \times 100 \label {eq8} \end {eqnarray} | (8) |
All batch experiments were conducted in triplicate, and the reported values represent the mean of three independent measurements.
3. Results and discussion
3.1. Adsorbent characterization
3.1.1. Textural and structural analysis
The SEM was employed to analyze the Z-X morphology. The results (Figure 1) show that Z-X has a polyhedral structure with smooth crystalline surfaces. Furthermore, the crystallites form and develop with varying particle sizes. The EDS analysis (Table 1) shows that Z-X is mainly composed of O, Al, Na, and Si, which is consistent with those reported for coal fly ash–derived microporous Z-X [41]. Moreover, the XRD spectrum of the synthesized zeolite indicates the presence of various characteristic diffraction peaks (111, 220, 311, 331, 442, 533, 642, 751, and 840) with high relative diffraction intensities at 2𝜃 values of 6.23°, 10.1°, 11.8°, 15.6°, 20.8°, 23.0°, 26.8°, 31.1°, and 33.5°, respectively (Figure 2). Comparable data were reported by Deng et al. [42] and Sivalingam et al. [43] during the synthesis of Z-X from waste basalt powder and fly ash, respectively. Compared to the JCPDS standard data (No. 38-0237), the sample exhibits sharp and well-defined diffraction peaks with no detectable impurities. These results indicate that the Z-X sample does not exhibit secondary crystalline phases, suggesting high structural purity. The broad diffraction features observed at around 23.1° and 26.8° are indicative of low crystallinity or partial structural disorder, which may contribute to the development of accessible pore structures rather than a strictly microporous framework.
SEM image of the Z-X material.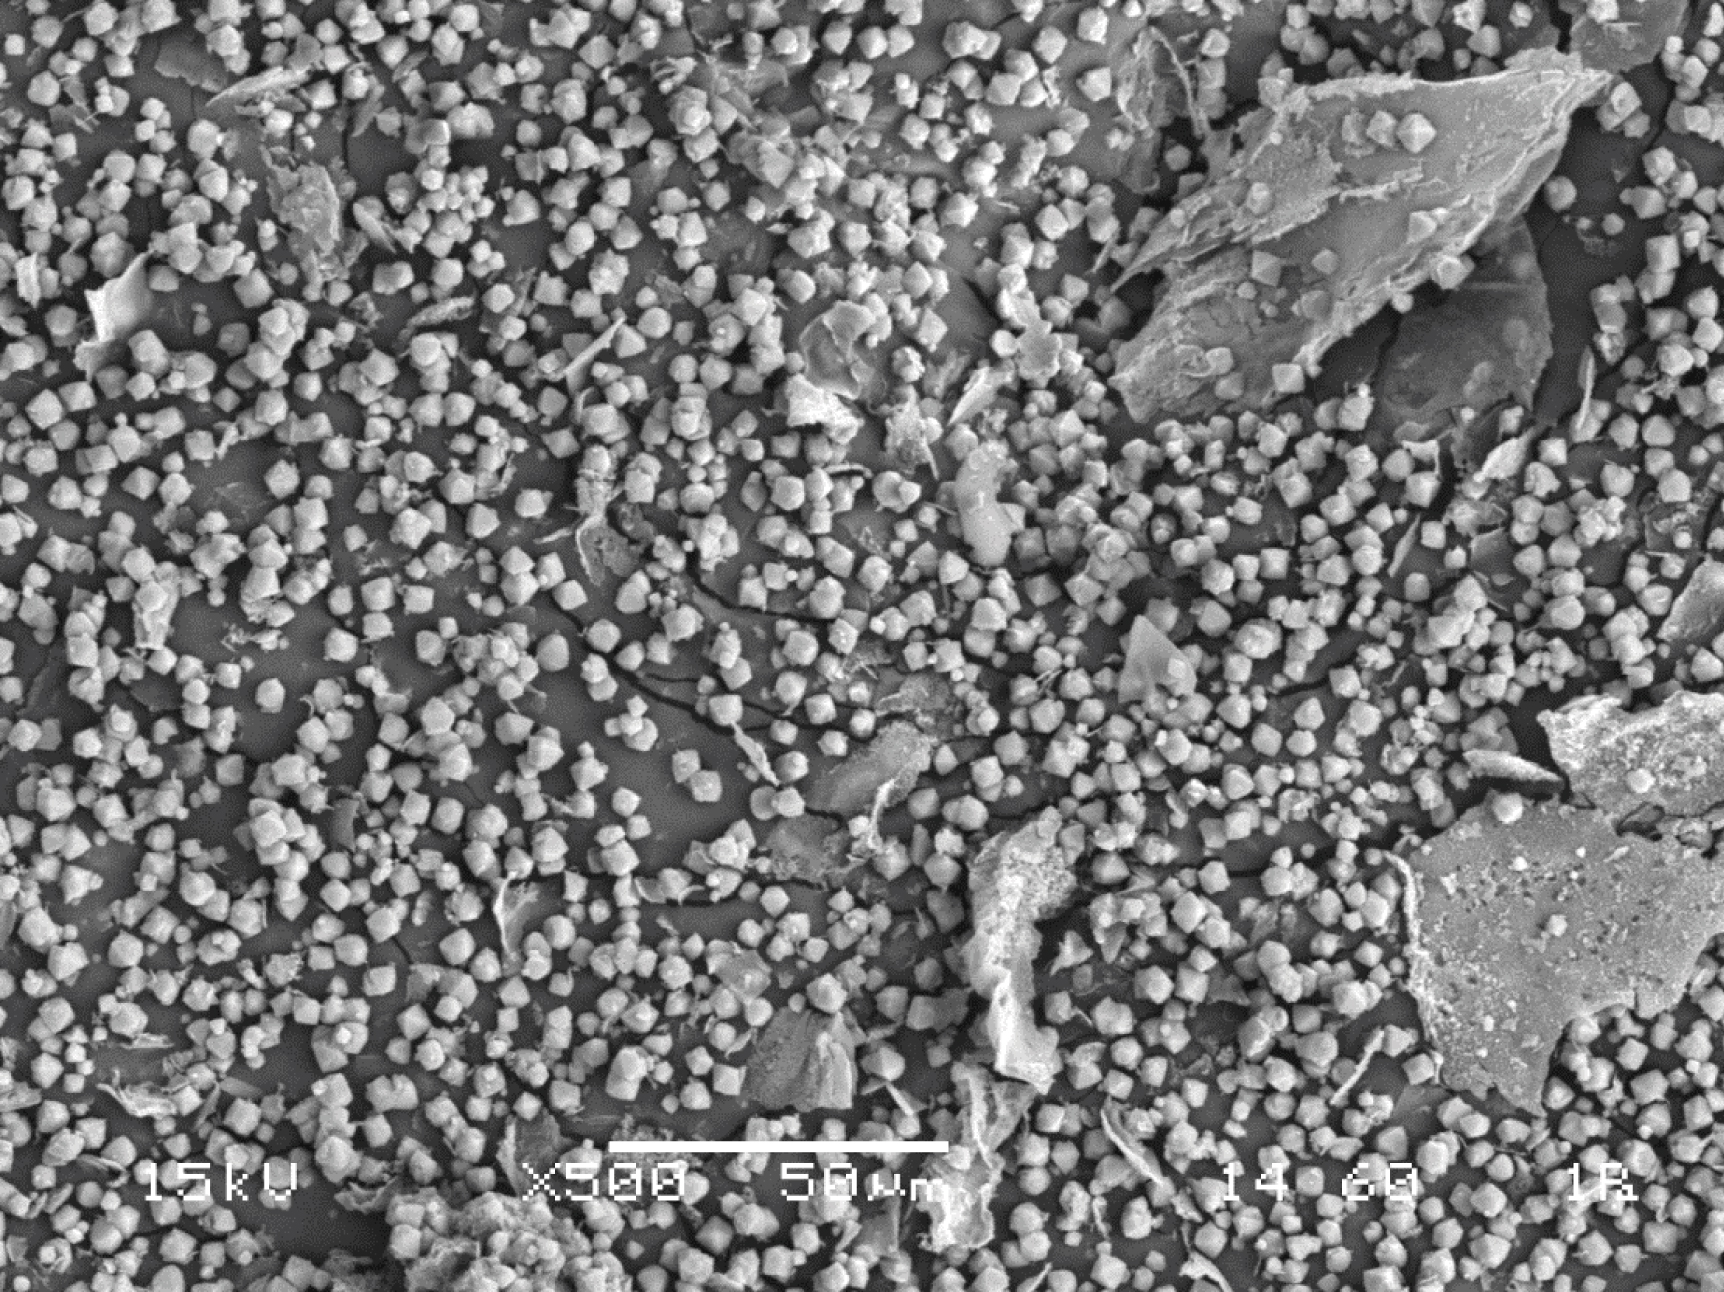
XRD diffractogram of the Z-X material.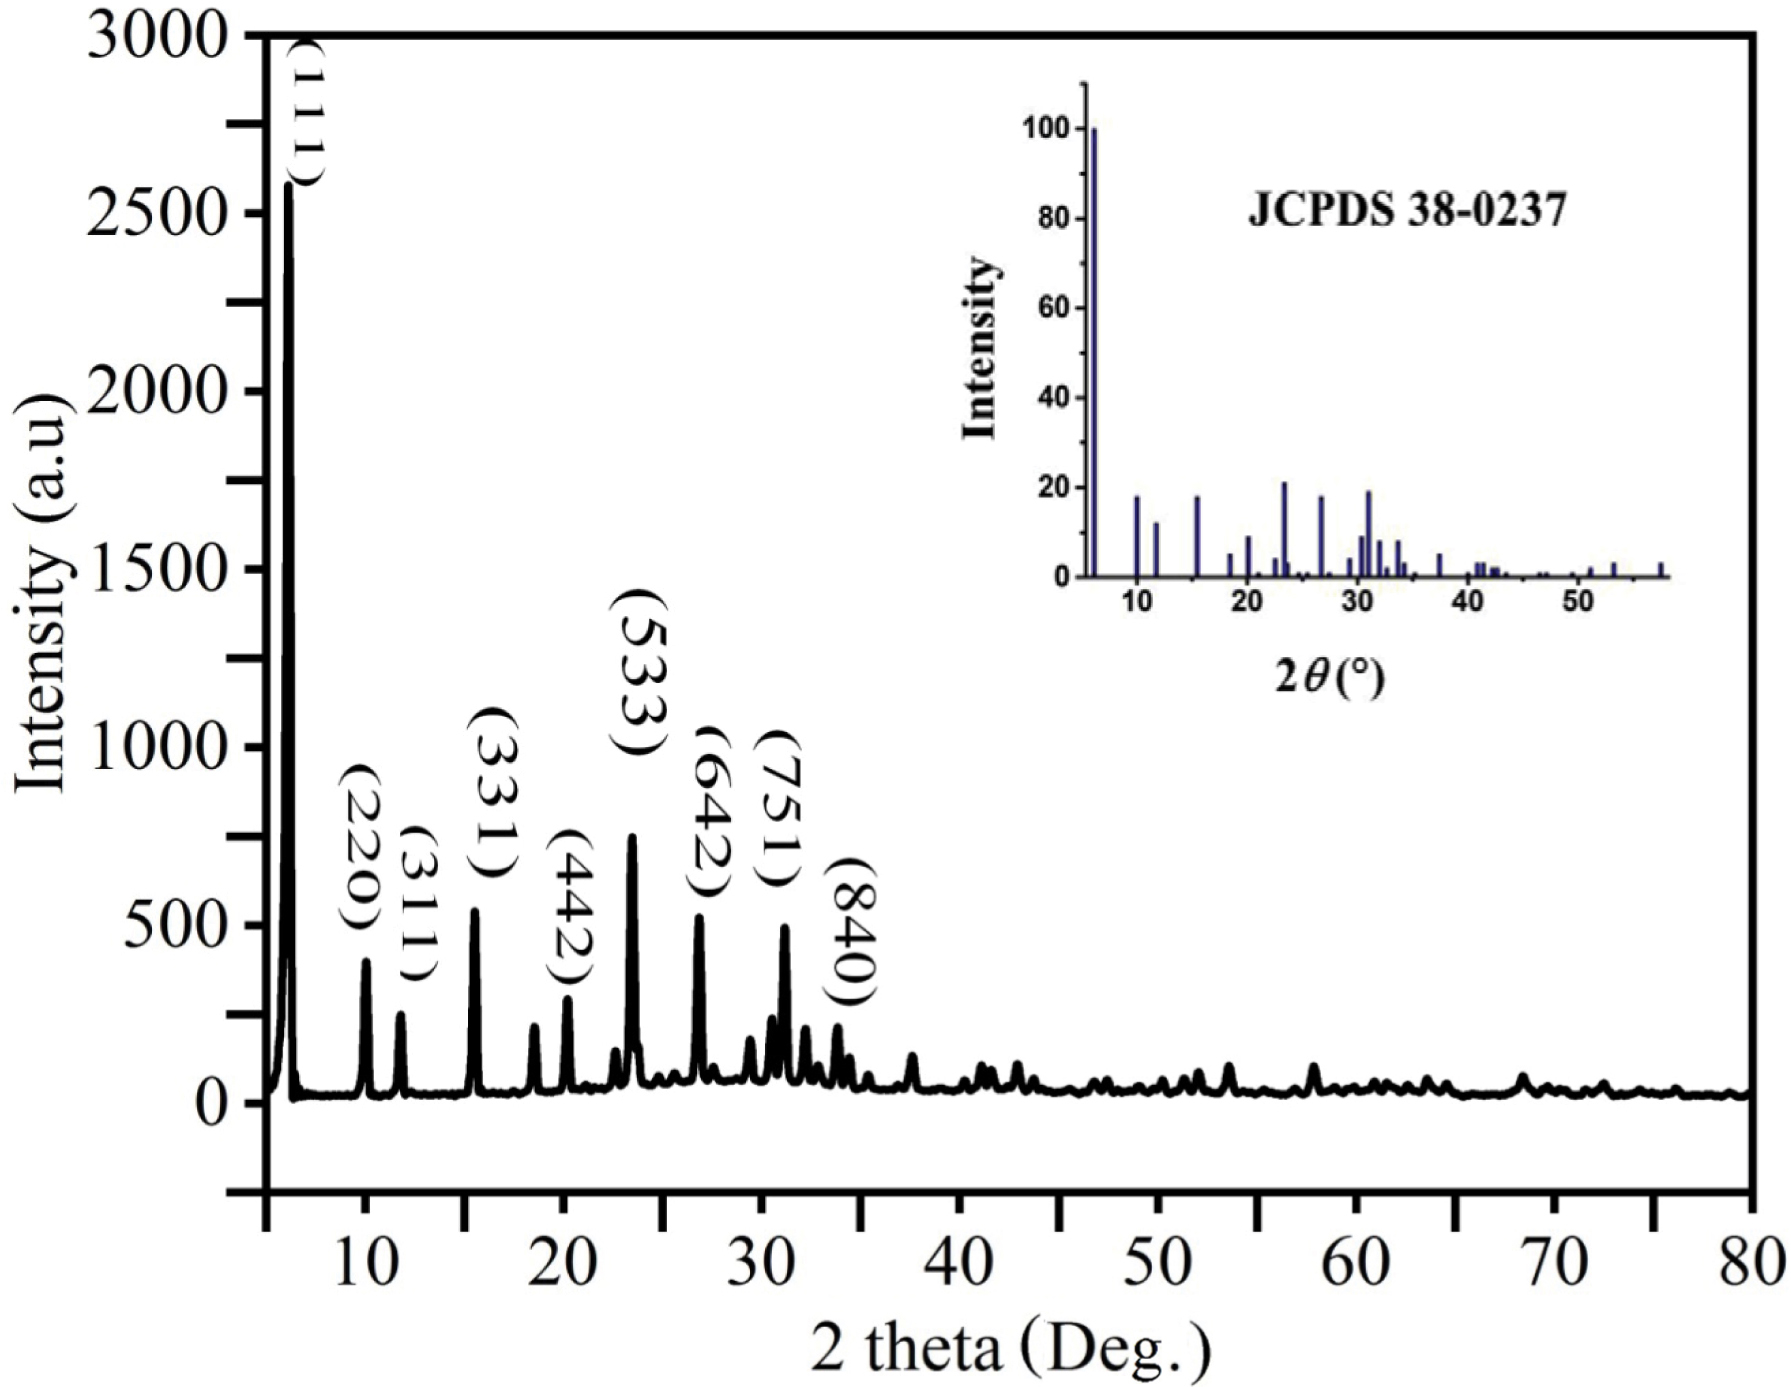
EDS analysis results of Z-X
| Element | Content (%) |
|---|---|
| C | 3.047 |
| O | 47.539 |
| Na | 10.170 |
| Al | 13.451 |
| Si | 25.416 |
| Fe | 0.377 |
| Total | 100.00 |
Given the relatively large molecular size of MG (1–5 nm), mesoporous domains are expected to play a crucial role in facilitating molecular diffusion and adsorption. In this regard, the relatively high BET specific surface area (313.8 m2⋅g−1), together with the SEM observations, supports the presence of a well-developed porous network that is favorable for dye adsorption.
3.1.2. Surface chemistry analysis
The FTIR spectrum of the prepared Z-X (Figure 3) shows an intense peak at 950 cm−1 and a broad peak at 447 cm−1, both ascribed to asymmetric Si–O–Si stretching, which confirms that the zeolite is a quartz-rich material [44]. Moreover, the narrow bands at 693 cm−1 and 666 cm−1 correspond to the symmetric and asymmetric stretching of Si–O–Si and Si–O–Al, respectively [45]. The peak at 495 cm−1 is associated with the bending modes of these tetrahedral groups [46]. Other narrow bands are detected between 447 and 487 cm−1 and may be attributed to Si–O and Al–O bending modes [47]. In addition, the band at 1621 cm−1 is related to the bending vibration peak of hydrated water molecules in zeolite cavities [48]. Finally, the broad peak at 3466 cm−1 is attributed to the stretching vibrations of O–H groups originating from adsorbed water molecules and/or hydroxyl groups within the zeolite framework [49]. This finding confirms the generation of a well-formed aluminosilicate framework with the clear presence of hydroxyl groups, which provide active sites that could facilitate interactions with cationic dye molecules during the adsorption process.
FTIR spectrum of synthesized Z-X.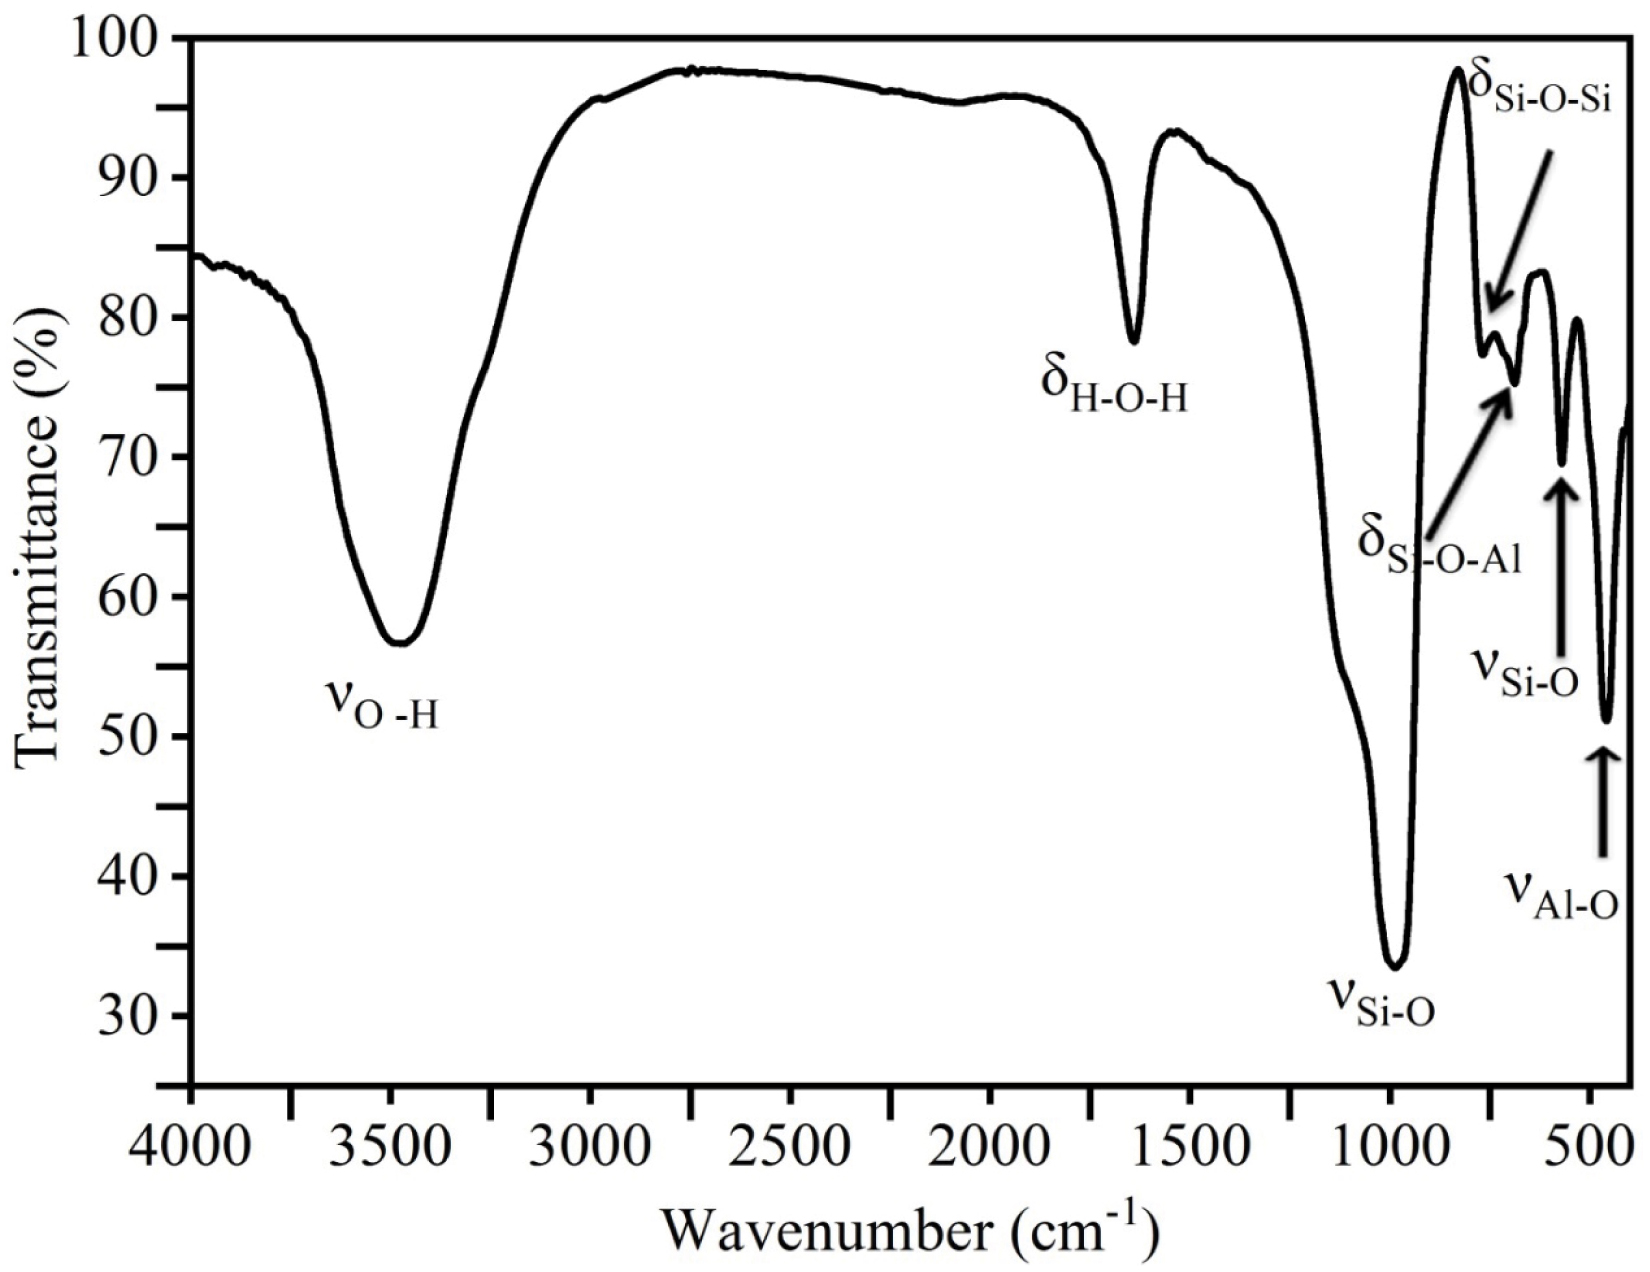
3.2. MG-adsorption study
3.2.1. Effect of contact time: kinetic study
The contact time influence on MG adsorption using Z-X was examined under the experimental conditions outlined in Section 2.3. Experimental results (Figure 4) show rapid adsorption kinetics, attaining a saturation level after 60 min. The sharp increase in Qt up to 60 min can be associated with the high number of vacant surface sorption sites at the beginning of the adsorption assay. With time, electrostatic repulsion between the cationic dye molecules already adsorbed on the zeolite surface and those in solution hinders access to the remaining active sites, leading to a gradual decrease in adsorption until equilibrium is reached. An equilibrium time of 60 min was also observed for MG adsorption using apricot stones [50], Lupinus albus seed peel waste [51], zeolite/iron oxide nanocomposite [52], and natural red clay [53]. This short contact time represents an important asset in real applications since it significantly reduces energetic expenses (i.e., agitation). Higher contact times were reported for MG removal by Na-X (120 min) [54] and Z-X (720 min) [42]. The shorter equilibrium time observed in this study may be attributed to the better accessibility of MG to Z-X active sites, which results in an enhanced mass transfer from the aqueous to the solid phase.
Influence of contact time on the adsorption of MG onto the synthesized Z-X (initial concentration: 10 mg⋅L−1, adsorbent dose: 0.4 g⋅L−1, ambient temperature, pH: 6.06).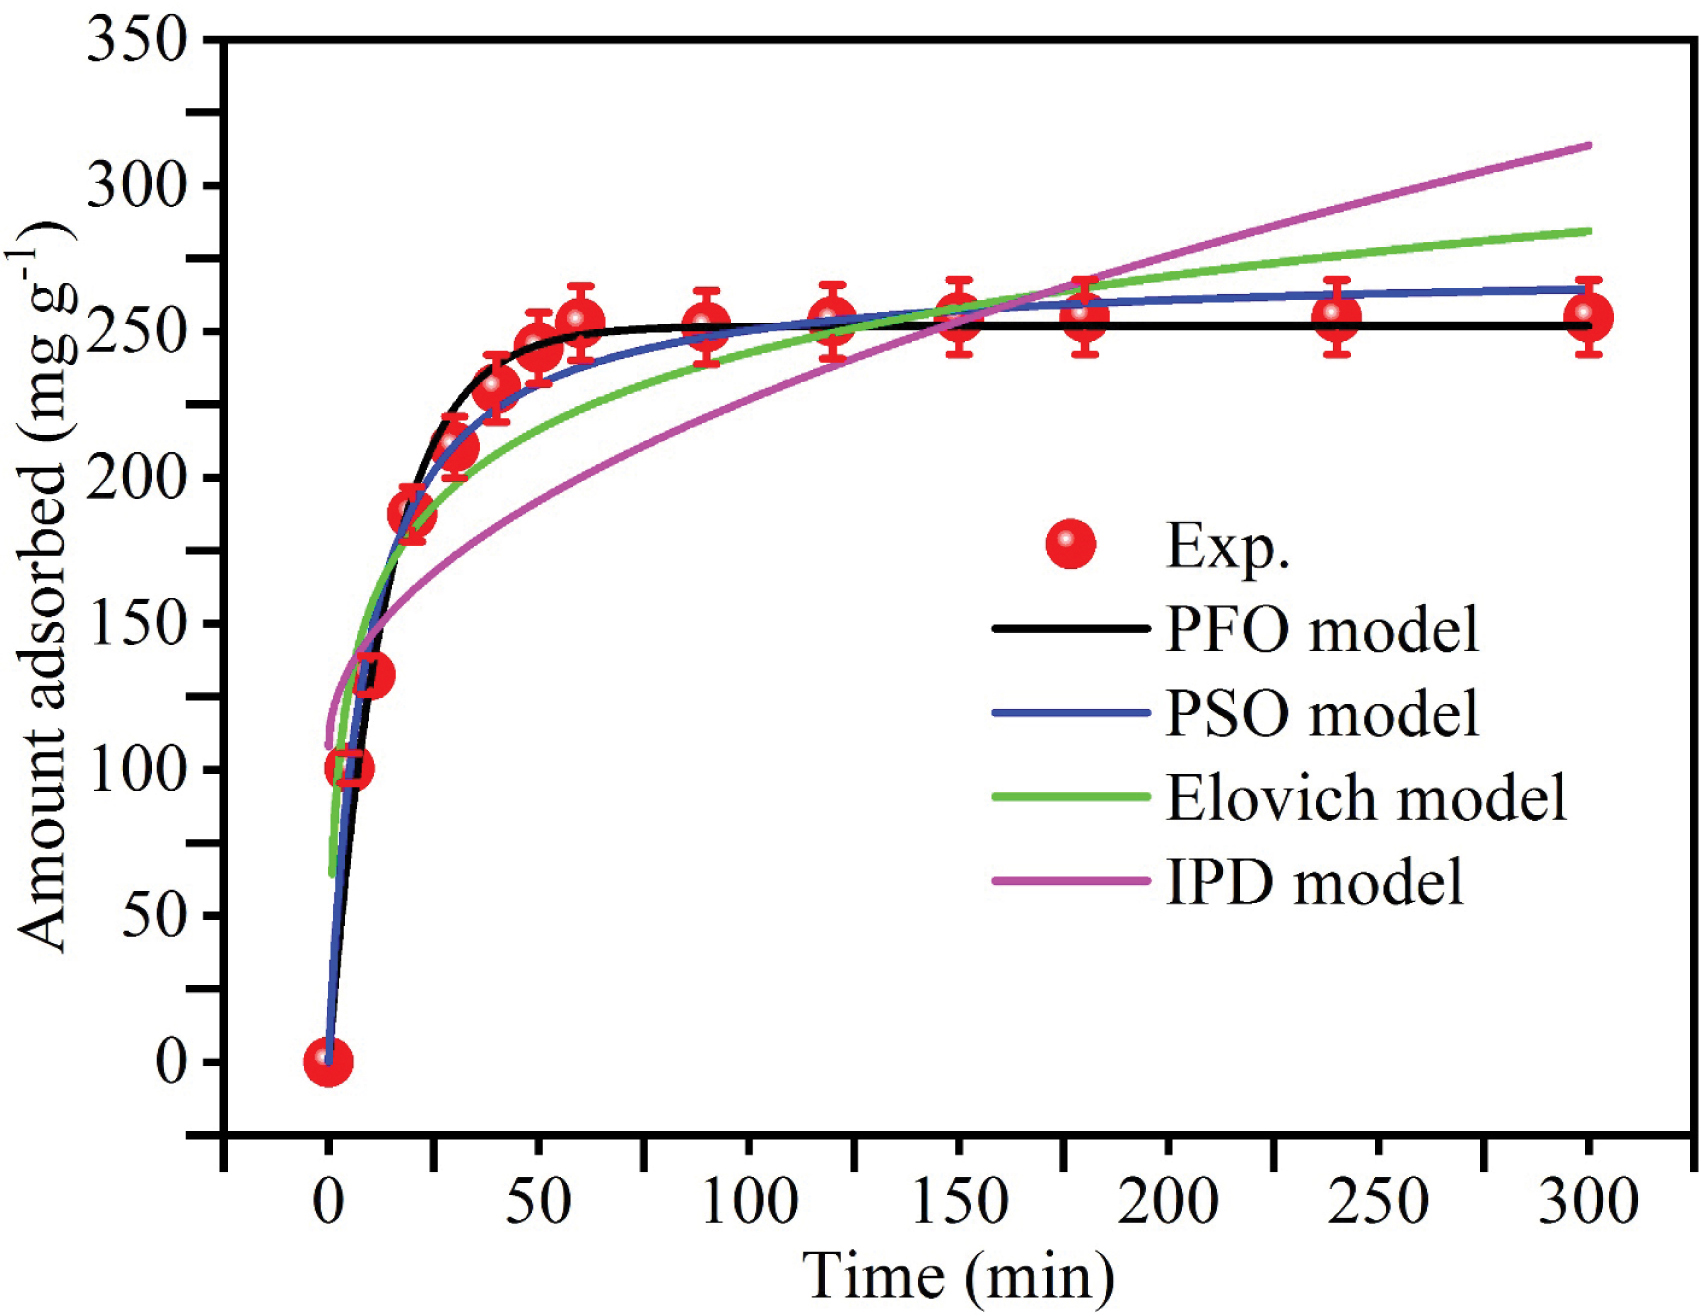
It is worth mentioning that the MG adsorption on Z-X occurs in three stages [55]: (i) a rapid adsorption (between 5 and 30 min) due to the availability of free surface sites, leading to a linear increase in adsorption capacity, (ii) a slower adsorption rate (between 30 and 60 min) as MG concentration and available sites decrease, and (iii) stabilization of adsorption capacity as saturation is reached (after 60 min).
The adsorption kinetic experimental data were fitted with the PFO, PSO, Elovich, and IPD models. The results are shown in Figure 4 and Table 2. It is evident that the PSO, IPD, and Elovich models fail to describe the entire range of the adsorption data (Figure 4). The PSO model suitability is limited only to the initial time range as described by other studies [56]. The PFO model provides the best fit to the experimental data (Figure 4). This model exhibits the highest determination coefficient (R2) and the lowest MAPE values (Table 2). Furthermore, the corresponding calculated Qe (mg⋅g−1) is the closest to the experimental value (Qe,exp) (Table 2). This finding may be attributed to (i) fast initial adsorption followed by slower later-stage interactions and (ii) limited IPD. The time required to reach equilibrium and the k1 value are comparable to those reported by Imessaoudene et al. [47] when investigating methylene blue adsorption by a 4A zeolite.
Kinetic parameters for MG removal by the synthesized Z-X
| Model | Parameter | Value |
|---|---|---|
| Qe,exp | 254.84 ± 2.78 | |
| PFO | k1 (min−1) | 0.073 ± 0.0012 |
| Qe (mg⋅g−1) | 251.86 ± 1.85 | |
| R2 | 0.990 | |
| MAPE (%) | 3.47 | |
| PSO | k2 (g⋅mg−1⋅min−1) | (4.238 ± 0.32) × 10−4 |
| Qe (mg⋅g−1) | 272.03 ± 1.12 | |
| R2 | 0.989 | |
| MAPE (%) | 23.49 | |
| IPD | Kin (mg⋅g−1⋅min−1/2) | 11.868 ± 0.13 |
| C | 108.06 ± 0.68 | |
| R2 | 0.625 | |
| MAPE (%) | 15.36 | |
| Elovich | 𝛼 (mg⋅g−1⋅min−1) | 84.45 ± 0.85 |
| 𝛽 (g⋅mg−1) | 0.0264 ± 0.008 | |
| R2 | 0.931 | |
| MAPE (%) | 9.20 |
In contrast, the nonlinear fitting of the IPD model (Figure 4) reveals a multi-stage adsorption process characterized by two distinct regions. The first (steeper region) corresponds to the rapid external surface sorption while the second (gradual region) represents the slower intraparticle diffusion of MG molecules into the internal pores of Z-X. The obtained curve does not intersect with the origin, indicating that IPD participates in the overall adsorption process but is not the only rate-limiting step. The Elovich model, often applied to heterogeneous surfaces, further supports this interpretation, describing a decreasing adsorption rate over time due to surface site heterogeneity and variable dye–adsorbent affinities. Comparable conclusions have been reported by Nandi et al. [57] and Noroozi et al. [58] when investigating the adsorption of brilliant green and basic blue dyes by kaolin and silkworm pupa based adsorbents.
3.2.2. Effect of adsorbent dose
Figure 5 illustrates the influence of Z-X dose on the removal efficiency of MG by Z-X. The MG removal yield shows only a slight increase as the sorbent dose increases from 0.4 to 2 g⋅L−1. This limited variation suggests that most MG molecules are already removed at low doses, leading to a plateau behavior. Consequently, at fixed operating conditions, the adsorption yield increases with adsorbent dose owing to the availability of additional active surface sites. However, the improvement becomes negligible beyond a certain dose due to the low residual dye concentration in the aqueous phase. A pseudo-equilibrium state can be observed that most likely results from the saturation of available sorption sites [59]. Although the plateau is reached at around 1.2 g⋅L−1, a relatively high removal efficiency (around 85%) is obtained at 0.8 g⋅L−1. This suggests that the use of a low Z-X dose (0.8 g⋅L−1) may be more practical in real-case conditions as it ensures efficient MG removal while minimizing the excessive depletion of the Z-X material.
Effect of adsorbent dose on the MG removal yield (initial MG concentration: 10 mg⋅L−1, volume: 25 mL, ambient temperature, initial pH: 6.06).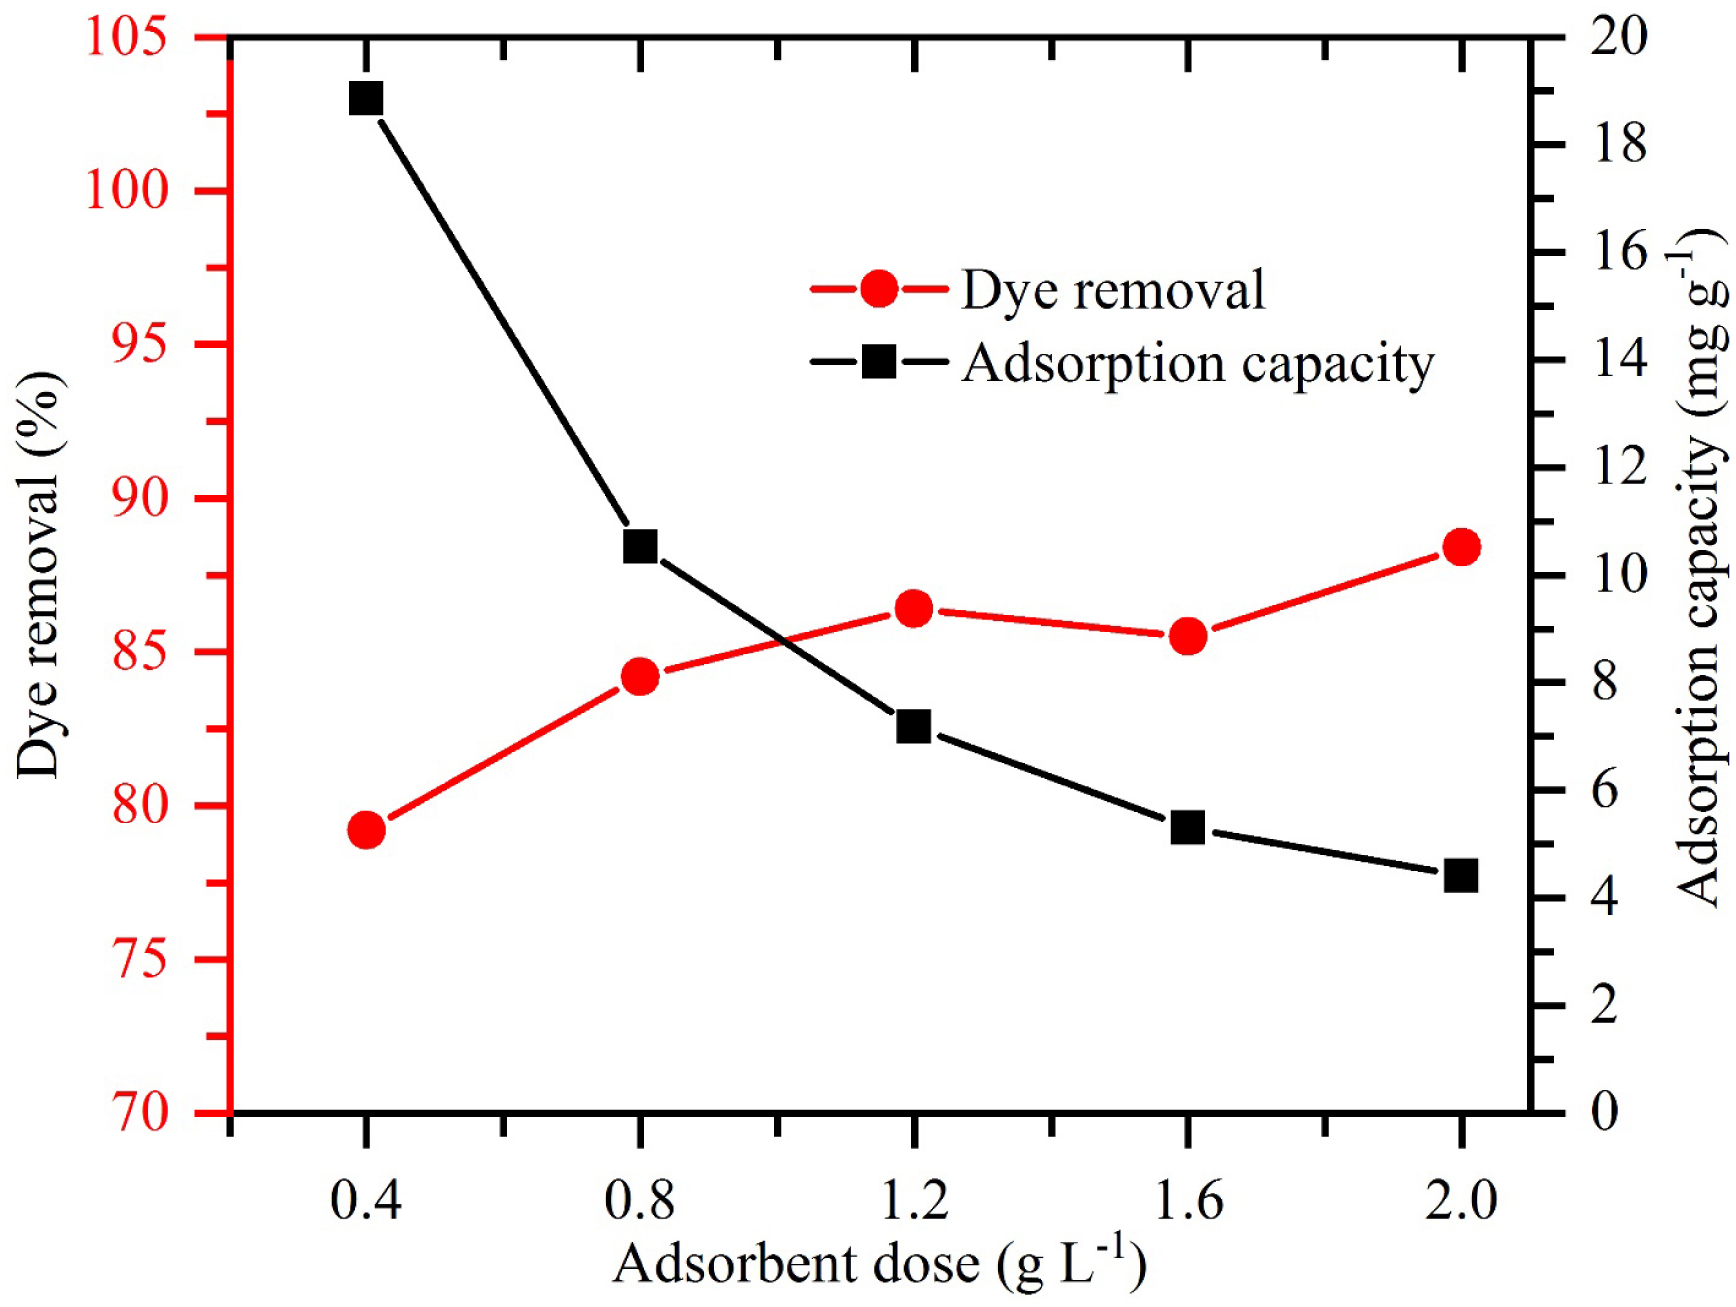
3.2.3. Effect of pH
The pH is a key factor influencing dye removal performance as it affects both the ionization state of dye molecules and the surface charge of the adsorbent. This may significantly control the strength and nature of electrostatic interactions involved in the adsorption process. The pH solution influence on the MG uptake by Z-X was examined under the experimental conditions outlined in Section 2.3. The results (Figure 6) indicate that the maximum removal capacity of 18.3 mg⋅g−1 is achieved at an initial pH of 10. Then the uptake yield progressively diminishes with decrease in initial pH value. The lowest value (less than 0.5 mg⋅g−1) is measured at an acidic pH of 3 (Figure 6).
Effect of solution pH on MG removal capacity by the synthesized zeolite (initial concentration: 10 mg⋅L−1, volume: 25 mL, time: 60 min, adsorbent dose 0.4 g⋅L−1).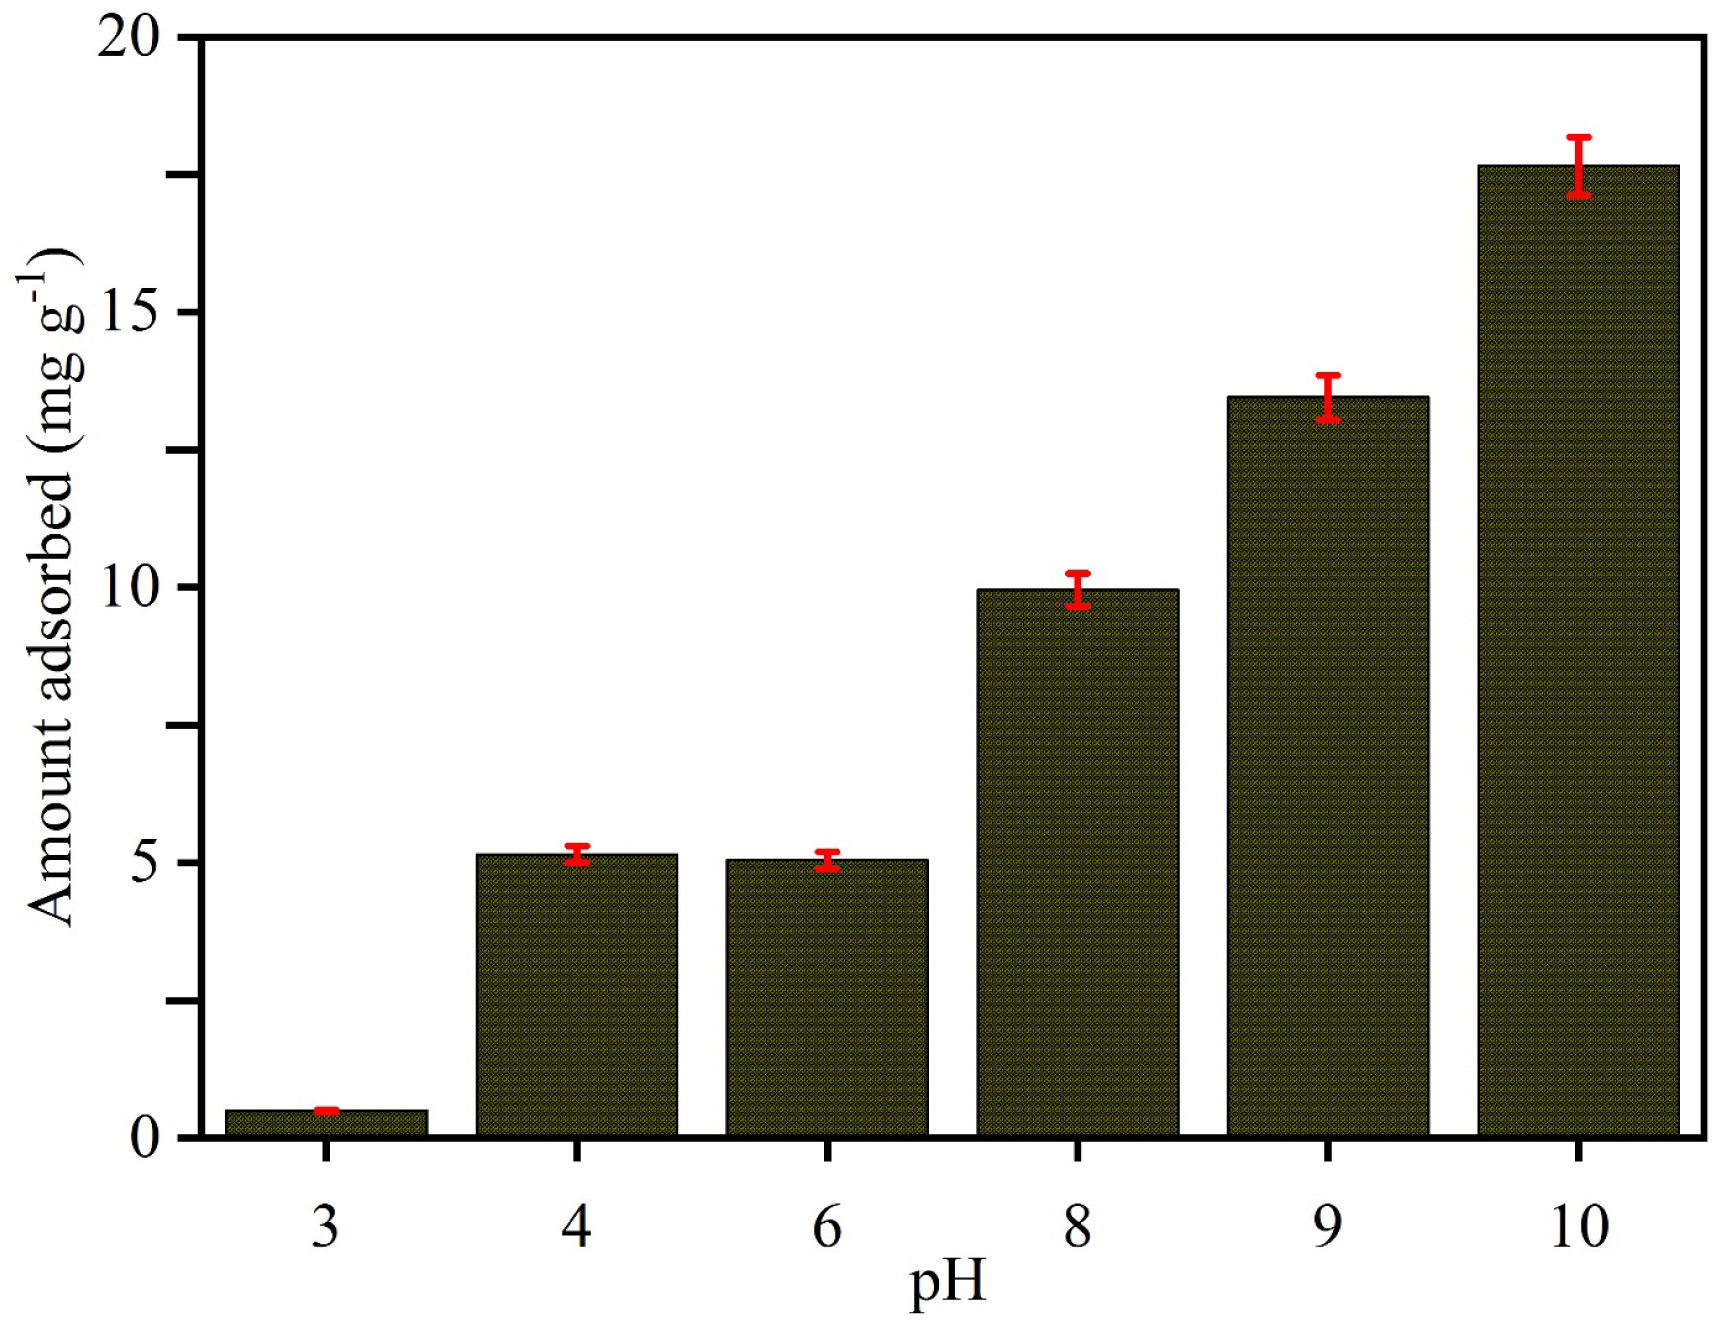
This behavior can be attributed to the dependence of the net surface charge of Z-X on the type and ionization state of its surface functional groups, which can carry either positive or negative charges depending on both the values of the solution pH and the pHpzc of the Z-X material. The Z-X has a pHpzc value of 6.0 (Figure S1), which is consistent with values reported for other natural zeolites [60]. For aqueous pH values higher than 6.0, the surface of Z-X is predominantly negatively charged, favoring the adsorption of the cationic MG dye through electrostatic attraction. In contrast, under acidic conditions (pH < 6.0), the excess of H+ ions neutralize negatively charged surface sites, resulting in electrostatic repulsion and also competition with H+ protons [47, 61].
To contextualize the results, Table 3 presents the typical pH variation range of various industrial wastewaters. It can be clearly deduced that the proposed Z-X material can be used for the treatment of effluents with high alkaline pH, especially those from textile and dye manufacturing activities.
Typical pH variation ranges of different effluents
| Industry type | Typical pH range | Reference |
|---|---|---|
| Textile | 5.0–12.0 | [55, 62] |
| Pulp and paper | 6.0–9.5 | [63] |
| Tannery (leather) | 3.0–11.0 | [4] |
| Dye manufacturing | 4.0–10.0 | [5] |
| Food processing | 4.0–7.5 | [64] |
| Electroplating/metal | 2.0–11.0 | [7] |
| Brewery/distillery | 4.0–7.0 | [8] |
3.2.4. Effect of initial concentration: adsorption isotherm study
The influence of MG concentrations from 10 to 300 mg⋅L−1 on its removal by the synthesized zeolite is depicted in Figure 7. It can be clearly seen that as the dye concentration increases, the MG-adsorbed amount increases. The removed MG amounts significantly increase from 21.1 to 117.5 mg⋅g−1 at 10 °C, from 13.9 to 71.6 mg⋅g−1 at 20 °C, and from 13.2 to 32.5 mg⋅g−1 at 30 °C. This effect results from the increased driving force provided by higher MG concentrations, which helps overcome the mass transfer resistance of the dye from the liquid phase to the solid phase. Therefore, increasing the concentration of initial cationic dyes boosts dye adsorption onto the surface of Z-X [52]. As the initial dye concentration increases, the available active sites on the adsorbent surface gradually become occupied by cationic dye molecules, leading to surface saturation; beyond this point, the removal efficiency decreases due to the limited number of remaining adsorption sites [65]. Additionally, an increase in temperature leads to a noticeable decrease in the adsorbed amounts, indicating that lower temperatures favor the uptake of MG onto Z-X. This improvement can be ascribed to the increased diffusion of dye molecules and greater accessibility of active sites at elevated temperatures.
Isotherm data of MG removal using Z-X (time: 60 min, pH: 6.06, initial concentration: 10–100 mg⋅L−1, adsorbent dose: 0.4 g⋅L−1).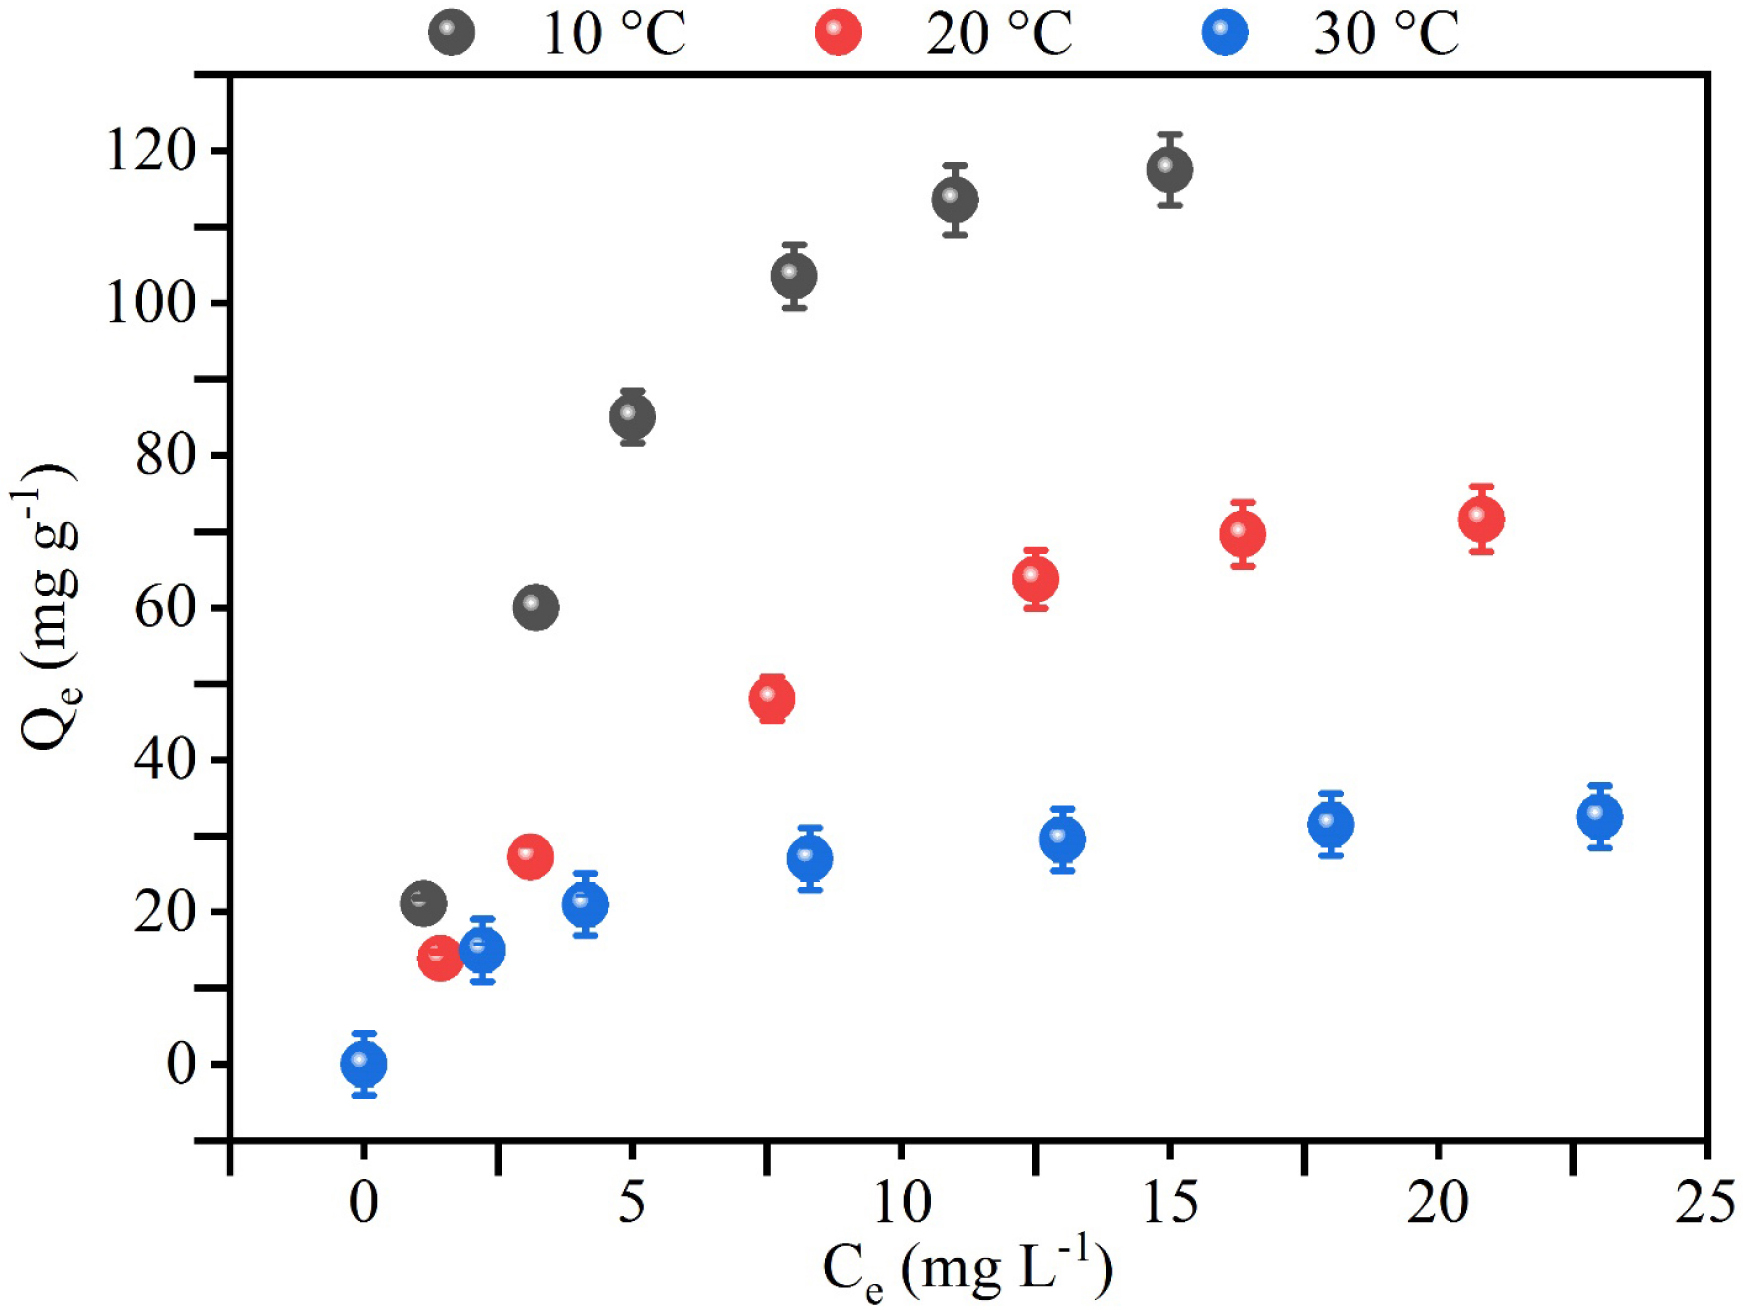
The isotherm experimental data were fitted with Langmuir, Freundlich, Temkin, and Sips models. The results are presented in Figures S2–S4 in the supplementary material and in Table 4. They show that the Langmuir, Temkin, and Sips isotherm models fit the experimental data. For these three models, the R2 values vary between 0.990 and 0.999 and the MAPE between 0.4% and 8.9%. The Freundlich model yields the worst fit to the experimental data with lower R2 values (0.923–0.969) and higher MAPE (between 5.04% and 17.42%).
Isotherm parameters of MG adsorption onto Z-X at different temperatures
| Temperature | Parameters | Values | ||
|---|---|---|---|---|
| 10 °C | 20 °C | 30 °C | ||
| Langmuir | KL | 0.185 | 0.115 | 0.315 |
| RL | 0.35 | 0.46 | 0.24 | |
| Qm (mg⋅g−1) | 166.74 | 104.55 | 36.98 | |
| R2 | 0.990 | 0.997 | 0.999 | |
| MAPE (%) | 8.91 | 2.77 | 0.56 | |
| Freundlich | KF | 34.34 | 15.57 | 13.50 |
| 1/n | 0.486 | 0.526 | 0.293 | |
| R2 | 0.923 | 0.969 | 0.955 | |
| MAPE (%) | 17.42 | 10.35 | 5.04 | |
| Temkin | B (J⋅mol−1) | 38.97 | 22.838 | 7.476 |
| A (L⋅mg−1) | 1.589 | 1.182 | 3.807 | |
| R2 | 0.993 | 0.995 | 0.995 | |
| MAPE (%) | 4.45 | 5.94 | 2.77 | |
| Sips | kL Sips | 0.290 | 0.145 | 0.325 |
| Qmax Sips (mg⋅g−1) | 131.43 | 93.94 | 36.39 | |
| nSips | 1.527 | 1.132 | 1.045 | |
| R2 | 0.998 | 0.998 | 0.999 | |
| MAPE (%) | 2.25 | 2.11 | 0.40 | |
The Langmuir isotherm assumes that the sorbent surface has uniform energy. When it adequately fits the experimental data, it suggests that the pollutant adsorption is homogeneous and occurs on monolayers. The adsorption capacity was estimated by this model to be 166.7, 104.6, and 37.0 mg⋅g−1 at 10 °C, 20 °C, and 30 °C, respectively (Table 4). Moreover, the related RL values were found to be between 0 and 1, indicating MG-favorable adsorption by Z-X. This favorability is also confirmed by the Freundlich 1/n values, which are lower than 1 for the three studied temperatures. For the Temkin isotherm, the constant A, representing the equilibrium binding constant of MG, was determined to be 1.589, 1.182, and 3.807 L⋅mg−1 at 10 °C, 20 °C, and 30 °C, respectively. Moreover, the highest value of the bT constant (B = RT/bT), which reflects the heat of adsorption, was also obtained at 10 °C, indicating more favorable adsorption interactions at this temperature. On the other hand, the values obtained from the Sips analysis support the Langmuir isotherm. Furthermore, according to the Sips model, the Mg-adsorption capacities were calculated to be 131.43, 93.94, and 36.39 mg⋅g−1 at 10, 20, and 30 °C, respectively. A similar trend was observed by Abdelrahman [66] and Radoor et al. [67] when investigating MG removal by zeolite nanostructures and a ZSM-5 zeolite based biocomposite, respectively.
Based on the results of this study, a comparison was made between the MG removal performance of the synthesized Z-X and previously reported adsorption studies. This is summarized in Table 5.
Comparison of MG-adsorption capacity onto Z-X with other adsorbents
| Adsorbent | Adsorbent properties | Adsorption parameters | Qmax (mg⋅g−1) | Reference |
|---|---|---|---|---|
| Nanobentonite | MgO = 52.96%, SiO2 = 27.68%, Al2O3 = 10.45%, Fe2O3 = 6.06%; pHpzc = 5.5 | t = 60 min; C0 = 50–250 mg⋅L−1; D = 10 g⋅L−1; pH = 7; T = 35 °C | 13.8 | [68] |
| ZSM-5 zeolite/polyvinyl alcohol | No properties given | t = 220 min; C0 = 10–100 mg⋅L−1; D = 50 g⋅L−1; pH = 10; T = 25 °C | 29.58 | [69] |
| Zeolite 13X | pHpzc = 7.8 | t = 50 min; C0 = 70 mg⋅L−1; D = 0.2 g⋅L−1; pH = 12; T = 45 °C | 91.92 | [70] |
| Natural zeolite | SiO2 = 68.62%, Al2O3 = 12.64%, FeO3 = 1.50%, MgO = 0.84%, CaO = 1.89%, Na2O = 0.70%, K2O = 3.43%, CuO = 0.75%; loss on ignition = 9.63% | t = 7 min; C0 = 79 mg⋅L−1; D = 0.068 g⋅L−1; pH = natural; T = 25 °C | 98.04 | [71] |
| Modified diatomite | SiO2 = 54.2%, CaO = 11.6%, MgO = 0.34%, Al2O3 = 16.2%, MnO = 0.15%, TiO2 = 0.59%, K2O = 2.7%, Na2O = 8.8%, Fe2O3 = 1.5%; loss on ignition = 4.0%; BET-SA = 87.5 m2/g; TPV = 0.1148 cm3/g; APS = 4.24 nm; pHpzc = 10.1 | t = 60 min; C0 = 10–400 mg⋅L−1; D = 1 g⋅L−1; pH = 10; T = 15 °C | 420.0 | [72] |
| Zeolite X | C = 3.05%, O = 47.54%, Na = 10.17%, Si = 25.42%, Al = 13.45%, Fe = 0.38%; BET‐SA = 313.8 m2⋅g−1; pHpzc = 6.0 | t = 60 min; C0 = 10–100 mg⋅L−1; D = 0.4 g⋅L−1; pH = 6.06; T = 10 °C | 166.7 | This study |
t: contact time; C0: MG initial concentration; D: adsorbent dose; T: temperature; BET-SA: BET surface area; TPV: total pore volume; APS: average pore size.
Based on Table 5, it can be deduced that the proposed Z-X can be considered an attractive material for removing MG from aqueous solutions. The MG-adsorption capacity of the proposed Z-X is around 12.0, 5.6, and 1.8 times higher than those obtained for nanobentonite, ZSM-5 zeolite/polyvinyl alcohol, and zeolite 13X, respectively.
3.2.5. Effect of temperature: thermodynamic study
The effect of temperature on MG removal by Z-X was evaluated for aqueous solution temperatures of 10, 20, and 30 °C, a contact time of 60 min, an initial pH of 6.06, and an adsorbent dose of 0.4 g⋅L−1. The thermodynamic parameters comprising Gibbs free energy, enthalpy, and entropy (calculated from the graph in Figure S5) are presented in Table 6. The calculated ΔG° values at the studied temperatures are negative, indicating that the sorption process of MG onto Z-X is spontaneous and favorable [73]. The ΔH° value was estimated to be −39.703 kJ⋅mol−1, signifying that MG adsorption is an exothermic process [74]. Besides, the negative ΔS° value (−0.108 kJ⋅mol−1⋅K−1) indicates that dye molecules at the solid–liquid interface become more ordered during the adsorption process compared to their state in the bulk solution [75]. Comparable thermodynamic parameters were reported for the sorption of MG onto a clay-based adsorbent [76].
Adsorption thermodynamic parameters of MG removal by the prepared Z-X (contact time: 60 min, initial pH: 6.06, adsorbent dose: 0.4 g⋅L−1)
| T (°C) | ΔG (kJ⋅mol−1) | ΔH (kJ⋅mol−1) | ΔS (kJ⋅mol−1⋅K−1) |
|---|---|---|---|
| 10 | −9.087 | −39.703 | −0.108 |
| 20 | −7.867 | ||
| 30 | −6.928 |
3.3. Adsorbent regeneration study
The regeneration study of the MG-loaded Z-X was conducted by using distilled water at 100 °C and under reflux for 6 h according to the procedure from Section 2.5 for four adsorption/desorption cycles. The results (Figure 8) show that for the first and second adsorption/desorption cycles, the regeneration efficiency decreases to 95.5% and 89.5% of the initial capacity (cycle 0), respectively. This adsorption performance highly decreases and reaches less than 67% at the third cycle and less than 50% at the fourth cycle. This behavior can be explained by the gradual occupation and saturation of the available active sites on Z-X by MG molecules during repeated adsorption–desorption cycles. In practical cases, two desorption/adsorption cycles can be used since the adsorption efficiency remains relatively high (greater than 89%).
Regeneration of the Z-X material loaded with MG dye.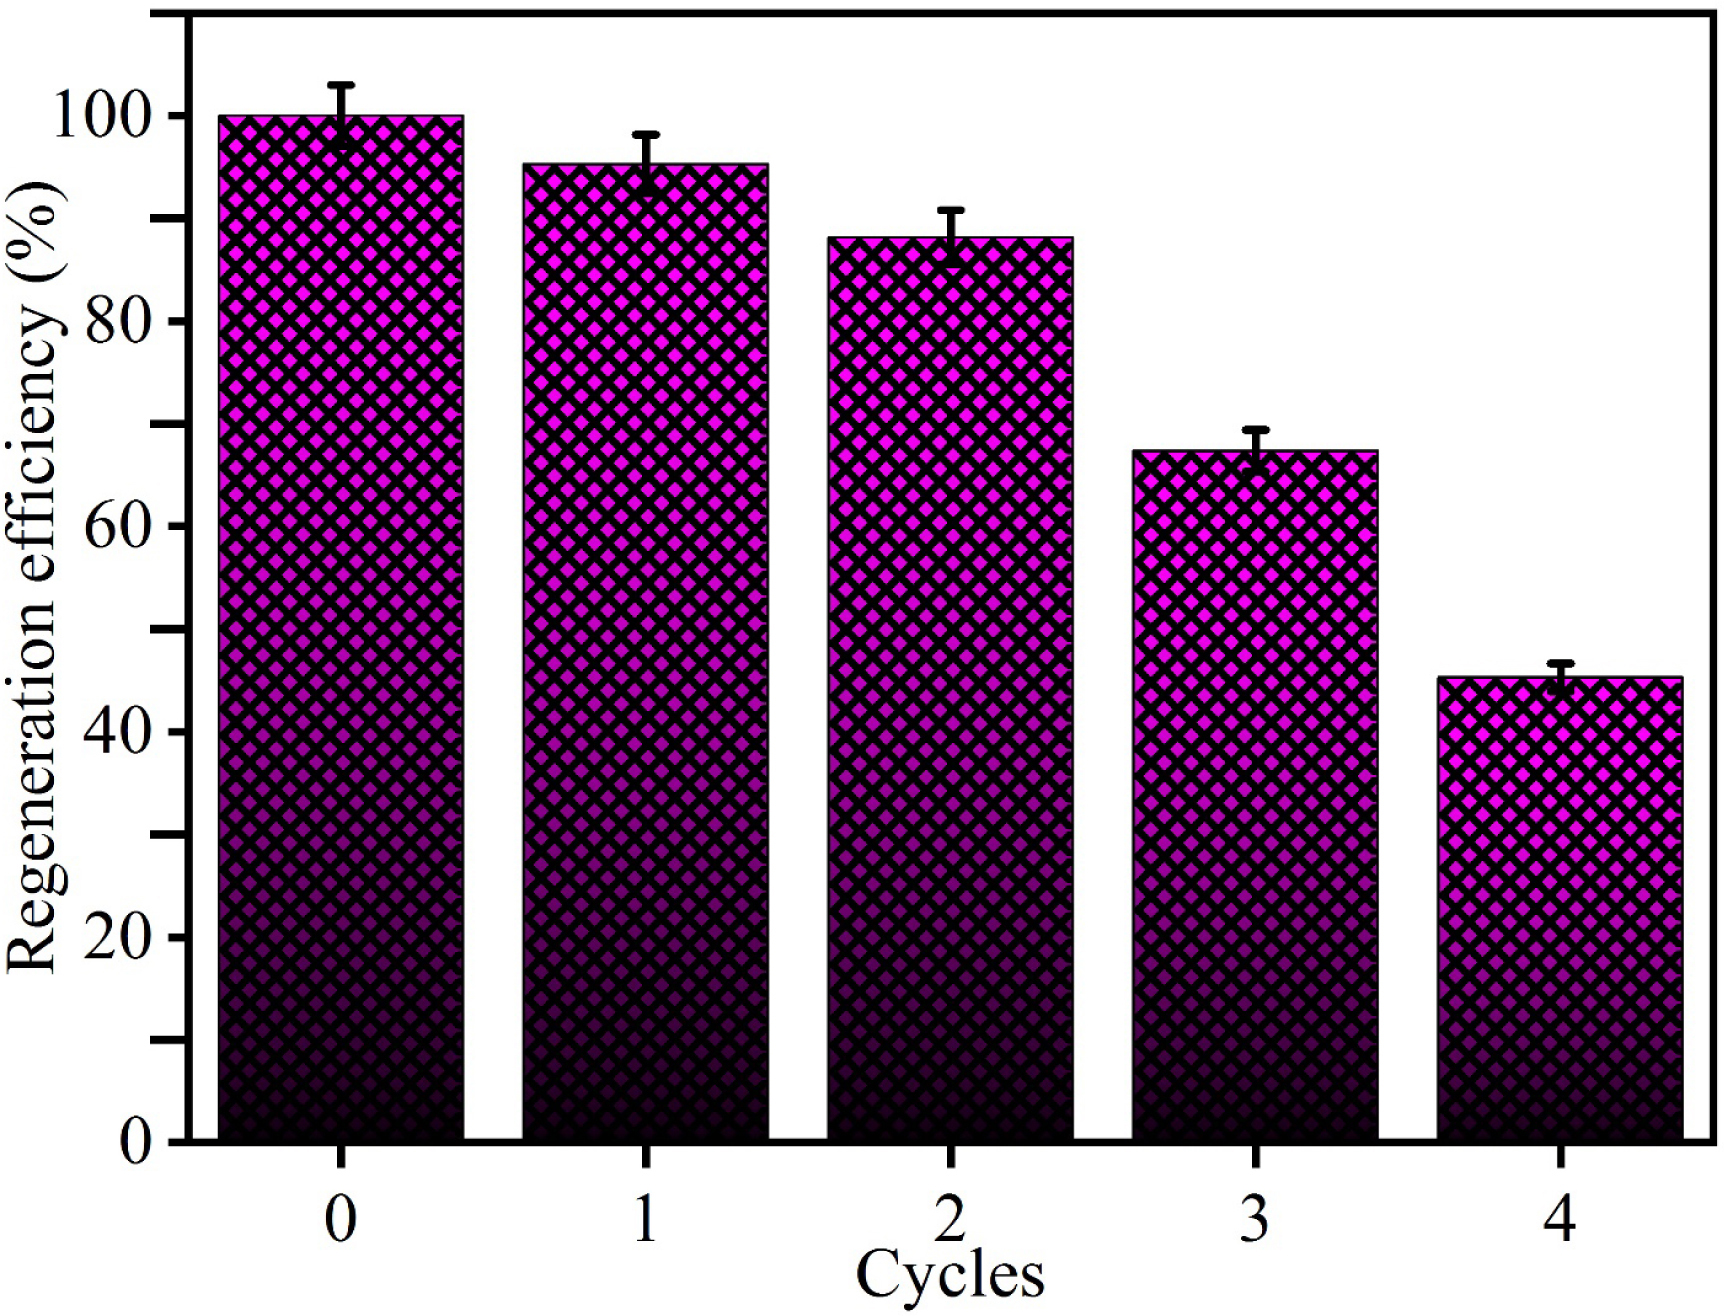
On the other hand, validating these encouraging adsorption and regeneration results in larger dynamic systems, such as laboratory columns and continuous stirred-tank reactors, is crucial for scaling up to real industrial applications. This approach not only supports the principles of circular economy and sustainability but also aligns with national and international sustainable development goals.
3.4. Adsorption mechanism exploration
The sorption process follows the Langmuir model, suggesting monolayer coverage of the dye molecules. It is best described by the PFO kinetic model, indicating that physical adsorption is the dominant mechanism across the studied concentration range. The effect of the initial pH study shows that the adsorption mechanism of MG onto Z-X also involves electrostatic interactions. Moreover, it seems that based on the FTIR analysis of Z-X before and after MG adsorption, the complexation mechanism is also involved in MG adsorption (Figure 9). A noticeable reduction of the Si–O, Al–O, and O–H peaks was observed, suggesting that MG was retained with these functional groups through the complexation mechanism.
FTIR spectra of the Z-X material before and after MG adsorption.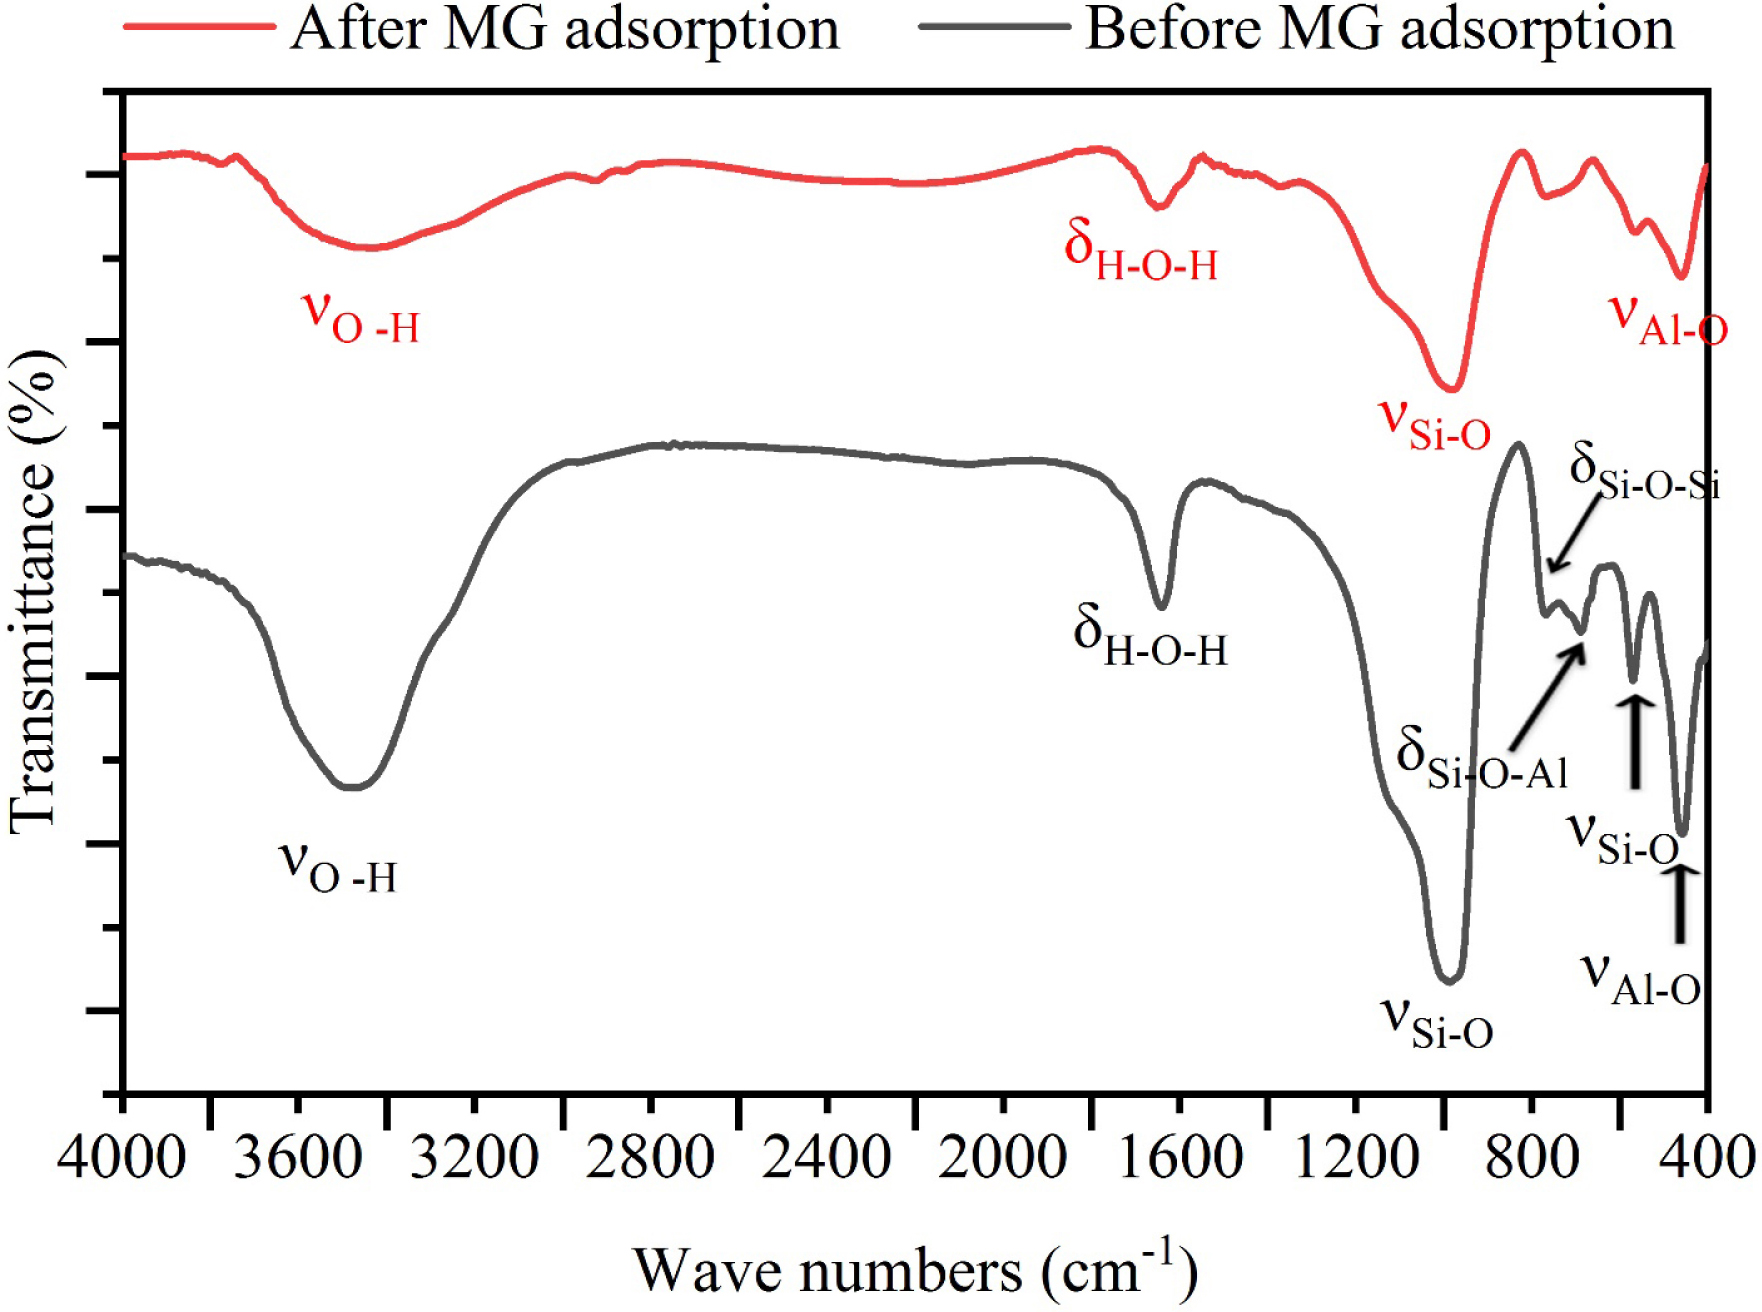
3.5. Cost estimation
The commercial viability of any adsorbent is largely determined by its cost. Therefore, the production cost of Z-X and its application for MG adsorption are reported in Table 7. The estimation is conducted using life cycle cost analysis, a standard practice in wastewater treatment plants. Consequently, the analysis accounted for factors such as the cost of the used chemical reagents, activation, washing, dehydration, calcination, and regeneration. Moreover, to address potential unforeseen expenses, an extra 10% cost is incorporated into the analysis. The whole estimated cost was evaluated to be 9.24 USD⋅kg−1. It involves not only the Z-X synthesis but also the application for MG removal and the regeneration process. This cost is lower than that reported for commercial charcoal (∼13.62 USD/kg) [77] and NaA zeolite (26.092 USD/kg) [78].
Cost estimation of the proposed adsorbent synthesis and application
| No. | Task | Item | Designation | Quantity | Cost (USD) |
|---|---|---|---|---|---|
| 1 | Raw material synthesis: 1 kg of Z-X | Chemical reagents and water | Sodium silicate | 2 kg | 1.2 |
| Aluminum chloride | 500 g | 0.2 | |||
| Heating | kW of electricity (24 h × 2 kW) | 3.36 | |||
| Sodium hydroxide | 147.5 g of NaOH | 0.33 | |||
| Water for washing | 100 L | 0.10 | |||
| Energy | Agitation | kW of electricity (0.67 h × 2 kW) | 0.094 | ||
| Dehydration | kW of electricity (24 h × 48 kW) | 1.68 | |||
| 2 | Regeneration of 1 kg | Regeneration solution | Tap water | 1000 L | 0.60 |
| Energy | Heating | kW of electricity (6 h × 2 kW) | 0.84 | ||
| Overall cost | 8.4 | ||||
| 10% of overall cost | 0.84 | ||||
| Net cost (USD⋅kg−1) | 9.24 | ||||
3.6. Brief presentation of a real-case industrial scenario
To illustrate the attractiveness of the proposed Z-X in treating industrial effluents, we studied the following hypothetical case: a textile effluent containing MG at a concentration of 10 mg⋅L−1 and a pH of 10, produced at a flow rate of 100 m3⋅day−1. Based on the experimental results, under these conditions, 90% of MG can be removed after a contact time of 60 min for a Z-X dose of 0.4 g⋅L−1. Therefore, the required mass of Z-X to treat the overall flow rate will be 40 kg per day. Furthermore, this adsorbent mass can be regenerated and used in two consecutive cycles with an adsorption efficiency above 89%. In such a case, this mass can treat the produced wastewater (300 m3) in 3 days.
For a production cost of 9.24 USD⋅kg−1 of Z-X, the treatment of 300 m3 will cost around 370 USD. Thus, the cost of treatment of 1 m3 by Z-X is 1.23 USD⋅m−3. This cost is attractive in comparison with various materials [77, 78]. This scenario demonstrates that the proposed Z-X offers an efficient and economically viable solution for treating dye-contaminated industrial wastewater, with a high scalability potential.
4. Conclusion
The objective of this study was to evaluate the adsorption performance of MG by Z-X and to explore the involved mechanisms. The findings of this work show that this process is strongly affected by various factors such as adsorbent dose, solution pH, contact time, and especially the initial MG concentration. The MG-adsorption capacity is evaluated to be 166.7 mg⋅g−1 at 10 °C, which is higher than those of various engineered materials. The modeling of kinetic and isothermal data as well as FTIR analyses of the material before and after dye removal suggests that the adsorption process involves both physical and chemical mechanisms including electrostatic interactions, pore filling, and complexation. Moreover, this process is exothermic and spontaneous, which supports its feasibility under ambient conditions. The overall cost of Z-X synthesis/regeneration and application for MG removal was evaluated to be 9.24 USD⋅kg−1, which is lower than those of various engineered materials. Therefore, the proposed Z-X material can be considered an efficient and sustainable alternative to conventional adsorbents for the treatment of dye-rich effluents. Future work should focus on regeneration performance and the material’s behavior in multi-component or real wastewater systems under dynamic conditions to validate its large-scale applicability.
Declaration of interests
The authors do not work for, advise, own shares in, or receive funds from any organization that could benefit from this article, and have declared no affiliations other than their research organizations.
Supplementary materials
Supporting information for this article is available on the journal’s website under https://doi.org/10.5802/crchim.471 or from the author.