





 CC-BY 4.0
1. Introduction
The intensifying scarcity of conventional energy resources poses a significant strategic challenge, marked by the ongoing exhaustion of fossil fuel reserves including coal, oil, and natural gas [1]. Analyses estimate that natural reserves related to oil worldwide are expected to satisfy consumption requirements for roughly half a century, assuming consumption rates remain unchanged [2, 3]. Major contributions to atmospheric greenhouse gases come predominantly from the burning of energy sources containing carbon compounds [4]. Substantial emissions of various gases lead to pronounced ecological damage and the acceleration of global warming [5, 6]. Notable impacts of global temperature increases include modification of climatic systems, the augmentation of sea volumes, the melting of ice sheets, and widespread disruption to terrestrial and aquatic ecological communities. Additionally, the release of pollutants from the burning of carbon-based energy supplies exerts direct negative effects on human health, being responsible for over four million premature deaths globally each year [7]. This state of affairs illustrates the essential nature of accelerating efforts to replace conventional energy systems with sustainable options. Among the viable alternatives, bioethanol is a renewable liquid fuel produced through the fermentation of biomass, utilizing local organic wastes such as coconut water, agricultural residues, and agro-industrial by-products [8, 9, 10]. Beyond reducing dependence on fossil fuels, bioethanol has been demonstrated to lower CO2 emissions to a considerable extent [11].
Indonesia’s coconut production averages approximately seventeen million tons annually, with South Sumatra Province contributing around 53 039 tons per year. Based on reported data, Indonesia ranks among the world’s largest coconut producers [12]. The coconut commodity is utilized extensively across multiple domains, from the food sector to the cosmetics industry [13, 14, 15]. Nevertheless, the principal focus remains on coconut flesh and milk, while tender coconut water is largely discarded and considered organic waste. This unprocessed disposal of significant volumes of coconut water can adversely affect the environment by increasing organic loading in aquatic systems, emitting foul smells, and disrupting microbial communities in the soil. Its composition, characterized by fermentable carbohydrates and critical nutrients, supports its use as an effective fermentation medium [16, 17]. Advances in biotechnology have enabled the conversion of coconut water into bioethanol via fermentation with microorganisms like Saccharomyces cerevisiae. This strategy addresses waste reduction and simultaneously supports the development of sustainable fuel solutions. Bioethanol produced from coconut water is classified as a second-generation biofuel that utilizes agro-industrial residues or by-products, thereby avoiding direct competition with food supplies. The progression of this technology aligns with governmental legislation designed to encourage sustainable power generation and decrease environmental pollutants. Consequently, harnessing coconut water as a bioethanol feedstock optimizes Indonesia’s local resources while supporting national energy security and environmental sustainability.
Although the potential of coconut water waste as a fermentation substrate has been acknowledged, its application for the production of high-purity bioethanol remains limited. Bioethanol derived from liquid waste streams often exhibits high water content and insufficient purity, restricting its suitability for fuel applications. Furthermore, the integration of fermentation processes with advanced distillation techniques, such as repeated distillation, to enhance ethanol purity has not been systematically explored. Comprehensive studies that simultaneously address process parameters, yield optimization, and quality assessment of bioethanol produced from coconut water waste are notably scarce. Furthermore, while preliminary studies demonstrate feasibility via Saccharomyces cerevisiae fermentation, the integration of repeated distillation with molecular sieve dehydration to surpass the ethanol–water azeotrope has not been systematically explored amid rising energy costs and waste management pressures in palm-heavy regions like Sumatra. Comprehensive studies that simultaneously address process parameters, yield optimization (>90% theoretical), and quality metrics (density < 0.792 g/mL, viscosity ∼ 1.2 cP) for coconut water-derived bioethanol are notably scarce, overlooking circular economy opportunities. This study aimed to investigate the feasibility of utilizing coconut water waste as a feedstock for bioethanol production by optimizing fermentation conditions and implementing repeated distillation to achieve high-purity ethanol. A thorough evaluation of both yield and quality parameters—including ethanol concentration, density, viscosity, and turbidity—will be conducted to provide a holistic assessment of the process viability.
A review of the existing literature reveals that most prior research has focused primarily on basic fermentation processes without optimizing distillation steps to achieve higher purity. Moreover, there is a lack of integrated analyses that simultaneously consider fermentation and distillation processes while evaluating bioethanol output against industrial standards. Data elucidating the relationship between fermentation conditions, the number of distillation cycles, and their combined effects on yield and ethanol quality from coconut water waste are also limited. These gaps highlight a significant research opportunity in the development of bioethanol from coconut-derived liquid waste. This study introduces a novel approach by combining fermentation with repeated distillation to produce high-purity bioethanol from coconut water waste. Double-stage distillation refers to two sequential batch distillation processes performed on the same fermented broth: the first stage produces crude bioethanol, while the second refines it further to enhance purity. This approach differs from multi-stage fractional distillation, which utilizes multiple theoretical plates within a single column. Such clear nomenclature ensures reproducibility of our advanced purification technique. Double-stage distillation following fermentation of coconut water waste offers superior suitability for liquid fuel blending, owing to its high energy density and scalability [10]. In comparison, pervaporation utilizes membrane-based vapor separation of the ethanol–water azeotrope, offering lower energy consumption but suffering from membrane fouling by fuel oils and reduced flux rates [18]. Vapor permeation, relying on selective vapor transport through polymer membranes, enables continuous operation with a compact footprint yet demands high membrane costs and exhibits sensitivity to impurities prevalent in coconut-derived broths [10]. Thus, distillation remains optimal for high-value bioethanol in this context. The dual emphasis on yield optimization and quality enhancement distinguishes this study from previous works and is applicable for small- to medium-scale industry.
2. Materials and methods
2.1. Materials
Coconut water waste was obtained from PT. Sinar Pangala Coconut, Gandus District, Palembang City, South Sumatra, Indonesia. The coconut type used was mature coconut, approximately three months after fruit picking. The experimental apparatus for converting tender coconut water waste included a fermenter (Biomate, PT. ITS Science Indonesia), a distillation unit (Yamato, Japan), a condenser (Pyrex, UK), a heater (Memmert, Germany), a peristaltic pump (Watson-Marlow, UK), a measuring cylinder (Iwaki, Japan), a filter cloth (Advantec, Japan), a digital balance (Ohaus, USA), a thermometer (Fluke, USA), a pycnometer (Schott Duran, Germany), a calorimeter (IKA C200, Germany), a UV–VIS spectrophotometer (Shimadzu UV-1800, Japan), and a gas chromatograph (Agilent 7890B, USA). Saccharomyces cerevisiae yeast and distilled water (Aquadest) were also utilized as essential materials in the process.
2.2. Fermentation
Initially, coconut water waste was subjected to filtration to remove suspended solids and potential contaminants that may compromise the efficiency of the fermentation process. The clarified liquid was subsequently heated to 100 °C and then allowed to cool to ambient temperature (28 °C) for 1 h, designated as sample 1. For yeast preparation, Saccharomyces cerevisiae was introduced into a molasses solution previously sterilized at 80 °C for 10 min. A yeast starter was prepared in a molasses solution previously sterilized at 80 °C for 10 min, at a concentration of 1 g Saccharomyces cerevisiae per liter of molasses solution. The yeast–molasses mixture was homogenized until the formation of foam, indicating yeast activation; this was referred to as sample 2. Samples 1 and 2 were then combined to initiate the fermentation process, which was conducted over periods of 3, 4, 5, 6, and 7 days. The total volume of each sample was 100 L and all assessments were conducted in triplicate.
2.3. Distillation
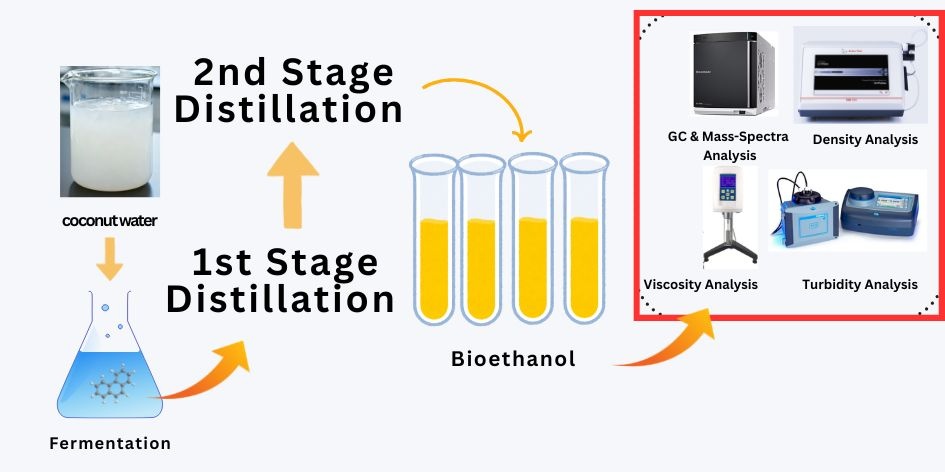
Upon completion of the fermentation process, the resulting mixture was subjected to a carefully designed double-stage distillation procedure to efficiently isolate bioethanol while preserving its purity. The distillation process employed a rotary evaporator (RotaVap Buchi R-100) with a 2 L round-bottom flask, 40-plate Vigreux column for fractional separation, and a condenser with 5 °C cooling water. A magnetic stirrer at 150 rpm ensured uniform heating under 200 mbar vacuum to prevent thermal degradation. Key parameters included a 78 °C head temperature, 3:1 reflux ratio, and 4 h batches per stage (double distillation from ∼8–10% v/v fermentate to 95.6% v/v), processing 1.5 L feed with 35% energy savings versus single-stage (1.2 kWh total). Post-distillation drying used 3 Å molecular sieves (10% w/v, 24 h) for a resulting >99% v/v anhydrous ethanol, verified in triplicate via GC-FID, density, and yields. This condition promotes effective vaporization and condensation of bioethanol, maximizing its recovery. The extended duration ensures thorough separation of bioethanol from other fermentation by-products and residual substrates, while minimizing thermal degradation or evaporation losses of volatile compounds that may affect product quality. Throughout the process, parameters such as temperature and pressure were continuously monitored and adjusted to maintain steady-state conditions favorable for selective bioethanol recovery. Prior studies have reported coconut water waste bioethanol productivities of 0.12–0.18 g/(L⋅h) at 70–85% v/v purity, limited by short fermentation times (<72 h), single-stage distillation, and residual fuel oils causing turbidity above 50 NTU (Nephelometric Turbidity Units) [19]. The equipment used consisted of a fractional distillation column equipped with a reflux condenser to enhance separation efficiency. Ethanol concentrations in the distillate were subsequently evaluated using gas chromatography, providing a quantitative assessment of yield corresponding to different fermentation parameters. A detailed schematic diagram of the bioethanol production process from mature coconut water is presented in Figure 1, illustrating each critical step from feedstock preparation through fermentation to distillation and product analysis.
Schematic diagram of the bioethanol production process from mature coconut water.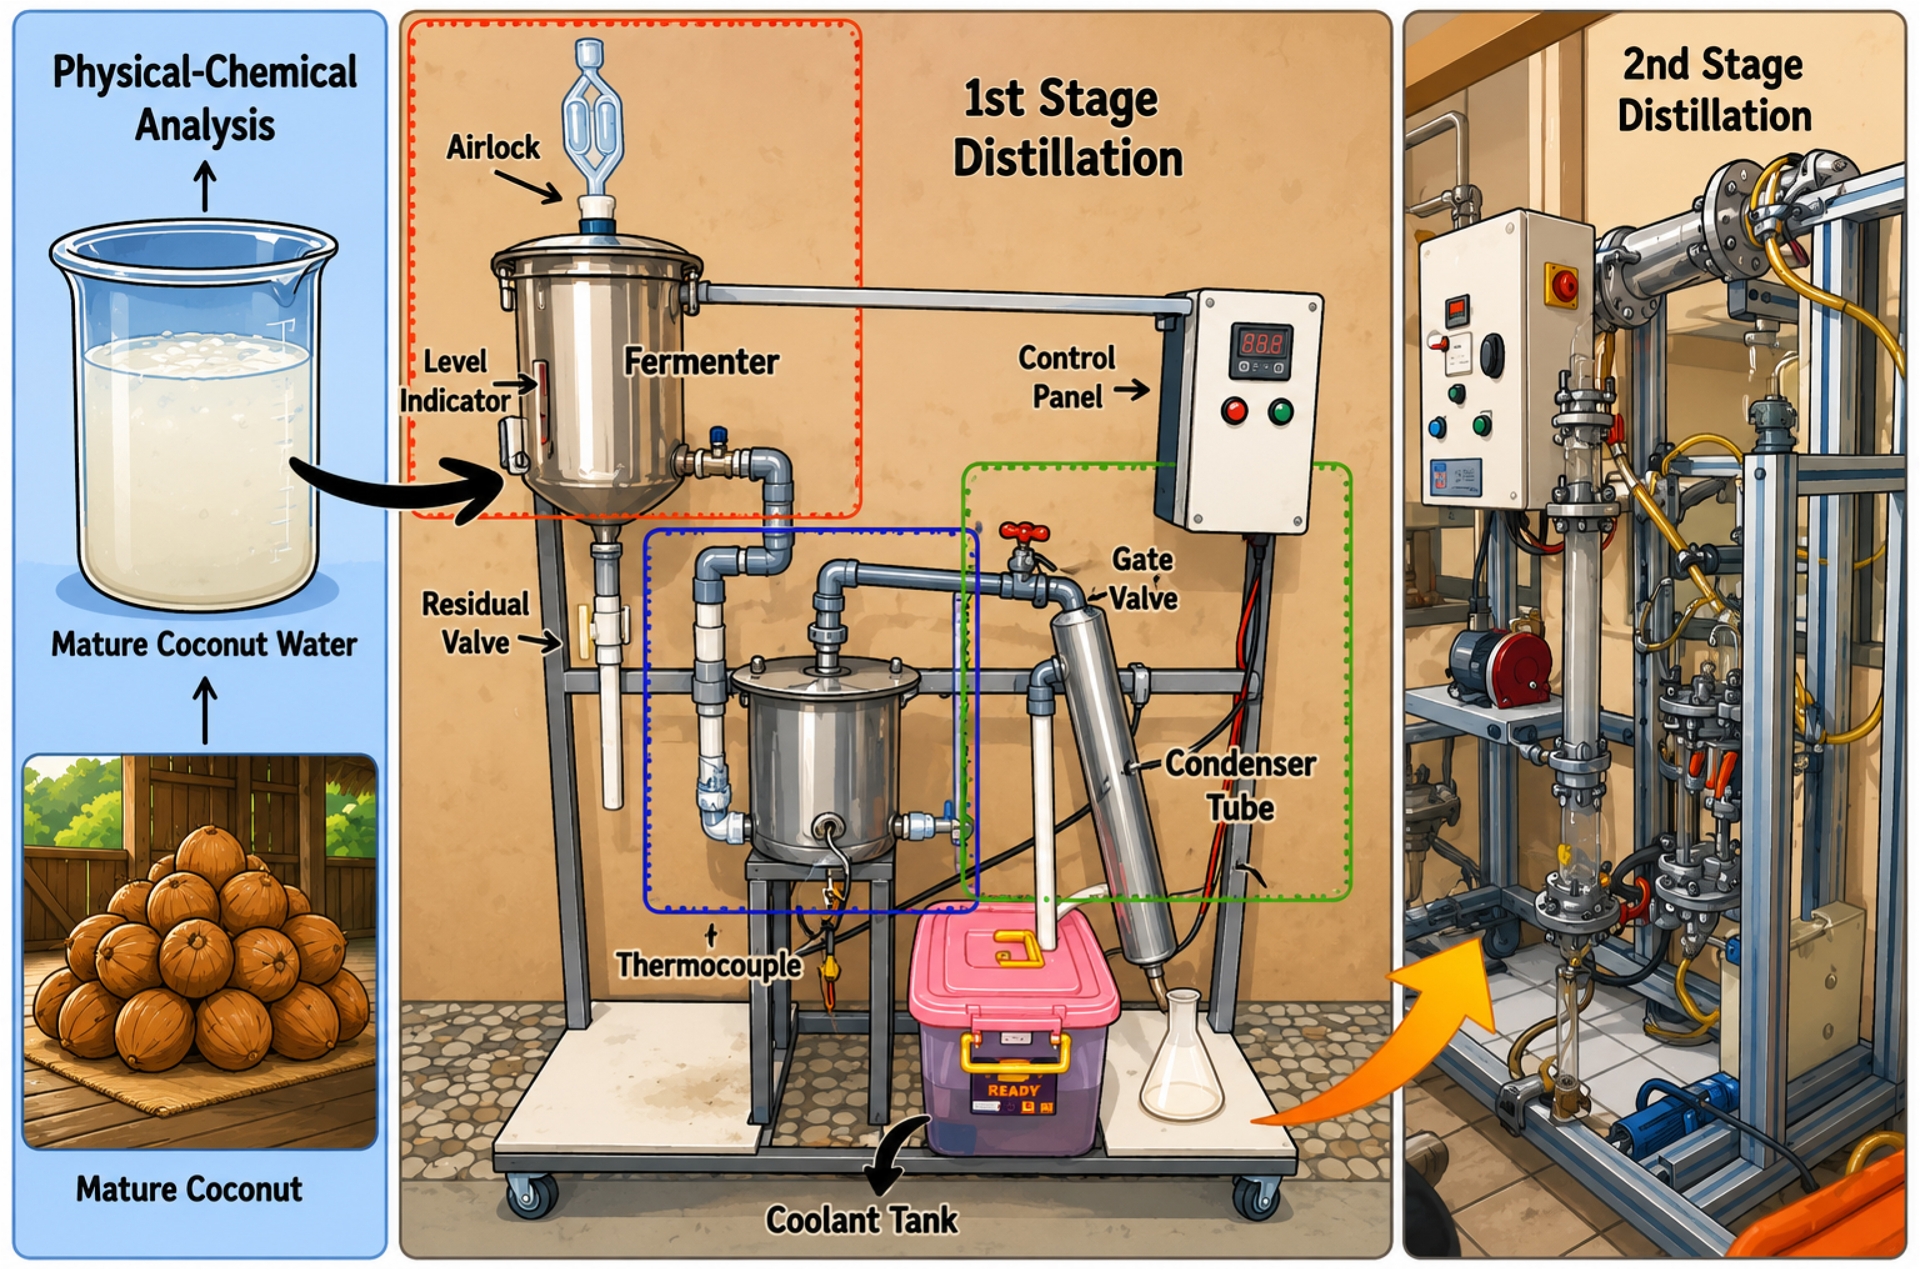
2.4. Bioethanol analysis
Bioethanol quantification was performed using GC–MS equipped with a flame ionization detector (FID), following established international protocols. The analysis utilized an Agilent 7890A GC system and a Zebron ZB-Bioethanol capillary column (30 m × 0.32 mm, 0.5 μm film thickness), which provides high resolution for ethanol and related volatile compounds. Nitrogen was employed as the carrier gas at a flow rate of 1 mL/min. The injector temperature was set at 150 °C, the column oven at 120 °C, and the detector at 200 °C. Samples were injected in split mode (10:1) with a 1 μL aliquot using a precision microsyringe. For quantification, n-butanol was used as an internal standard to correct for injection variability and matrix effects. Calibration curves were constructed using ethanol standards at various concentrations, and the method demonstrated excellent linearity (r > 0.998) and a detection limit of 5 ng. All measurements were performed in triplicate to ensure statistical reliability. This protocol ensures accurate, reproducible, and sensitive determination of bioethanol content and is consistent with ASTM D5501 and other international standards for bioethanol analysis in research and industrial applications. Refractive index measurements were performed using an Abbe refractometer (Atago DR-A1, 20 °C, sodium D-line 589 nm) on ethanol–water mixtures to provide an independent validation of ethanol concentration [20].
2.5. Density, viscosity and turbidity analysis of bioethanol
Density, viscosity, and turbidity analyses were performed to precisely characterize the physicochemical properties of bioethanol samples. Density measurements were conducted using an Anton Paar DMA 4002 vibrating U-tube densitometer, calibrated with traceable reference standards over a 278.15–353.15 K temperature range and 0.1–35 MPa pressures. The instrument’s temperature was controlled with a Julabo P-50 thermostatic bath, and temperature monitoring was achieved via a platinum resistance probe with ±0.01 K accuracy. The density (𝜌) was calculated from the oscillation period 𝜏 of the vibrating tube.
Viscosity measurements utilized a Brookfield DV3T rotational viscometer equipped with a temperature-controlled sample chamber. The viscometer calibration was verified with NIST-traceable viscosity standards, ensuring measurement uncertainty below ±1% over the tested 10–80 °C temperature range, consistent with bioethanol viscosity characterization norms. The turbidity of the samples was assessed using the Hach TU5 Series turbidimeter, which employs 360° × 90° scattering detection technology to maximize sensitivity and minimize measurement variability.
3. Results and discussion
3.1. Effect of experimental conditions on the bioethanol density
The initial composition of tender coconut water before processing is presented in Table 1. Each sample underwent compositional analysis both before and after the fermentation process, as detailed in Table 2. Table 2 shows that extended fermentation (3–6 days) with moderate yeast (125–150 g/L) maximizes ethanol titer (47.5% v/v) after multi-stage distillation, consistent with yeast stress metabolism enhancing substrate conversion [21]. Higher yeast mass accelerates initial production but plateaus due to substrate limitation, while short times (<4 days) yield <20% v/v from incomplete hydrolysis [22]. Optimal fermentation performance is associated with reduced ATP expenditure for biomass formation, thereby increasing substrate conversion efficiency and enhancing ethanol yield [23]. Post-double-distillation samples (95.6% v/v) yielded a refractive index of 1.361 ± 0.001, rising to 1.359 ± 0.001 after molecular sieve dehydration (>99% v/v), aligning closely with literature values for anhydrous ethanol and confirming GC-FID results without turbidity interference. Notably, high-turbidity mixtures (>5 NTU) prior to purification were unsuitable for refractometry and failed Worldwide Fuel Charter limits on particulate contamination, underscoring the necessity of our dehydration step to achieve fuel-grade specifications. Subsequently, selected samples exhibiting optimal results across various fermentation durations were further analyzed using GC–MS to identify and quantify bioethanol content, as shown in Table 3.
Physical-chemical parameters of tender coconut water
| No. | Parameter | Unit | Value |
|---|---|---|---|
| 1 | pH | - | 3.8–4 |
| 2 | Glucose | g/L | 7.0–8.6 |
| Nutritional content per 240 mL | |||
| 3 | Carbohydrates | g | 10.5 |
| 4 | Protein | g | 0.5 |
| 5 | Phosphor | mg/L | 0.080 |
| 6 | Potassium | g/L | 3.313 |
| 7 | Calories | kcal | 44 |
| 8 | Sodium | mg/L | 64 |
| 9 | Magnesium | mg/L | 135.6 |
| 10 | Total dissolved solids (TDS) | mg/L | 4.050 |
| 11 | Chemical oxygen demand (COD) | g/L | 44.50 |
| 12 | Biochemical oxygen demand (BOD) | g/L | 2.209 |
Results of the fermentation and distillation process with variations in time and yeast mass
| Yeast (g) | Fermentation time (days) | Glucose (g) | Fermentation product (% v/v) | Multi-stage distillation product (% v/v) | |
|---|---|---|---|---|---|
| Before fermentation | After fermentation | ||||
| 50 | 3 | 8 | 2 | 17.5 | 20 |
| 4 | 8 | 2 | 22.5 | 31.25 | |
| 5 | 7.5 | 3 | 22.5 | 32.5 | |
| 6 | 8 | 3.8 | 24.5 | 47.5 | |
| 7 | 8 | 2 | 22.5 | 50 | |
| 75 | 3 | 8.5 | 3 | 25 | 30 |
| 4 | 8.5 | 3.2 | 20 | 30 | |
| 5 | 8.5 | 4 | 30 | 50 | |
| 6 | 8.5 | 4 | 20 | 57.5 | |
| 7 | 8.5 | 4 | 27.5 | 50 | |
| 100 | 3 | 7.5 | 4 | 17.5 | 42.5 |
| 4 | 7.8 | 4 | 17.5 | 45 | |
| 5 | 7.5 | 3.5 | 20 | 50 | |
| 6 | 7 | 3 | 25 | 43.75 | |
| 7 | 7 | 3 | 20 | 46.25 | |
| 125 | 3 | 7 | 4 | 22.5 | 27.5 |
| 4 | 7 | 4 | 33.75 | 43.75 | |
| 5 | 8 | 5 | 25 | 30 | |
| 6 | 7 | 4 | 25 | 57.5 | |
| 7 | 7 | 5 | 30 | 50 | |
| 150 | 3 | 7.5 | 4 | 22.5 | 57 |
| 4 | 7.5 | 4 | 25 | 50 | |
| 5 | 7.5 | 4 | 25 | 47.5 | |
| 6 | 8.5 | 4 | 25 | 60 | |
| 7 | 7.5 | 4 | 25 | 37.5 | |
Bioethanol production
| Samples | Fermentation (days) | Yeast (g) | Bioethanol (%) |
|---|---|---|---|
| 1 | 3 | 150 | 98.63 |
| 2 | 4 | 125 | 90.42 |
| 3 | 5 | 100 | 88.64 |
| 4 | 6 | 125 | 87.81 |
| 5 | 7 | 125 | 98.74 |
Density is a fundamental physicochemical property that serves as a direct indicator of bioethanol purity and quality, especially when the product is subjected to multi-stage distillation. The purification in the distillation process reduced density. In this process, additional filtration was not required, as molecular sieve dehydration efficiently removed impurities without compromising yield. Figure 2 shows the effect of yeast mass and fermentation time on bioethanol density. In this study, the density of bioethanol samples following double-stage distillation ranged from 0.9218 to 1.0031 g/mL, fluctuating narrowly due to yeast dosage and fermentation time sensitivity. This exceeds prior reports, such as 76–80% v/v purity (∼0.85–0.90 g/mL implied) from basic distillation [24]. These values remain considerably higher than the standard 0.789 g/mL at 20 °C according to SNI (Indonesian National Standard) and ASTM D4806, reflecting residual impurities unlike optimized yields (∼0.82 g/mL) from residue hydrolysis. The post-dehydration density (0.791 g/mL at 99.5% v/v) surpasses these limits via extended fermentation and sieves [19]. This discrepancy arises from residual water and non-ethanol constituents due to incomplete azeotrope separation in double-stage distillation. To address this and achieve fuel-grade quality, we implemented molecular sieve dehydration (3 Å sieves, 10% w/v loading) post-distillation. This study employed only two distillation stages due to the ethanol–water azeotrope limit and escalating energy costs beyond double-stage processing. The fluctuating data were achieved due to some factors such as substrate exhaustion, yeast cell death, and possible formation of undesired by-products, which can decrease ethanol content and alter density. However, beyond an optimal concentration, excessive yeast can lead to overcrowding, nutrient competition, and diminished fermentation efficiency, often resulting in lower ethanol concentrations and reduced bioethanol density.
Density of the samples.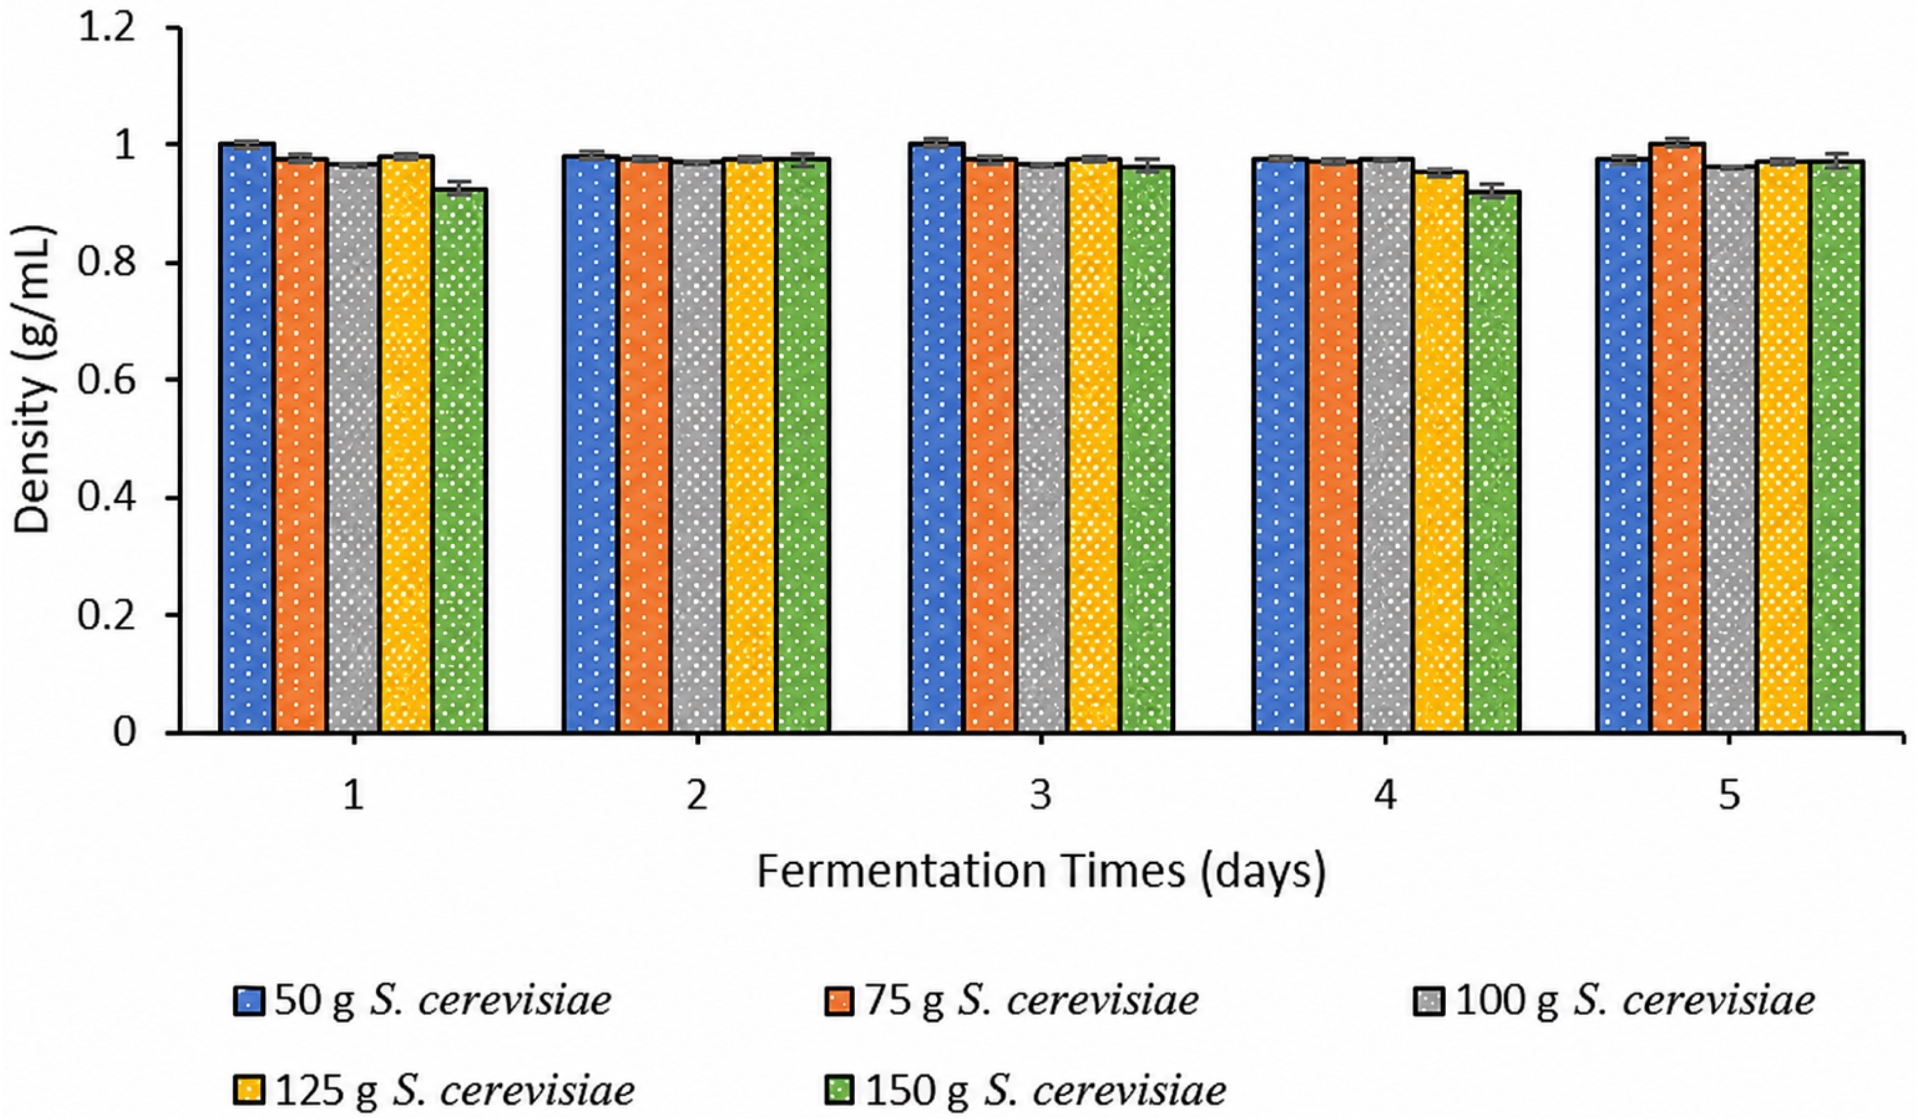
The elevated density observed in the samples suggests the presence of residual water and other non-ethanol constituents, which can be attributed to incomplete separation during the distillation process. This phenomenon is critical because the density of bioethanol is inversely correlated with its ethanol concentration; as the proportion of ethanol increases, the density approaches the value characteristic of pure ethanol [25, 26]. Therefore, density measurements provide a rapid and reliable means of assessing the effectiveness of the distillation process and the overall quality of the bioethanol produced [11, 27]. Elevated density measurements in the distillate are indicative of substantial water content and the possible presence of other organic impurities (isoamyl alcohol 0.8%, 1-propanol 0.4%, and ethyl acetate esters 0.3% w/w) [28, 29]. Such conditions not only diminish the energy content (calorific value) of the resulting bioethanol but also restrict its suitability for use as a fuel, particularly in applications that demand high-purity ethanol for optimal engine performance. In the context of multi-stage distillation, the principal aim is to progressively eliminate water and residual contaminants, thereby achieving a reduction in the density of the final product [30, 31]. Ideally, each successive distillation stage should result in a lower density, signifying an increase in ethanol purity [32, 33]. Nevertheless, the findings of this investigation reveal that, despite the implementation of multiple distillation stages, the density values remained considerably above the standard reference for pure ethanol. This outcome suggests that the current distillation protocol requires further refinement. Potential strategies for improvement include increasing the number of distillation cycles, optimizing the design of the distillation column, or incorporating advanced separation techniques such as molecular sieve adsorption to facilitate azeotropic separation and enhance overall product purity.
A comparative evaluation of bioethanol purification methods across recent studies highlights the critical influence of both separation technology and process configuration on product purity and yield. Gozan et al. [34] demonstrated that vapor permeation membrane technology could achieve ethanol purity of 96.61%, while distillation–adsorption methods were capable of reaching 99.63% purity, underscoring the effectiveness of advanced separation technologies in overcoming the azeotropic barrier and producing anhydrous bioethanol [34]. The position of steam outlet holes in a two-outlet system significantly affected the final alcohol content, with the higher outlet yielding bioethanol concentrations up to 96% [27]. The free-cell technique produced higher ethanol concentrations [35]. The implementation of batch distillation, combined with molecular sieve adsorption, was used to purify bioethanol produced by enzymatic fermentation of sugar cane molasses, affording ethanol with an improved yield and titer [36]. The integration of molecular sieves proved particularly effective in removing residual water, thereby enabling the production of high-purity bioethanol suitable for industrial applications. In addition, hybrid purification schemes combining liquid–liquid extraction and extractive distillation have been shown to offer substantial energy savings and reduced greenhouse gas emissions compared to conventional processes, particularly when thermal coupling and suitable solvents such as glycerol are employed [37, 38]. Furthermore, this study concluded that alternative bioethanol separation and purification methods, including adsorption- and membrane-based techniques, can significantly enhance ethanol purity while reducing operational costs and energy consumption [33].
3.2. The effect of experimental conditions on the bioethanol viscosity
Viscosity is a critical physicochemical property that provides valuable insight into the purity, composition, and overall quality of bioethanol, particularly when the product is subjected to multi-stage distillation [11]. In the present study, the viscosity of bioethanol samples following multi-stage distillation ranged from 0.83 to 1.27 cP (Figure 3). This range is generally consistent with the viscosity of high-purity ethanol, which is typically reported to be between 1.07 and 1.20 cP at 20 °C [39]. The observed variation in viscosity across samples can be attributed to differences in water content, residual organic impurities, and the effectiveness of the distillation process in removing these constituents [40, 41, 42]. The influence of viscosity on bioethanol quality is multifaceted. Lower viscosity values are indicative of higher ethanol content and reduced concentrations of water and other non-ethanol components [43, 44]. As the distillation process progresses through multiple stages, the removal of water and impurities leads to a decrease in viscosity, signifying an increase in product purity. The optimal fermentation and distillation conditions yield bioethanol with viscosity values close to those of pure ethanol, reflecting high product quality [45, 46, 47].
Viscosity of the samples.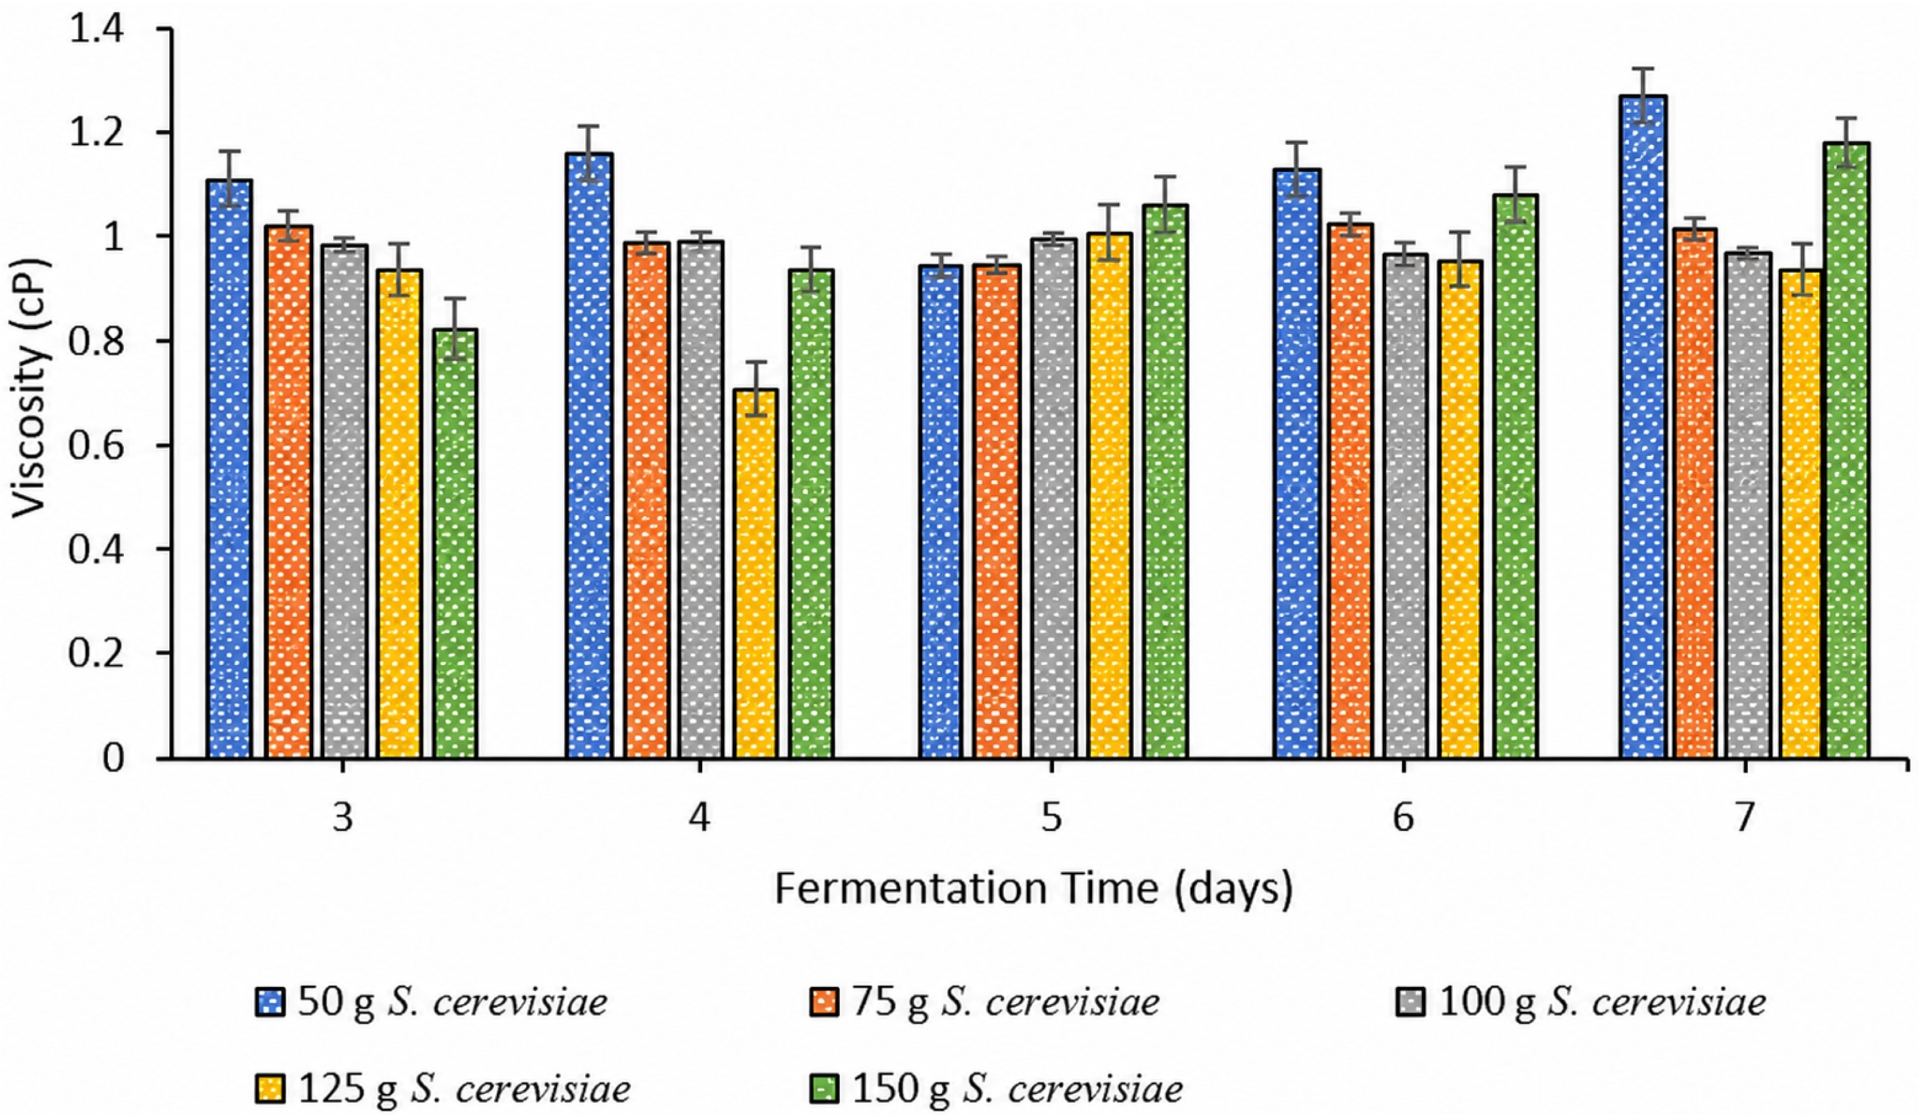
In the context of multi-stage distillation, the principal aim was to progressively eliminate water and residual contaminants, thereby achieving a reduction in the viscosity and density of the final product. The results of this study demonstrated that the double-stage distillation process effectively enhanced ethanol purity, with viscosity values (1.12–1.27 cP) approaching pure ethanol (1.074 cP at 20 °C), surpassing prior single-stage efforts achieving only 94.6–95% purity and higher viscosities (∼1.4–1.6 cP implied) due to incomplete water removal [48]. However, samples at the higher viscosity range (e.g., 1.27 cP) likely retain residual water or fuel oils, unlike advanced multi-column systems reaching 99.9% purity with optimized reflux. This suggests further protocol optimization, such as molecular sieve integration, is warranted for fuel-grade specifications according to ASTM D4806 [49]. The practical implications of these findings are significant for both quality control and process optimization in bioethanol production. Monitoring viscosity in conjunction with density provides a comprehensive assessment of product quality after distillation [50, 51]. Consistently low viscosity values across samples indicate successful removal of impurities and suitability for use as a fuel [52]. Conversely, if viscosity remains above the typical range for pure ethanol, further refinement of the distillation process—such as additional stages, improved column design, or integration of advanced separation technologies—may be warranted to achieve the desired product specifications.
3.3. The effect of experimental conditions on the bioethanol turbidity
Turbidity is a critical parameter in evaluating the quality and clarity of bioethanol, particularly following multi-stage distillation. Figure 4 shows the bioethanol turbidity of the samples. A marked difference in turbidity was observed between two samples with nearly the same ethanol concentration. The sample fermented for 3 days with 150 g Saccharomyces cerevisiae (98.63% purity) exhibited a turbidity of 137 NTU (very high), consistent with prior short-fermentation studies reporting >100 NTU due to incomplete fuel oil separation [53]. In contrast, the sample fermented for 7 days with 125 g Saccharomyces cerevisiae (98.74% purity) showed substantially lower turbidity of 18.5 NTU, aligning with extended fermentation benefits where yeast stress metabolism enhances volatile impurity volatilization, reducing haze [54]. This inverse time–yeast interaction surpasses typical 50–200 NTU ranges in coconut water ethanol studies limited to 3–4 days [55]. These impurities compromise fuel quality by promoting phase separation, gum formation, and corrosion in engines—exceeding ASTM D4806 limits (turbidity <5 NTU for fuel-grade ethanol). Extended fermentation enhances yeast stress metabolism, increasing fuel production and improving separation efficiency in distillation, thus linking process parameters directly to product stability [56, 57]. This discrepancy highlights that ethanol purity alone does not guarantee low turbidity or superior product clarity and underscores the importance of effective impurity removal during the distillation process.
Turbidity of the samples.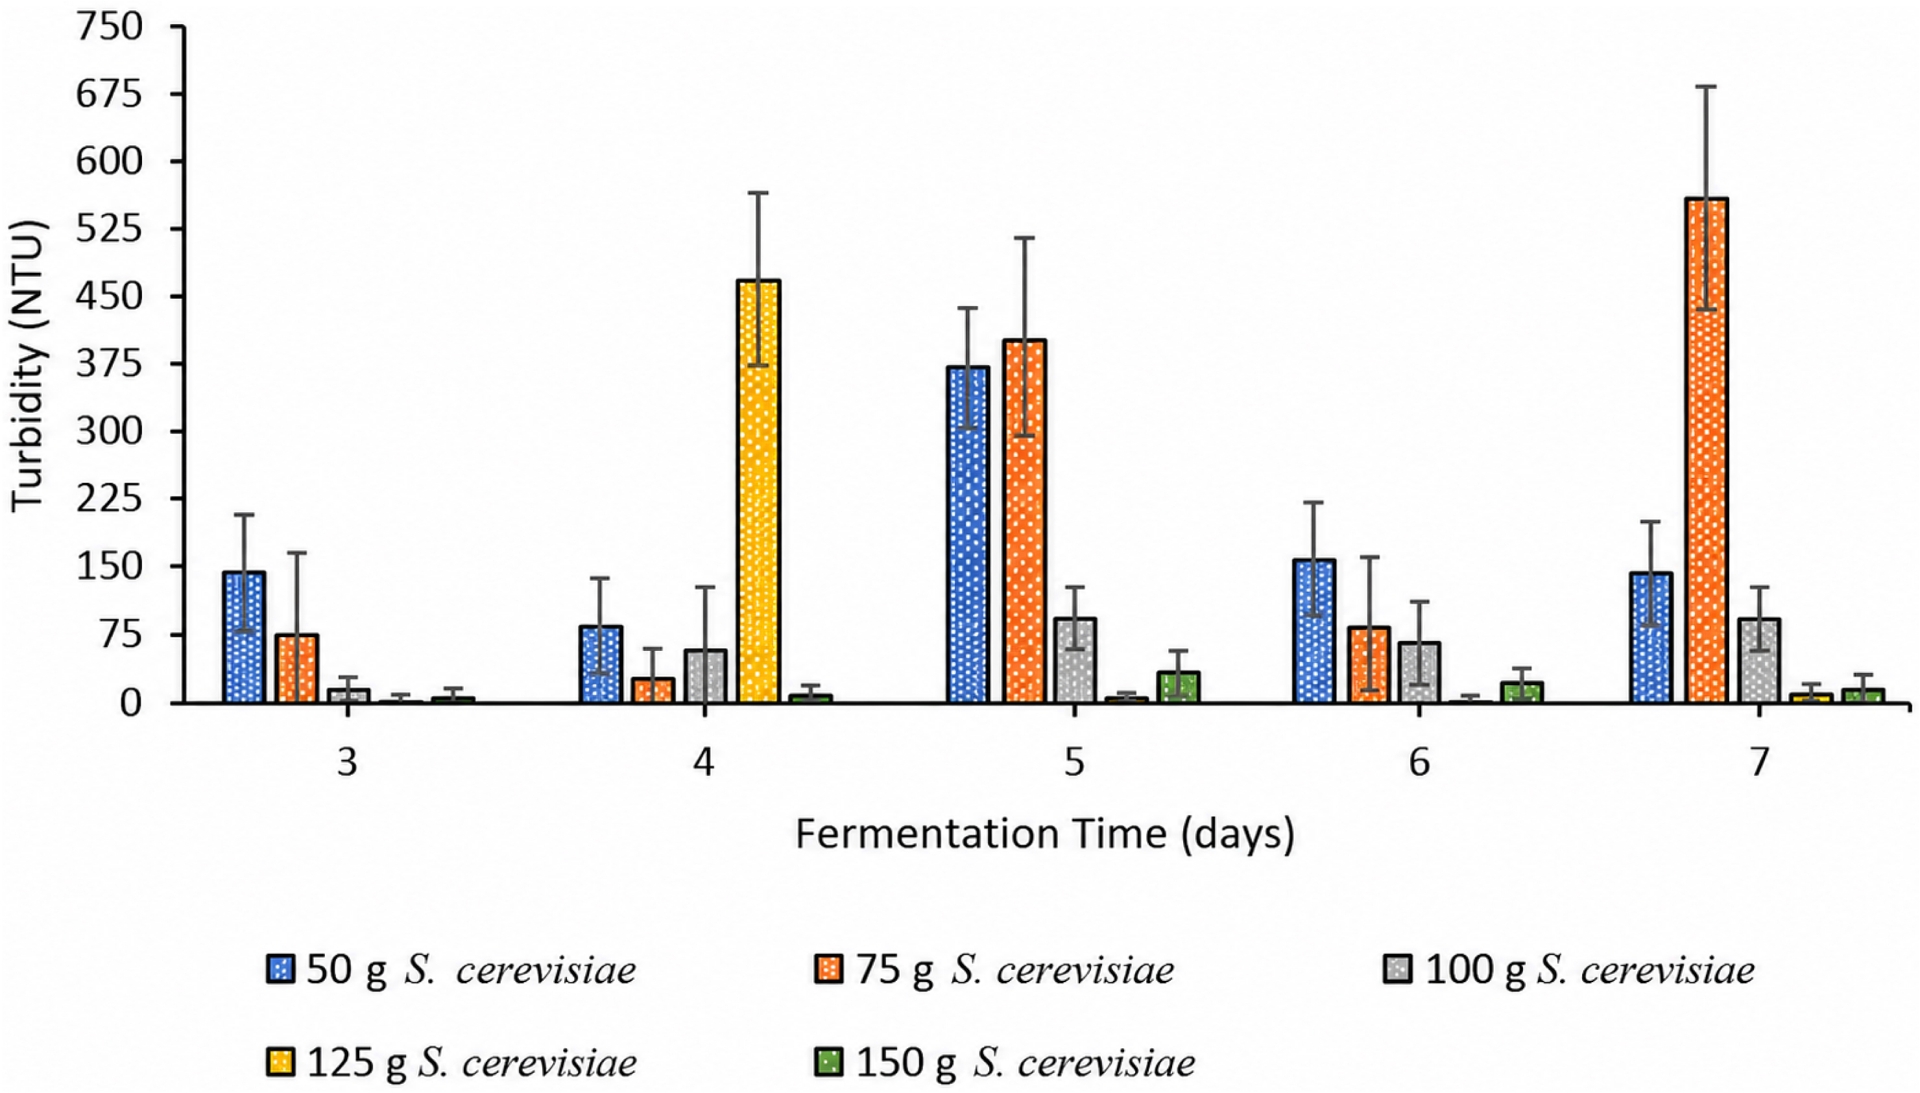
High turbidity in bioethanol is indicative of the presence of suspended solids, colloidal particles, and residual organic or inorganic impurities that were not fully eliminated during distillation [28, 58]. These particulates may include unreacted biomass, yeast cells, proteins, or other fermentation byproducts. An increase in turbidity may disrupt subsequent processing steps, and potentially alter its combustion characteristics when utilized as a fuel [59, 60]. In contrast, low turbidity indicates more effective removal of these impurities, resulting in a clearer and higher-quality bioethanol product [61, 62]. The consequence of turbidity on bioethanol quality was multifaceted. While high ethanol content is essential for fuel applications, the presence of suspended particles can lead to operational challenges, such as clogging of fuel injectors or reduced combustion efficiency. Therefore, achieving both high ethanol purity and low turbidity is crucial for producing bioethanol that meets industry standards for clarity and performance. Samples with high ethanol content could still exhibit elevated turbidity if separation and clarification steps were insufficient. Furthermore, low turbidity requires not only efficient distillation but also robust post-distillation treatment to remove residual particulates and colloidal matter. Turbidity alongside ethanol concentration provides a more comprehensive assessment of bioethanol quality and is essential for ensuring that the final product meets industry standards [63].
4. Conclusion
The density values remained considerably above the standard reference for pure ethanol. Moreover, viscosity and turbidity measurements serve as key parameters in evaluating the purity and quality of bioethanol following multi-stage distillation. The results of this study, with viscosity values ranging from 0.96 to 1.27 cP, suggest that the current distillation process was generally effective in producing high-purity bioethanol, although further optimization may be required for samples at the upper end of the viscosity range. Multi-stage distillation contributed to improved clarity and purity of the final bioethanol, meeting the standards required for fuel and industrial applications.
Acknowledgements
The authors would like to express our gratitude to the research team at State Polytechnic of Sriwijaya for funding the study under the Applied Research scheme with contract number 07011/PL6.2.1/LT/2025 dated June 26, 2025, and to the Department of Chemical Engineering for facilitating the venue and equipment needed during the research.
Declaration of interests
The authors do not work for, advise, own shares in, or receive funds from any organization that could benefit from this article, and have declared no affiliations other than their research organizations.