

Version française abrégée
La détermination de la nature et de l'âge des mobilités au sein des profils d'altération constitue une information importante pour retrouver les étapes de formation et d'évolution de ces profils, mais aussi pour retrouver, au sein des profils, les phénomènes actuellement actifs et qui contrôlent les flux chimiques transportés par les rivières des continents aux océans. Le problème de la datation des sols a été principalement abordé jusqu'à présent par l'étude des potentialités de chronomètres donnés [2,4,5,7,8,12,14,33,36]. Nous proposons ici d'illustrer une approche différente, qui consiste à combiner l'information portée par des traceurs géochimiques qui enregistrent les phénomènes d'altération sur des échelles de temps différentes. Plus précisément, il s'agit de présenter une synthèse des principaux résultats obtenus récemment en comparant les éléments en trace et les déséquilibres 238U234U230Th dans deux profils latéritiques de la toposéquence de Kaya au Burkina Faso [16–18]. Les éléments en trace intègrent l'ensemble des fractionnements géochimiques enregistrés pas les profils, alors que les déséquilibres de la série de l'238U (Fig. 1) donnent une information sur les fractionnements les plus récents. Cette comparaison permet de déterminer la mobilité récente au sein des profils et leur constante de temps.
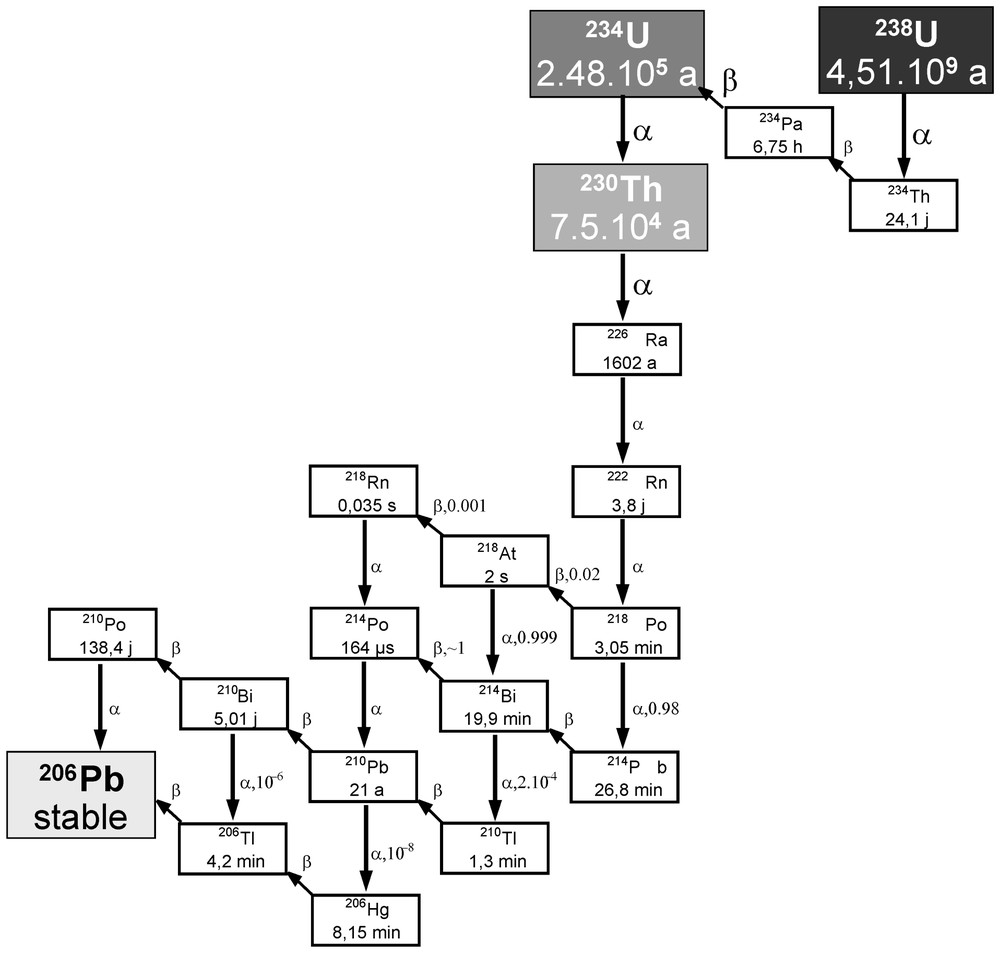
Presentation of the 238U radioactive series.
Présentation de la série de désintégration de l'238U.
La toposéquence de Kaya, développée sur un substratum granodioritique précambrien, a été étudiée en détail par Leprun [28]. Elle comporte trois sous-unités superposées (Fig. 2). La croûte ferrugineuse supérieure se serait formée directement au contact de la roche mère et correspondrait à un niveau d'accumulation issu du lessivage d'un niveau plus ancien [16,17,28]. Deux profils situés en positions topographiques contrastées, c'est-à-dire un profil amont (Kaya 1) et un profil aval (Kaya 5), ont été étudiés.
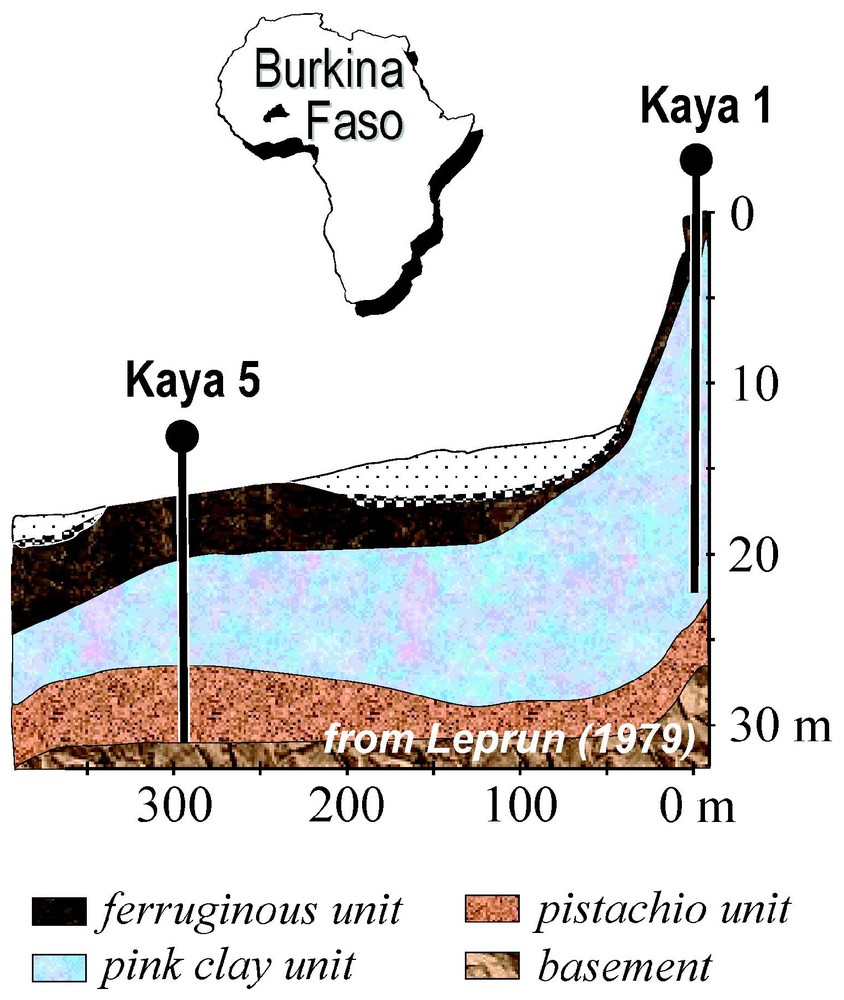
Sketch of the Kaya toposequence, with the three main lithological units.
Schéma de la toposéquence de Kaya, représentant les trois unités principales.
La variation des éléments en trace au sein de ces deux profils conduit à séparer les éléments en trois grands groupes (Fig. 3) : (1) les éléments solubles (i.e., Na, K, Mg, Ca) lessivés hors du profil lors de l'altération des minéraux parentaux, (2) les éléments enrichis dans la croûte ferrugineuse, c'est-à-dire Fe, V, Cr, Ce et Th, (3) les éléments comme les terres rares, Y, Ni, Co et Zn enrichis dans les unités intermédiaires des profils. L'uranium a un comportement intermédiaire, puisqu'il est enrichi dans la croûte ferrugineuse du profil aval, alors qu'il se trouve enrichi dans les parties intermédiaires du profil amont. L'ensemble des enrichissements dans les unités intermédiaires est lié à une redistribution verticale des éléments depuis la cuirasse où ils étaient antérieurement concentrés [17,18]. Les variations latérales, qui apparaissent lorsque l'on compare les deux profils étudiés, indiqueraient une redistribution chimique plus intense dans le profil amont que dans le profil aval, et seraient la conséquence d'une évolution minéralogique plus avancée dans le profil amont [18].
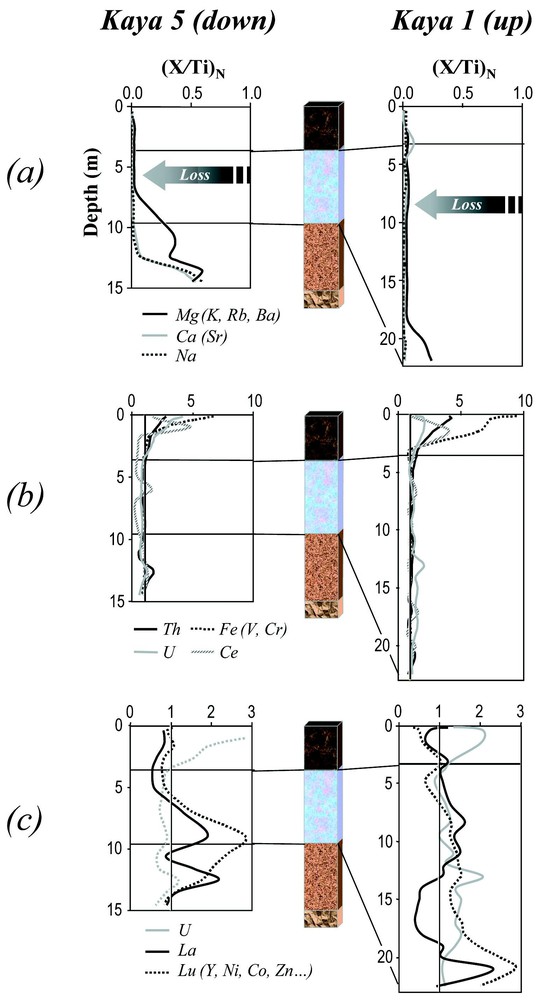
Chemical mobility of major and trace elements relative to Ti, normalized to the bedrock ((X/Ti)N=1 for the bedrock): (a) soluble cations, (b) elements enriched in the iron caps, (c) elements enriched in the lower units.
Mobilité chimique relative des éléments majeurs et des éléments en trace par rapport au Ti, normalisée à la roche mère ((X/Ti)N=1 pour la roche mère) : (a) cations solubles, (b) éléments enrichis dans la carapace ferrugineuse, (c) éléments enrichis dans les unités inférieures.
Les déséquilibres radioactifs mesurés dans les profils indiquent que l'ensemble du profil est affecté par des mobilités récentes d'uranium. La position des points de données dans les parties dites interdites du diagramme concordia (234U/238U)–(230Th/238U) (Fig. 4) implique que chaque niveau du profil est affecté par des pertes et des gains d'uranium. Un schéma de pertes et de gains continus en U a été développé [17] et utilisé pour définir l'âge des mobilités d'uranium au sein des profils (en préparation). L'approche chronométrique proposée, qui sera développée dans un papier compagnon, repose sur la comparaison des données dans le diagramme isochrone (230Th/232Th)–(238U/232Th) et le diagramme concordia (234U/238U)–(230Th/238U). La méthode consiste à définir les paramètres du modèle qui donnent des courbes d'évolution cohérentes dans les deux diagrammes (Fig. 5). Elle nécessite une estimation réaliste du rapport U/Th initial avant mobilisation, et fait appel à une méthode inverse de type Monte Carlo. On détermine par cette méthode, et les paramètres de mobilités d'uranium, et l'âge du début de sa mobilisation. L'application de cette approche au profil Kaya 1 donne un âge d'environ 400 ka pour le début du démantèlement de la cuirasse (Fig. 6) et des âges compris entre 0 ka et 400 ka pour l'accumulation de U dans les parties plus profondes du profil (Fig. 7). L'âge de 400 ka est cohérent avec l'âge de démantèlement de la cuirasse, alors que l'âge zéro indique que certains enrichissements dans les unités intermédiaires sont récents, voire sub-actuels. Les zones d'accumulation d'uranium dans les unités intermédiaires semblent varier au cours du temps, avec des constantes de temps proches de celles des variations climatiques (Fig. 7). Cette observation, si elle est confirmée par les études ultérieures, suggérerait une possible influence des cycles climatiques sur les processus d'altération. Elle indiquerait également que les processus actuels d'altération peuvent être différents des processus anciens enregistrés dans les profils.
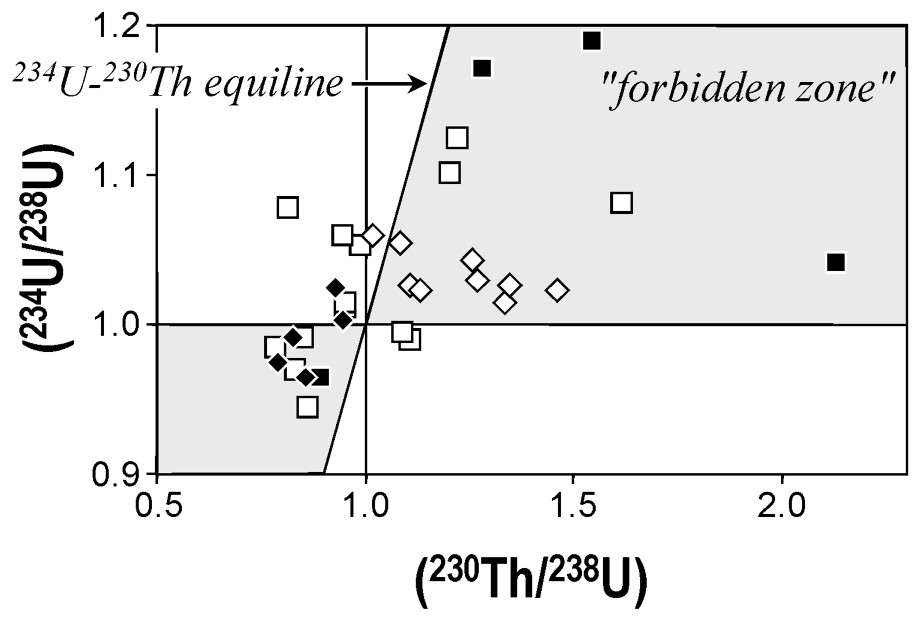
(234U/238U) vs. (230Th/238U) activity diagram. Diamonds for Kaya 5 whole rocks, squares for Kaya 1 whole rocks. Black symbols represent samples from the ferruginous units. Grey zones are the so-called ‘forbidden zone’ (see text).
Diagramme d'activité (234U/238U)–(230Th/238U). Losanges : roche totale de Kaya 5 ; carrés : roches totales de Kaya 1 ; symboles pleins : échantillons de la zone ferrugineuse. La zone grisée correspond au domaine dit « interdit » du diagramme d'activité (voir texte).
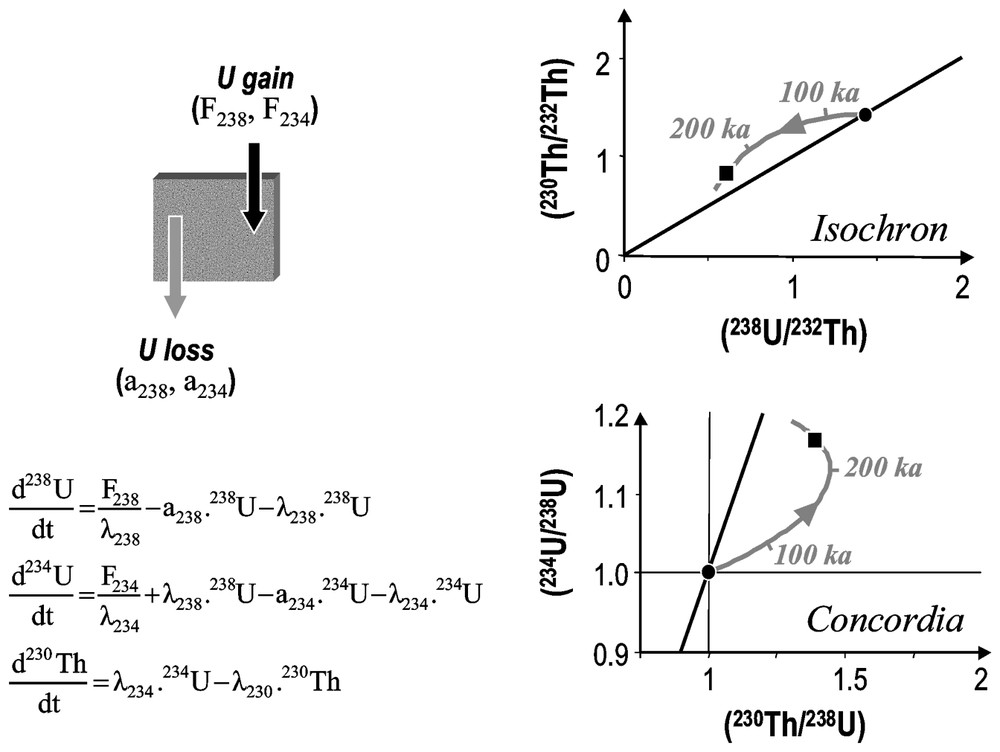
Left side: theoretical scheme retained for the interpretation of UTh disequilibria in the Kaya toposequence; each level of the toposequence is affected by continuous U gains and losses; Th is supposed to be an immobile element (F=uranium input flux in activity per time unit; a=time constant of U outputs; λ=radioactive decay constants). Right side: dating principle by comparison of time evolution curves for each data point in isochron and concordia diagrams; by assuming a system in secular equilibrium before U mobilisation and by choosing a realistic initial (230Th/232Th) ratio, a set of U mobilization parameters is retained in order to obtain consistent evolution curves and consistent dating in both diagrams. The age thus obtained corresponds to the age of the beginning of the U mobilisation. The method and the applications will be detailed in a companion paper.
Partie gauche : schéma théorique retenu pour l'interprétation des déséquilibres 238U234U230Th dans la toposéquence de Kaya ; chaque niveau de la toposéquence est marqué par des pertes et des gains continus d'uranium ; le thorium est supposé être un élément immobile dans ce schéma (F=flux d'apport d'uranium en activité par unité de temps ; a=constante de temps du flux d'export d'uranium ; λ=constante de désintégration radioactive). Partie droite : principe de datation par comparaison des courbes d'évolution de chaque point dans les diagrammes isochrone et concordia ; en supposant un système en équilibre séculaire avant mobilisation de l'uranium et en choisissant une valeur réaliste pour le rapport (230Th/232Th) initial du système, on détermine, pour le modèle de mobilisation de U retenu, un groupe de paramètres donnant des courbes d'évolution et des âges cohérents dans les deux diagrammes. L'âge ainsi obtenu correspond à celui du début de la mobilisation d'uranium. Le modèle et les applications seront détaillées dans un autre papier.
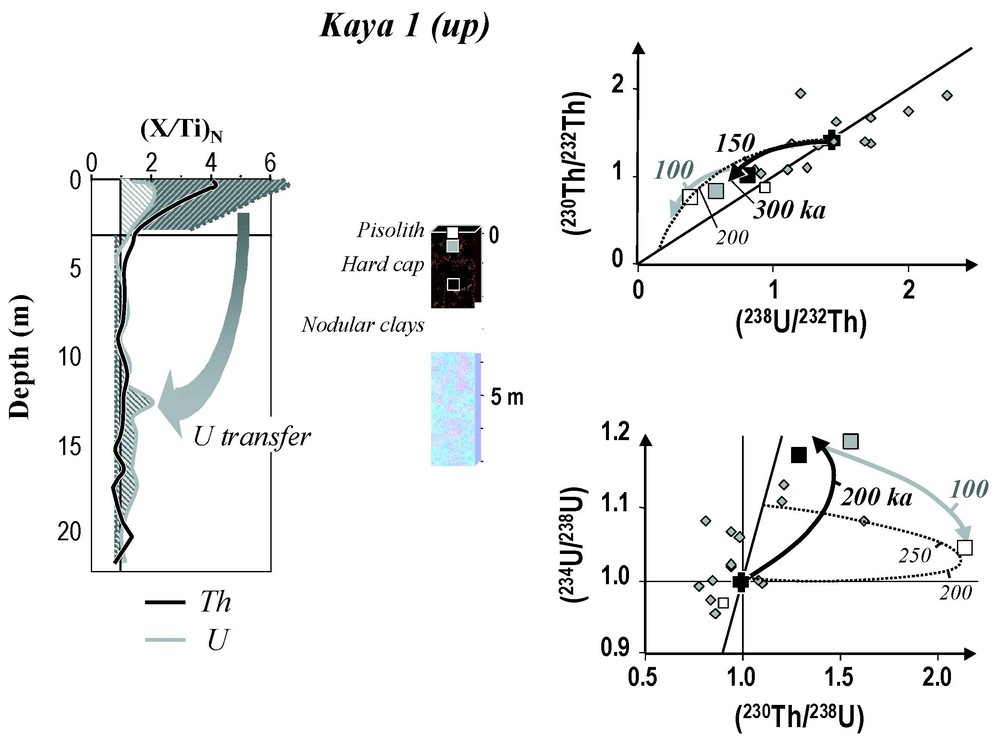
Age of the Kaya 1 iron-cap dismantling. Left side: estimation of the U vertical redistribution in the Kaya 1 profile, assuming similar U/Th ratios in both Kaya 1 and Kaya 5 iron crusts, Th immobility and no significant U redistribution in Kaya 5 (see text). Using the present mean UTh relative enrichments from both iron cap and pink clays of Kaya 5 and plotting them for Kaya 1 (dark grey dashed line), the mass balance of U loss in Kaya 1 relative to this reference is in good agreement with the relative U accumulation in the pink clays. Right side: dating of the Kaya 1 crust dismantling by considering Kaya 5 iron cap as a reference of the initial and undisturbed Kaya 1 cap. Ages of 250300 kyr are obtained for hard cap levels (black and grey points) using a one step scenario (black line) with the following parameters: initial (230Th/232Th) activity ratio of 1.43; 238U leaching intensity and its (238U/234U) activity ratio of 8×10⁻³ kyr−1 and 1.02, respectively; 238U inputs and its (234U/238U) ratio of 3×10⁻³ kyr−1 and 1.3, respectively. A similar age is obtained for the pisolithic sample (white point) in a one-step scenario (dotted line) with a 238U-leaching intensity and (234U/238U) activity ratio of 9×10⁻³ kyr−1 and 1.02, and a 238U input and an associated U activity ratio of 8×10⁻⁴ kyr−1 and 1.15, respectively. A consistent dating is also obtained for the pisolithic layer by assuming a two-step model: a first intermediate sample-like evolution (black line) and a late higher U release for the last 100 kyr (grey line).
Âge du démantèlement de la cuirasse de Kaya 1. Côté gauche : estimation de la redistribution verticale de U dans le profil Kaya 1, en supposant des rapports U/Th identiques pour les cuirasses de Kaya 1 et de Kaya 5, une immobilité du Th et une faible redistribution de U dans le profil Kaya 5. Côté droit : datation du démantèlement de la cuirasse de Kaya 1, en considérant la cuirasse de Kaya 5 comme référence à la cuirasse de Kaya 1, avant perturbation. Des âges de 250–300 ka sont obtenus pour les niveaux de la cuirasse indurée (points gris et noirs), en utilisant un scénario à une étape (ligne noire) et les paramètres suivants : rapport d'activité (230Th/232Th) initial de 1,43 ; intensité de lessivage de U et rapport d'activité de 8×10⁻³ ka−1 et 1,02, respectivement ; intensité d'apport de U et rapport d'activité de 3×10⁻³ ka−1 et 1,3. Un âge similaire est obtenu pour le niveau pisolithique (point blanc) dans un scénario à un stade (ligne pointillée) avec une intensité de lessivage de U et un rapport d'activité de 9×10⁻³ ka−1 et 1,02, respectivement, et une intensité d'apport de U et un rapport d'activité de 8×10⁻⁴ ka−1 et 1,15. Un âge cohérent est également obtenu pour le niveau pisolithique, en supposant un modèle à deux stades : une première évolution similaire à l'évolution des points plus profonds (courbe noire), puis une évolution avec une perte de U plus importante pour les 100 ka qui ont suivi (courbe grise).
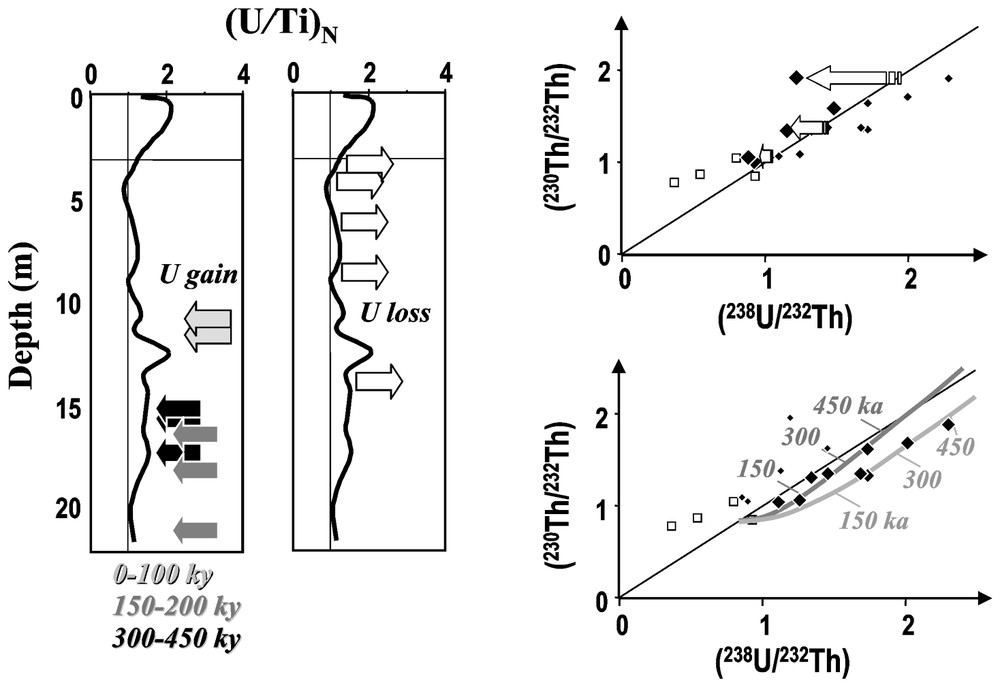
Kaya 1 pink-clay enrichment. Right side: interpretation of data points by a similar approach as in Fig. 6 gives age estimates between 0 and 400 kyr for U enrichments, and outline the existence of present-day U leaching in levels of Kaya 1 that were previously enriched in U (as underlined by the still high Th activity ratios). Left side: depth distribution of U enrichment ages; three accumulation zones marked by different ages can be defined. The white arrows represent the levels where UTh disequilibria indicate recent U leaching.
Enrichissement en U du niveau bariolé de Kaya 1. Partie de droite : l'interprétation des points de données par une approche similaire à celle présentée dans la Fig. 6 conduit à des âges de 0 à 400 ka pour l'enrichissement en U du niveau bariolé de Kaya 1 et souligne l'existence de lessivage actuel en U dans des niveaux qui ont été enrichis auparavant en U (ce qu'indiquent des rapports d'activité de Th élevés). Partie de gauche : distribution des âges d'enrichissement en U en fonction de la profondeur. Trois zones d'accumulation, d'âges différents, peuvent être définies. Les flèches blanches représentent les niveaux de la zone d'argiles bariolées dont les déséquilibres radioactifs indiquent une perte récente en uranium.
1 Introduction
Determination and dating of geochemical fractionations in weathering profiles represent key information in Earth's sciences, which has immediate consequences on the problem of the formation and evolution of weathering profiles and the still debated question of soil age. Such information is also very helpful for recovering the exact place of continental weathering in global geochemical cycles, especially by the determination of the processes presently active in weathering profiles, which control the chemical fluxes carried by rivers from continents to the ocean. In other words, such knowledge is central for a correct use of the chemical analysis of dissolved and particulate loads of rivers to estimate weathering budgets at watershed scale.
Until now the question of soil dating has mainly been approached by the study of weathering profiles of a given chronometer in order to evaluate its chronometrical potential. This can be illustrated by studies involving KAr or 40Ar39Ar methods (e.g., [44] and references therein), 87Rb87Sr chronometer (in [14]), cosmogenic nuclides (e.g., [2,4,12]) or UTh radioactive series (e.g., [5,8,33,36]). Only a few studies have attempted to couple multiple chronometers. Yet, coupling geochemical tracers that recorded weathering processes on different time scales constitutes a powerful approach to determine and date the sequence of geochemical fractionations affecting weathering profiles. Here we propose to illustrate the interest of such an approach by presenting a synthesis of recent studies on the comparison of trace elements and 238U234U230Th nuclides analysed in lateritic profiles from the Kaya toposequence in Burkina-Faso [16–18]. Trace elements integrate the whole chemical fractionation of the weathering profiles, whereas nuclides of radioactive series only focus on the most recent processes (i.e., processes younger than 106 yr). This comparison, thus, allows determination of the recent mobility processes and their time constant.
2 238U234U230Th radioactive disequilibria and study of the weathering processes
The capacity of the 238U234U230Th radioactive disequilibria to record recent geochemical fractionations is a consequence of the function of the radioactive decay series. As with all the natural UTh series, the 238U series begins with a very long half-life nuclide that decays to a lead isotope through a succession of radionuclides of much shorter half-lives (Fig. 1). As a consequence, after a closed system evolution of about 106 yr, the series reaches a state of secular equilibrium in which all the nuclides have the same activity. Each process perturbing such a state through chemical or isotope fractionation creates a radioactive disequilibrium. This is a transitory state that returns to secular equilibrium by the effect of radioactive decay. The return to secular equilibrium depends on the radioactive period of the perturbed nuclide and is faster the shorter the half-life. Thus, with a radioactive period of 248 kyr for 234U, radioactive disequilibrium between 238U234U will disappear in about 1 or 1.2 Myr, whereas, with a period of 75 kyr for 230Th, 234U230Th disequilibrium will disappear in about 300–375 kyr. The dual property of the radioactive disequilibria to be created by geological processes and to disappear on short time periods explains the unique role of the radioactive nuclides for studying and dating recent Quaternary phenomena. The range of application of these tracers is considerable and concerns many domains of the Earth sciences (see, [6,22]).
Weathering and more generally water–rock interactions fractionate the 238U234U230Th nuclides and create 238U234U230Th disequilibria in soils and weathering profiles. This results from the fact that U and Th (i) can be carried by different mineralogical phases, which behave differently relative to weathering (e.g., [30,34,41]), and (ii) have very contrasted geochemical behaviour in solution [25,26] (see also references in [13]). The potential of these disequilibria for studying the nature, intensity, and also time constant of weathering has been recognised since the 1960s [21,38,40]. A recent review of these studies is given by [13]. The studies followed two main directions. The first involved dating of pedogenic concretions through the use of the 234U230Th chronometer (e.g., [23]), with promising progresses linked to new techniques of mass-spectrometry measurement (e.g., [31]). The second one concerned study of the depth variations of 238U234U230Th disequilibria in weathering profiles and soils for determining the progression rate of the weathering front (e.g., [5,33]). These latter studies impose as a prerequisite to recognise the exact origin of UTh fractionations in the weathering profiles. Comparison of 238U234U230Th disequilibria with trace-element data largely contributes to understand this point, as will be illustrated with the study of the Kaya toposequence in Burkina Faso.
3 Presentation of the Kaya toposequence
The Kaya toposequence is composed of lateritic profiles developed on an old Birrimian granodiorite basement (∼2.1 Gyr from [1]). A detailed mineralogical and petrological study was conducted by Leprun [28], who divided the toposequence into three main horizontal units (Fig. 1). The lowest, named the pistachio unit, contains kaolinite and smectite as secondary minerals with a significant amount of minerals inherited from bedrock. The intermediate unit, named the pink clay unit, consists of secondary kaolinite and goethite, whereas the uppermost unit is highly enriched in iron oxides (goethite and hematite) and forms a ferruginous duricrust. Several scenarios have been proposed in the past for duricrust formation (i.e. references in [3,11,42]). The uppermost ferruginous duricrust of the Kaya toposequence is considered to be a level directly formed in contact with the bedrock and resulting in an accumulation level issued from the leaching of an older overlying horizon [3,17].
Major and trace elements and 238U234U230Th disequilibria have been analysed in whole rock samples from two pits of the toposequence located in very contrasted topographical position. The first one, called the Kaya 1 pit or the uphill profile, occurs on the top of a residual hill. The second one, the Kaya 5 pit or the downhill profile, is located in a lower topographical position (Fig. 2). Details of the analytical techniques can be found elsewhere (e.g., [17,39]).
4 Chemical fractionation in Kaya toposequence
The geochemical study performed on these two pits leads to a characterisation of the main chemical mobilisations within the profiles and of their lateral variability. The chemical mobility within weathering profiles, especially in lateritic systems, is a still debated question (e.g., [37,43]). It can be quantified by using classical approaches such as the isovolume or isoelementary approaches. The isovolume approach, popularised by Millot and Bonifas [35], relies on and is often justified by the observation that part of the weathering profiles evolved without global volume modification. Such hypotheses could be applied for the lower part of the Kaya profile [27,29]. In this case, as is made for the Kaya toposequence in [16], the comparison of density and chemical concentration between the rock samples and the bedrock allows a quantification of the inputs and losses of the elemental mobility within the different levels of a weathering profile in an isovolume evolution. However, this approach is too rough for studying the chemical mobility in the iron crust, where compaction figures have been reported [28]. Quantification of chemical mobility has to be made by using an isoelemental approach. In such an approach, it is assumed that during weathering, at least one element remains totally immobile, and therefore can be used as a reference for studying the mobility of the other elements [9,10]. The main question, still debated, is to know whether a real immobile element exists or not (e.g., [15,24,32]). It seems obvious today that the more or less immobile character of elements depends on the weathering context. It can be variable from one toposequence to another and, within a toposequence, from one part of the profile to another. The Kaya lateritic toposequence gives a good illustration of this latter point [18], as some elements seem to be immobile in the uphill profiles (i.e., retained in the iron crust), whereas downhill they are redistributed in the lower parts of the profile. For a Hawaii chronosequence, Kurz et al. [24] showed that Nb is the least mobile element. For the Kaya toposequence, comparison of depth variations of sample density with variations of elemental concentrations [16] suggests that Ti is a very poorly mobile element, and can therefore be used as a reference for estimating the mobility of the other elements. Using this approach, three groups of elements are defined (Fig. 3). The first one consists in the very soluble elements (i.e., Na, K, Mg, Ca), which are lost in the lower part of the profile. This chemical loss is associated with the progressive disappearance of primary minerals of the bedrock, in the lower part of the profile [17]. The second chemical group is composed of elements enriched in the ferruginous duricrust. It includes Fe, V, Cr, Ce, and Th. In addition to these two main groups, a third one consists of immobile elements enriched in the intermediary units, which includes the rare earth elements (REE), Y, Ni, Co and Zn for both studied pits. Compared to this subdivision, U has an intermediate behaviour, since it is enriched in the iron cap of the downhill profile, like Ce and Th, whereas it is enriched in the intermediate units of the uphill profile. The chemical enrichments in the intermediate units of the Kaya profiles can be interpreted in terms of a vertical redistribution of elements from ferruginous cap, where they were initially concentrated, to the lower parts of the profiles [17]. This interpretation is consistent with the REE pattern marked by a positive Ce anomaly in the REE-depleted ferruginous cap and a negative one in the intermediary unit, enriched in REE (see [17,18]). These results therefore suggest that the downward vertical redistribution occurring from the iron cap to the lower horizons of the Kaya toposequence is an important process for the control of mobility of elements, such as the transition metals, REE and U in the uphill profile.
In the detail, however, the two profiles show differences in redistribution processes, especially for U, which is much more redistributed in the uphill profile than in the downhill one. Differences in the La/Lu ratios between the two profiles are also observed. These differences are explained by a higher chemical redistribution in the uphill profile than in the downhill one. This is detailed in Dequincey et al. [18], who explain the lateral geochemical variations in the Kaya toposequence by a more advanced mineralogical evolution of the uppermost horizons in the uphill profile than in the downhill one, and who relate these variations by laterally variable drainage conditions.
5 Radioactive disequilibrium in the Kaya toposequence
As the U budget in the Kaya toposequence is highly affected by the vertical chemical transfers related to the iron-cap dismantling, 238U234U230Th disequilibria can help determine the nature and the age of this process. For the study of the Kaya toposequence, U and Th isotope ratios have been measured by TIMS [18]. Compared to the traditional radioactive counting methods, TIMS techniques improve the analytical precision by nearly one order of magnitude and reduce in the same proportions the sample size required for the analysis (e.g., [20]). This improvement allows a precise measurement of the small variations of UTh activity ratios in soil samples, and therefore the analysis and the comparison of two chronometers, namely 238U234U and 234U230Th, applicable on time scales that overlap. This was not possible in previous studies using alpha counting techniques for the measurement of U and Th isotopes [5,19,33]. Such a comparison brings new constrains for the choice of an interpretation model of U-disequilibria in soils, and for age determination of chemical mobilization within weathering profiles.
6 Choice of an interpretation model
During water–rock interactions associated with weathering processes, 234U is more mobile than 238U and U nuclides more mobile than 230Th. Therefore, weathering fluids as well as minerals newly formed from these fluids should develop complementary 238U234U230Th disequilibria with respect to residual minerals: (234U/238U)>1 and (230Th/238U)<1 in weathering fluids and newly formed minerals, and (234U/238U)<1 and (230Th/238U)>1 in residual materials. As a consequence, a system initially at secular equilibrium and suffering only gains or losses of U relative to Th, should plot in the quadrants of the 234U/238U230Th/238U diagram, where both disequilibria are opposite: the accumulation quadrant with (234U/238U)>1 and (230Th/238U)<1 and the leaching quadrant with reverse disequilibrium (see also [13] and references therein). No data points should plot in the two other quadrants, aptly named the forbidden zones. However, most of the Kaya samples plot in the forbidden zones (Fig. 4). Such a position implies that the data cannot reflect the evolution of a system previously at secular equilibrium, in which U would simply have been leached in some parts and redeposited in others. As discussed in Dequincey et al. [17], such a pattern implies that both U gains and losses affect each level of the toposequence. The choice of a realistic scenario to model this dual process will be discussed elsewhere. Let us notice, here, that a scenario of two distinct successive events, i.e., an initial U accumulation into the ferruginous cap followed by a further U leaching with successive U gains and losses would lead to unrealistic young ages for the formation of the ferruginous duricrust (in preparation). Scenarios with a more complex U mobilisation scheme have therefore to be involved; a limit case, in which both U input and output are continuous processes affecting an old laterite, has been proposed for the Kaya toposequence. The mathematical drawing-up of this model is given in Dequincey et al. [17]. This model accounts for the position of the data points in all parts of the UTh diagram. It depends on four parameters: the intensities of the 238U gain and loss and the 234U238U fractionation for each mobilisation processes. The application of such a scenario to the Kaya toposequence leads to a coherence with the U/Th elemental data, as it agrees with the conclusion that the uphill profile is more intensively leached than the downhill one (in preparation). It is therefore used to constrain the age or the time scale of recent U mobility within this profile.
7 Dating concept and application to the Kaya toposequence
The method developed to constrain the time constant of recent U mobility associated to dismantling of the iron cap relies on the comparison of the data points in both the ‘isochron’, (230Th/232Th) vs. (238U/232Th) diagram, and the ‘concordia’ (234U/238U) vs. (230Th/238U) diagram. This method will be presented in a companion paper (in prep.). Here, its principle and the main conclusions deducted for the Kaya profile will be summarised.
The method consists in finding, for a given data point, a set of mobility parameters that provide the same age in the two above diagrams. This means, in turn, to find consistent time-evolution curves in the two diagrams (Fig. 5). This method obviously requires us to define the UTh value of the parent material before U mobilisation. Determination of the evolution curves, which are entirely defined by a set of mobility parameters, relies on a Monte Carlo statistical approach. It consists to propose an a priori set of mobility parameters and to recover among these parameters those, which give consistent ages in the two diagrams. The choice of the a priori parameters as well as of the initial values of the parental material before mobilisation relies on some simple considerations concerning trace elements in Kaya 1 and in Kaya 5.
Trace element data indicate important differences in the chemical distribution between the uphill (Kaya 1) and the downhill (Kaya 5) pits. These differences relate to a more advanced evolution degree in the uphill profile (see Dequincey et al., [18]). By assuming similar initial U/Th ratios before vertical redistribution in both profiles, and by considering a quite limited U redistribution in the Kaya 5 profile, a fair coherence appears, at the scale of the Kaya 1 pit, between the U loss in the iron cap and the U accumulation in the lower horizons (Fig. 6). This observation has two main consequences: (i) the part of the Kaya 1 profile studied here is sufficient to record the vertical U redistribution of this profile, and (ii) the Kaya 5 profile can be used as a reference of Kaya 1 before U redistribution. In other words, the mean U/Th ratio of Kaya 5 iron cap can be used as the initial value of the U/Th ratio of the Kaya 1 iron cap. In these conditions, a U mass balance budget performed at the scale of the Kaya 1 profile shows that nearly 50% of the initial U retained in the iron cap of the profile has been redistributed downward. This observation allows us to propose a reasonable range of a priori values for the a coefficients of the model, that is, for the U leaching and input coefficients. Similarly, the distribution of U activity ratios within the profile leads to a definition of the a priori range of the U activity ratios in the mobility fluids. With these different constrains, the age of the beginning of U mobilisation and the values of mobilisation parameters can be quite well constrained for the Kaya 1 profile. An age of 200–300 kyr is obtained for the beginning of the U mobilisation of the samples buried between 2 and 3 m (black curve in Fig. 6) and an age of 300–400 kyr for the upper pisolithic layer of the profile. The results therefore confirm that the Kaya ferruginous duricrust is not presently stable, and that cap dismantling began several hundreds of thousands years ago.
238U234U230Th disequilibria in the Kaya 1 pink clay unit is also interesting to constrain the age of the U enrichment linked to the iron-cap dismantling. Most of the data points of the pink clay unit plot to the right of the equiline in the isochron diagram (Fig. 7). Such a distribution implies that these samples were recently enriched in uranium. The data points can be surrounded by two limit time evolution curves, drawn from (238U/232Th)(230Th/232Th) initial ratios close to the UTh values of the Kaya 5 pink clay unit, which is supposed to be not significantly enriched in U as compared to the Kaya 1 pink clay unit. The curves are age graduated, and the position of the data points in the isochron diagram relative to these curves provides a first indication on the age of the beginning of the U enrichment in the different samples. The enrichment ages obtained in this case range, from 0 to about 400 kyr. The high value of 400 kyr is consistent with the age of the iron crust dismantling, whereas the ‘zero’ age would indicate that some U enrichments in the pistachio unit are recent, even sub-actual. In addition, the presence of some data points at the links of the equiline in the isochron diagram indicates that in this part of the profile, which is considered on the basis of trace elements, as an U enrichment zone, some levels could have recently lost part of their U (Fig. 7). A simple way to interpret these characteristics is to admit that the accumulation/loss levels in the pink clay of the Kaya 1 profile, or which is equivalent, that the uranium mobility parameters of the interpretative model, varied with time. It is interesting to notice that the depth repartition of ages in the Kaya profile suggests that the time scale of U mobility variations is of the order of 100 kyr (Fig. 7), i.e., the same order of magnitude as the time scale of the Quaternary climatic variations. This observation is not a demonstration but certainly a first indication, that the Quaternary climatic variations could drive the variation of mobility parameters in weathering profiles. If confirmed in the future, this observation would imply a possible influence of climatic cycles on the chemical redistribution linked to iron-cap dismantling, and could make of the radioactive disequilibria, powerful tools to understand and quantify the impact of climatic variations on weathering processes. This observation also indicates that the present-day or recent weathering processes can be quite different from the old or long-term weathering processes recorded in weathering profiles.
8 Conclusions
The study of the Kaya toposequence highlights the interest of comparing geochemical tracers recording weathering processes on very contrasted time scales in order to recover the sequence of events occurring in weathering profiles. The comparison of trace element data with 238U234U230Th radioactive disequilibria enables us to evaluate the importance of recent geochemical fractionations in the evolution of weathering profiles. Thus, for the Kaya toposequence, the comparison underscores that the recent chemical mobility in the profile are mainly controlled by the iron-cap dismantling. In addition, comparison of geochemical data analysed in two pits of very contrasted topographical position, indicates that intensity of this dismantling depends (i) on the topographical position of the profile, and (ii) would vary with time, possibly in response to climatic variations. This result suggests that present-day or recent weathering processes that control the chemical fluxes carried by rivers, could be different from the old ones recorded by weathering profiles.
Acknowledgements
This work was supported by the French National Program, ‘GdR Métallogénie’ (CNRS/BRGM). We thank N. Vigier and J.-D. Meunier for their constructive comments and N. Banerjee for his suggestions and English corrections.