

Version française abrégée
La corrélation entre la structure crustale du rift de Corinthe et la micro-sismicité enregistrée dans sa partie occidentale fait encore aujourd'hui l'objet d'études. En particulier, certains débats restent ouverts, comme l'existence d'une faille normale à faible pendage ou d'une zone de détachement entre 5 et 10 km de profondeur [2,11,12], son origine et son rôle dans le contexte tectonique du rift [3] et sa relation avec les failles normales à fort pendage qui affleurent au nord du Péloponnèse [12,13].
Les techniques de tomographie sismique se sont révélées très utiles pour la connaissance du cadre structurale de la région [5,6]. Cependant, l'utilisation d'autres techniques, basées sur l'étude de phases sismiques converties [7,9,10,14], sont plus adaptées à l'identification de discontinuités sismiques comme, par exemple, des surfaces de faille.
Dans cet article, nous présentons une étude des ondes converties générées par des micro-séismes dans la région occidentale du golfe de Corinthe. Cette étude est fondée sur une stratégie d'analyse, similaire à la migration avant sommation, où des structures de petite longueur d'onde (discontinuités sismiques) sont identifiées en utilisant des modèles lisses en vitesse.
En 1991, une campagne de tomographie sismique a été réalisée dans la région située entre les villes de Patras et Aigion [6,12]. Environ 5000 micro-séismes ont été enregistrés sur 60 stations, pendant deux mois d'acquisition. Nous avons analysé 1260 formes d'onde enregistrées sur quatre stations à trois composantes. Ces stations sont situées dans la zone nord du golfe de Corinthe.
La stratégie suivie pour l'étude des phases converties peut être résumée en trois étapes. La première est l'estimation des modèles tridimensionnels de vitesse (P et S) et une localisation précise des séismes [5]. Ces modèles sont obtenus grâce à une tomographie des écarts des temps de première arrivée, basée sur l'inversion simultanée des paramètres de vitesse et localisation.
La deuxième étape est une correction des temps en fonction de la géométrie de l'interface. Une interface (discontinuité sismique) est défini « a priori ». Cette interface est paramétrée par une grille fine obtenue avec une interpolation 2-D b-spline. Les fronts d'onde des temps de première arrivée P et S sont calculés dans les modèles tomographiques pour chaque séisme et chaque station [8]. Pour une phase convertie donnée, on effectue une recherche des points d'impact sur l'interface (points de réflexion ou transmission des ondes converties). Ensuite, à partir de ces points, on applique un tracé de rais « a posteriori » [8] et un calcul des temps d'arrivée de l'onde convertie pour chaque couple séisme-station (Fig. 2). Les temps d'arrivée sont utilisés pour corriger en temps les sismogrammes, de façon à ce que le temps corrigé de la phase convertie soit nul si le modèle est exact.
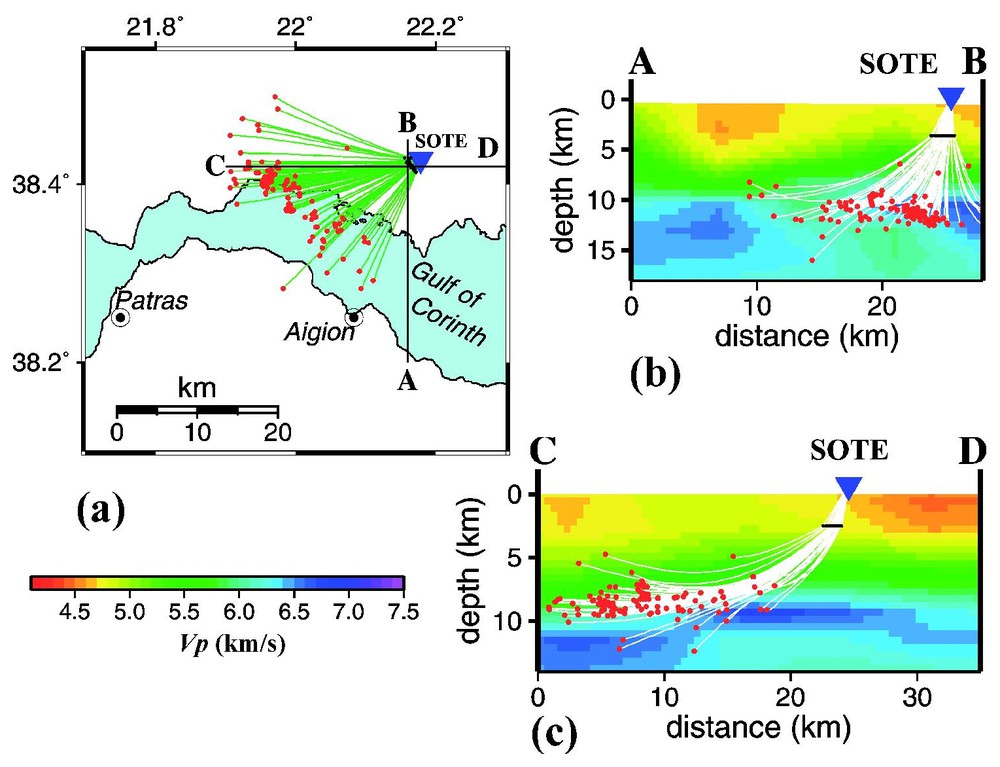
(a) Ray paths (green segments) of a PS transmitted phase computed for an interface lying at a depth of 3 km and earthquakes (red dots) recorded at the SOTE station (inversed triangles). The PS transmitted conversion points (dark dots) allow mapping the position of the interface. (b) North–south section of the 3-D P-velocity model used as background model for the converted phase investigation. For the PS-transmitted phase analysis, the upper part of the model (above the interface) is considered, while the S velocity model is used for computation in the lower part (beneath the interface). White segments are the projection of ray paths on the section. (c) East–west section of the same model.
(a) Trajet des rais (segments verts) d'une phase PS transmise, associée à une interface se trouvant à 3 km de profondeur. Position des séismes (points rouges) enregistrés à la station SOTE (triangle inversé). Les points de conversion de la phase PS transmise (points noirs) nous permettent de positionner l'interface dans l'espace. (b) Section nord–sud du modèle de vitesse tridimensionnel utilisé comme modèle de base pour la recherche des phases converties. Pour l'analyse de la phase PS transmise, nous avons considéré la partie supérieure du modèle P (au-dessus de l'interface), tandis que le modèle de vitesse S est utilisé pour le calcul dans la partie inférieure (au-dessous de l'interface). Les segments blancs représentent la projection des trajets des rais sur la section. (c) Section est–ouest du même modèle.
La troisième étape consiste à utiliser une technique classique de sommation des énergies des sismogrammes après correction des temps. La présence sur les sismogrammes de la phase convertie analysée (et donc l'interprétation de l'interface associée) doit être confirmée en analysant la focalisation de l'énergie sur la sommation.
Afin d'identifier les interfaces associées aux différentes phases converties, la correction des temps et la sommation des sismogrammes sont répétées pour divers types d'interfaces, en suivant une procédure du type essai-erreur. Puisque, dans la présente analyse, l'illumination des interfaces est principalement locale (Fig. 2), nous avons choisi de représenter les interfaces selon la géométrie la plus simple à petite échelle (segments d'interfaces horizontaux). De cette manière, nous avons suivi une recherche systématique de la meilleure profondeur des segments d'interfaces qui focalisent l'énergie convertie.
Afin d'appliquer la procédure décrite auparavant, les sismogrammes sont groupés par station et par position des séismes. Ces derniers sont divisés en quatre zones (Fig. 1). Chaque zone est étudiée séparément.
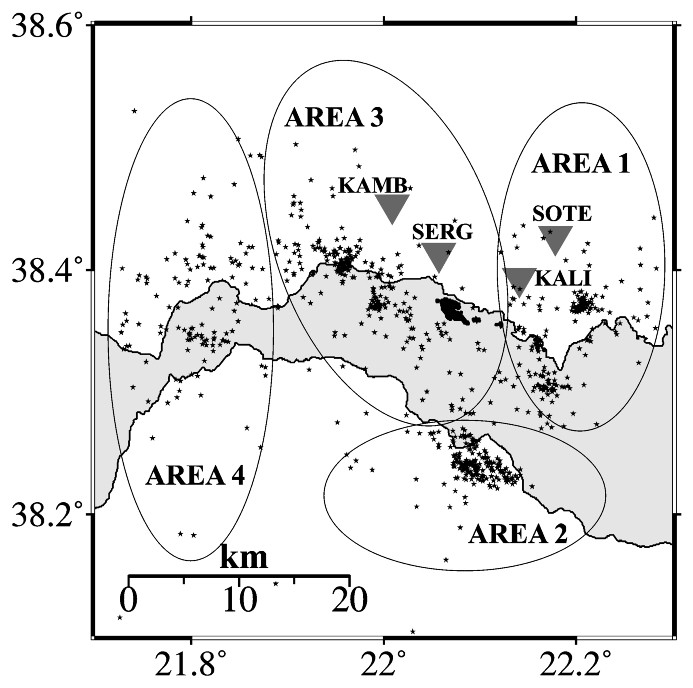
Distribution of stations (inversed triangles) and earthquakes (dots) used in this study. We have selected four main areas of earthquakes (areas 1, 2, 3, and 4). Seismograms associated with these main areas have been analysed separately.
Distribution des stations (triangles inversés) et des séismes (points) utilisés dans cette étude. Nous avons sélectionné quatre zones principales (zones 1, 2, 3 et 4). Les sismogrammes associés à ces zones ont été analysés séparément.
Trois phases converties ont été identifiées et nommées phase « A », « B » et « C » (Figs. 3(a) et 4(a)). Ces phases (Fig. 3(b)) sont mises en évidence grâce au produit des composantes [4,10].
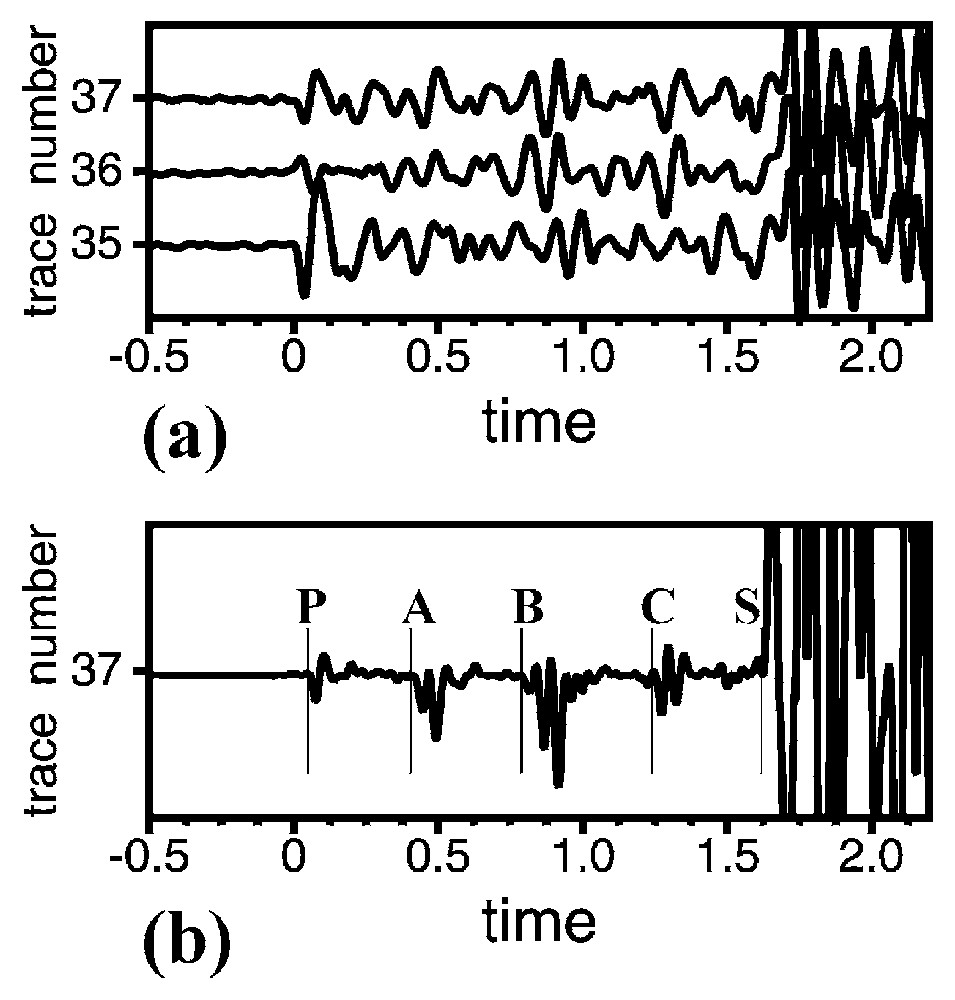
(a) Three vertical components of seismograms recorded at the KALI station for earthquakes located in the same zone (area 1). Although waveforms of the P-arrivals are rather different, three main phases can be observed on all seismograms between the P- and the S-arrivals. (b) Product of components RZ (trace 37): the visibility of the three main waves occurring between the P and the S arrivals is improved.
Trois composantes verticales de sismogrammes enregistrés à la station KALI pour des séismes localisés dans la même zone (zone 1). Bien que les formes d'ondes des arrivées de l'onde P soient assez différentes, trois phases principales peuvent être observées sur tous les sismogrammes entre les arrivées d'onde P et S. Produit des composantes RZ (trace 37) : la visibilité des trois ondes principales arrivantes entre les arrivées des ondes P et S est améliorée.
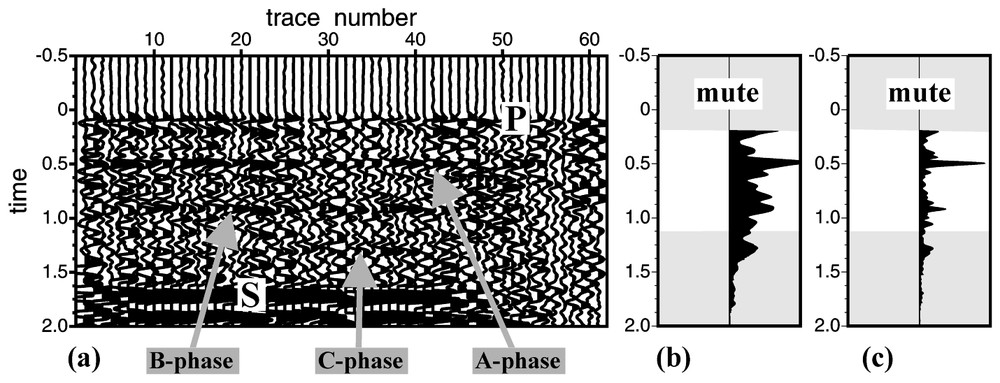
Seismograms recorded at the KALI station from earthquakes located in the area 1. (a) Row section of the radial component. Seismograms are shifted in time with respect to the observed P-arrivals. Traces are sorted by station-earthquake distance calculated along each P-ray path in the P-tomographic model. (b) Stack of the radial section after the muting of P- and S-arrivals. Energy associated to the A-phase is observed at about 0.5 s after the P-arrival. (c) Stack of the RZ product.
Sismogrammes enregistrés à la station KALI à partir des séismes localisés dans la zone 1. (a) Section sismique de la composante radiale. Les sismogrammes ont été décalés en temps pour les arrivées observées de l'onde P. Les traces sont ordonnées par la distance station-séisme calculée le long le trajet de rai de l'onde P dans le modèle tomographique. (b) Sommation de la section radiale après la suppression de l'énergie associée aux arrivées P et S. L'énergie associée à la phase « A » est observée à environ 0,5 s après l'arrivée de l'onde P. (c) Sommation du produit RZ.
La Fig. 4(a) montre un ensemble de sismogrammes, groupés en section avant correction des temps. Il s'agit de la composante radiale relative aux séismes localisés dans la zone 1 et enregistrés à la station KALI.
Les Fig. 4(b) et (c) montrent, respectivement, la sommation de la composante radiale et du produit des composantes radiale et verticale (RZ). La phase « A » est identifiée à 0,5 s de la première arrivée P (Fig. 4). Son énergie est presque complètement polarisée sur les composantes horizontales et elle peut être interprétée comme une phase convertie PS. Au contraire, les phases « B » et « C » montrent une énergie plus faible que la phase « A » et sont polarisées sur les deux composantes radiale et verticale. Sur la base de l'analyse de polarisation, l'interprétation des phases « B » et « C » est plus difficile que l'interprétation de la phase « A ».
Afin d'identifier la structure qui puisse expliquer la phase la plus importante (la phase « A »), nous avons effectué une correction des temps pour différentes interfaces. Cette analyse a été effectuée pour chaque station et chaque groupe de séismes. Les temps utilisés pour corriger la section montrée sur la Fig. 4(a), correspondent aux temps calculés pour une phase transmise PS sur une interface située à 3 km de profondeur (Fig. 5(a)). Si la correction est appropriée, la phase convertie PS doit être alignée autour du temps zéro. La qualité de l'alignement peut être qualifiée par la focalisation des énergies sur la sommation des sismogrammes (Fig. 5(b) et (c)).

Time move-out correction for seismograms showed in Fig. 4(a). (a) Move-out of seismograms by the theoretical time for the transmitted PS, which leads to stacking profile of the horizontal component (b) or the component product (c).
Correction des temps des sismogrammes de la Fig. 4(a). (a) Correction des sismogrammes pour le temps théorique de la phase PS transmise, qui permet d'obtenir une sommation de la composante horizontale (b) et de la composante produit (c).
Les résultats de l'analyse de la phase « A » sont résumés dans le Tableau 1 et sur la Fig. 6. Bien que l'on observe une certaine dispersion, on peut supposer l'existence d'une structure sub-horizontale située au nord de la péninsule de Psaromita (Fig. 6). La position des points d'impact de la phase convertie PS nous fournit un bon échantillonnage de l'interface sur une longueur d'environ 6 km, avec une précision de 2 km sur la profondeur.
Depth of the subhorizontal interface determined from stacks with uncertainty estimation from the spreading of the stack. The approximate horizontality of the interface is a posteriori verified
Profondeur de l'interface sub-horizontale déterminée par les sections sommées. La dispersion de la sommation nous permet d'obtenir une estimation de l'incertitude sur la profondeur. L'horizontalité approximative de l'interface est vérifiée a posteriori
| Earthquakes | Stations | |
| region | KALI | SOTE |
| Depth range (km) | ||
| AREA 1 | 2.5–3.0 | 2.0–3.0 |
| AREA 2 | 3.0–4.0 | 2.5–4.0 |
| AREA 3 | 2.5–3.0 | 2.5–3.5 |
| AREA 4 | no data | 3.5–4.5 |
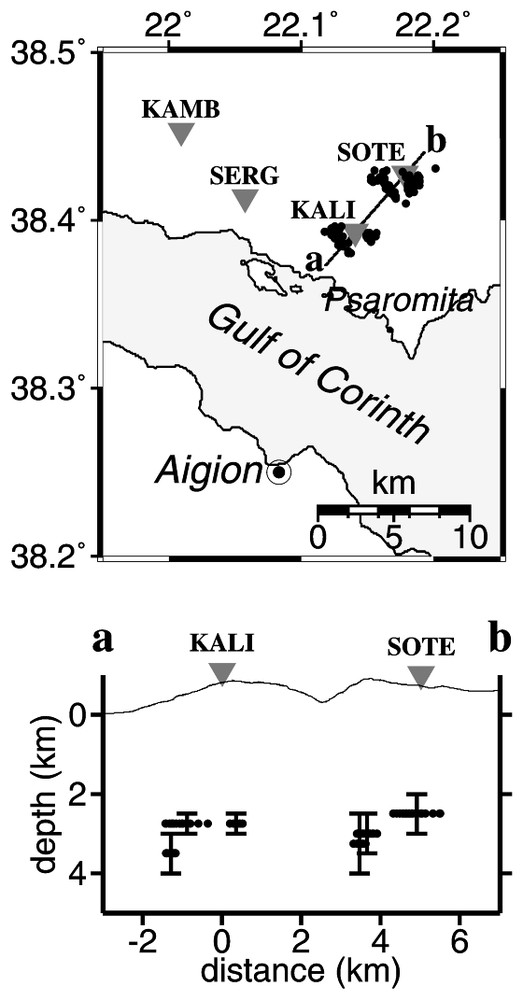
Spatial distribution (top) of all impact points (dark dots) identified after the analysis of the A-phase for the KALI and SOTE stations. The impact point depths for each area are represented with their associated error bar. Depth ranges for each station and earthquake area are reported in Table 1. All impact points are located between depths of 2 and 4 km.
Distribution spatiale (haut) de tous les points d'impact (points noirs) identifiés après l'analyse de la phase « A » pour les stations KALI et SOTE. La profondeur des points d'impact de chaque zone est représentée avec sa barre d'erreur correspondante. Les intervalles de profondeur à chaque station et pour chaque zone de séisme sont reportés dans le Tableau 1. Tous les points d'impact sont localisés entre 2 et 4 km de profondeur.
Les phases « B » et « C » correspondent probablement à d'autres interfaces. L'étude des temps d'arrivée semble indiquer que ces phases sont générées par des structures plus profondes que 5 km. L'étude future de ces phases et des structures associées pourrait apporter de nouvelles informations quant à la présence d'une zone de détachement entre 5 et 10 km dans la région occidentale du golfe de Corinthe.
1 Introduction
The Gulf of Corinth is one of the most active extensional zones of the Mediterranean region. It configures as an asymmetric half-graben and it is characterized by a set of normal faults that crop out on its southern side. Microseismic activity is very intense and distributed in a narrow zone dipping at low-angle northwards [6,11,12]. Rigo et al. [12] relate this microseismicity to an active low-angle detachment lying at a depth of 9–11 km. Recent studies of seismic activity in the western Gulf of Corinth [3] suggest that this deep microseismicity is more probably related to a brittle–ductile transition zone rather than to a subhorizontal detachment, as proposed by previous authors. On the contrary, the hypothesis of the active low-angle detachment is supported by both structural and sedimentological field observations [13]. Therefore, the relation between seismicity and crustal structures at depth is still an ongoing debated issue.
In this context, seismic tomography investigations may improve the understanding of the tectonic framework of this area. First-arrival time tomography inversion images smooth features of a studied region. For example, Le Meur et al. [6] obtained a P- and S-velocity structure of the western Gulf of Corinth by using a linearized tomographic technique. Nevertheless, tomographic techniques cannot discriminate the presence of small-scale discontinuities, as fault planes or other structural interfaces. On the contrary, the study of the seismic energy conversion at these particular impedance discontinuities allows mapping their geometry and position at depth.
So far, converted waves investigation from regional seismicity has been successfully performed for the detection of structural discontinuities at both lithospheric- (as in the case of subducted slab or the Moho discontinuity) [7,9,10] and crustal-scale [14].
In this paper, we investigate converted waves from local microearthquake records to improve the mid-crust image of western Gulf of Corinth. For such purpose, we follow a strategy similar to a pre-stack migration, in which short-wavelength features are detected after a velocity analysis where smooth variations are only considered. In this way, we may detect converted waves and, at the same time, bring interpretation. This strategy consists in three steps. The first step, which is not described in this paper, is the estimation of a smooth velocity background for both P- and S-waves and precise earthquake locations. The second step is a time move-out correction for specific converted waves at a possible sharp interface, which should be described beforehand. In the time move-out correction, travel-times of the studied converted waves are computed without modifying the smooth heterogeneous three-dimensional (3-D) velocity distribution. Finally, the third step performs a conventional stacking technique, usually presented in the time domain although the computation is performed in the depth domain. The existence of converted phases and the associated interface may be confirmed by the efficiency of the energy focusing.
2 Data
In 1991, a two-month passive tomographic experiment was carried out in the area located between the Patras and the Aigion towns [6,12]. More than 5000 microearthquakes have been recorded by a network of 60 short period stations distributed in a region of about 50×50 km2. From an initial database of 2260 well-located events consisting in about 17 000 P- and 12 700 S-first-arrival times, we have considered 1532 events having at least four P- and four S-pickings. Then, in order to compile our waveform database, we have selected 11 three-component stations and we have considered only those records having a good signal to noise ratio. So far, we have analysed about 1260 waveforms that have been recorded at four stations located in the northern part of the gulf (Fig. 1). We have chosen these stations because of both their high number of available waveforms and their particular location in the most active seismic zone of the area. In fact, as shown in Fig. 1, the microseismicity recorded during the experiment is mainly located in the northern Gulf of Corinth, with one exception to the south near the Aigion town. Therefore, in this study, we have concentrated our attention on seismograms recorded at the stations of KALI, SOTE, KAMB and SERG. These stations are also situated close to the area where the hypocenter of the 1995 Aigion earthquake has been located [2].
3 Data analysis
Transmitted converted phases are observed on seismograms between P and S direct arrivals (Fig. 3), whereas reflected converted waves can also occur after the S direct arrival. Converted energy is quite often weaker than P and S direct ones, as expected. Therefore, converted phases are usually hidden in the P and S coda. Moreover, PS and SP converted arrivals depend on both P and S velocity structures as well as earthquake locations and the geometry of the interface where the conversion occurs. Then, because converted phase analysis is strongly model-dependent, both their detection and interpretation turn out to be a difficult task.
For these reasons, we apply a trial and error procedure to detect converted phases in seismograms and, at the same time, to associate these phases to specific interfaces. In this procedure, an important step is the travel time computation of all kind of reflected and transmitted converted waves that occur at a given interface. The travel time computation is performed by using heterogeneous three dimensional velocity models.
We assume a cinematically coherent smooth medium for first-arrival times. Smooth 3-D P- and S-velocity models and earthquake locations have been previously obtained by inverting 12 121 P- and 9001 S-first-arrival time readings [5]. We used a minimum number of eight P- and four S-arrival time pickings for locating each earthquake. After the simultaneous inversion of P and S velocity models and earthquake hypocenter location, the final rms attained a value of 0.123 s, which corresponds to a misfit reduction of about 30%. The smooth 3-D P- and S-tomographic models (Fig. 2) are taken as background velocity models, while the earthquake distribution (Fig. 1) is kept fixed during our converted phases analysis.
Interfaces are parameterised by a fine grid obtained with a b-spline interpolation. This grid is independent on the background velocity grid and it can assume any complex form.
Both P and S times of first-arrival wavefronts are computed in the background velocity models from each station and from each earthquake by using the Podvin and Lecomte's algorithm [8]. Then, on the interface grid, we perform a search for all impact points where the Snell's law does apply. Finally, both a back-ray tracing and a travel-time calculation along the ray are performed in order to estimate theoretical travel-times of each converted phase at the given interface. As an illustration, Fig. 2 displays the result of the impact point investigation and back ray tracing for a PS transmitted phase at an interface located at a depth of 3 km beneath the SOTE station.
Let us underline that P and S velocity models, above and beneath the interface, are the smooth background heterogeneous three-dimensional models. For our present analysis, enlightening the interface is quite local. Therefore, we have chosen the simplest possible local geometry as a horizontal segment of the interface. We have searched for the best depth, which focuses the energy of possible converted phases. Improving velocity definition on both sides of the interface should be the next step of our investigation as done in seismic reflection tomography.
For each converted phase at a given interface, computed theoretical travel times are used to apply a time move-out (MO) correction on seismograms in order to align the converted energy nearby the zero time. The quality of the alignment on the MO section depends on both the chosen interface geometry and the background velocity models. By considering different interface depths, an alignment of converted phase in the MO section leads us to select the associated interface depth as a possible one. Because we consider either a PS- or a SP-wave arrival at the station, polarization analysis allows us to discriminate among different interpretations. Moreover, the selected interface has to be identified using different stations and earthquakes, although the folding of the acquisition geometry is rather poor. The alignment of coherent energy around the theoretical travel-time is estimated by applying a classical stacking technique. Appropriate data processing (as component rotation, seismogram envelope, component product and different mute types) may improve the stack. We repeat the time move-out correction and the stack for different interface depths looking after a better focusing of energy for the analysed converted phase.
In summary, this procedure essentially requires accurate P and S background velocity models, precise earthquake hypocenter locations in the background velocity structures, an efficient tool for converted reflected and transmitted travel-time computation for a pre-defined interface in the background velocity structure and a suitable data analysis for enhancing phases on seismograms. Both linearized tomographic inversion of P- and S-first-arrival times similar to the one proposed by [1,6] and systematic search for converted phases on an arbitrary interface as proposed here have been developed.
For our data analysis, we have selected seismic events located in a same area (Fig. 1). Then, seismograms associated to four main areas (areas 1, 2, 3, and 4) have been studied separately. This appropriate regional analysis allows us to identify converted phases that follow rather similar paths in the complex heterogeneous medium (Fig. 3).
Between the P- and S-arrival times, three major phases are detected (Figs. 3(a) and 4(a)) and denoted as phase A, B and C. Fig. 3(a) displays the vertical component of three seismograms recorded at the KALI station from earthquakes located in the area 1. In this figure, we can observe that these major converted phases are visible on all seismograms, although the waveforms of the P-arrival are rather different. In order to increase even more the signal-to-noise ratio and to enhance signal coherent on different components, we perform the products of components RZ (radial×vertical), TZ (transversal×vertical) and RT (radial×transversal), as proposed by Jacob et al. [4] and applied by Regnier et al. [10]. As an example, the product RZ of the trace 37 is displayed in Fig. 3(b) and the detected phases are indicated.
Fig. 4(a) displays radial component records of all earthquakes located in the area 1 (Fig. 1) and recorded at the KALI station. The ‘raw’ section showed in the figure allows us to present the data before performing the move-out analysis. This section is made by shifting in time each seismogram for the observed P-arrival time. Then, seismograms are sorted out by using the earthquake-receiver distance that has been previously computed along each P-ray path in the background velocity model. In order to improve the signal-to-noise ratio, data have been low-pass filtered at 10 Hz. The stack of the radial components is presented in Fig. 4(b), whereas the stack of the RZ product is shown in Fig. 4(c). The A-phase arrival occurs at about 0.5 s from the P-first arrival. The energy associated to this phase seams to be stronger on horizontal components than on vertical component. On the contrary, the B- and C-phases are weaker than the A-phase on the horizontal components and they are polarized on both the vertical and the radial components. Looking at the polarization analysis, a PS or a SP converted wave might provide similar polarization patterns, due to the trade-off between the ray incidence at the station and the wavetype. However, the fact that the polarization of the phase A is almost entirely dominated by the horizontal components allows us to interpret this phase as a PS-converted wave. This interpretation has been confirmed by the successive time move-out analyses.
Previous representations of the data (Figs. 3 and 4) pointed out the presence of some particular converted waves. In order to model the structure that can explain the most energetic of them (the A-phase), we have performed the time MO correction for interfaces lying at different depths.
By considering the seismograms displayed in Fig. 4(a), we have constructed a MO-corrected section using theoretical travel-times of a PS-transmitted phase computed for an interface located at a depth of 3 km (Fig. 5(a)). Moreover, a muting technique is applied to cancel energy of P- and S-arrivals and to enhance the converted arrivals.
If the MO correction is appropriate, the PS-converted phases are expected to be aligned around the time 0. To quantify the quality of the alignment, we apply a conventional stacking technique (Fig. 5(b) and (c)). In Fig. 5(c), we show the stack of the RZ MO section where we note a clear improvement of the stacking power compared to Fig. 5(b). This stack coming from depth analysis (Fig. 5(b) and (c)) is similar to the stack coming from first P-wave time shift (Fig. 4(b) and (c)). The energy focusing is still present and allows us to interpret the converted phase as a PS phase. Higher parameterisation of the smooth velocity and the interface geometry, and/or improved residual move-out, might increase the focusing. This is left to further analysis.
The same procedure previously illustrated has been applied on other area-station couples. Results are summarized in Table 1. We have performed this analysis on four stations: KALI, SOTE, KAMB and SERG. At the last two stations, no converted phases have been found for interfaces compatible with a depth shallower than 5 km. At the first two stations, KALI and SOTE, PS-converted phases have been identified for all the areas when seismograms exist in our database. For each couple station-area represented in Table 1, we report the interface-depth range that we have estimated through the stacking dispersion of the considered energetic pulse (Fig. 5). Although we observe dispersion in our analysis, the hypothesis of a global subhorizontal interface is supported by the quite narrow range of depths that we have found by considering different earthquakes groups at different stations (Fig. 6). The spreading of impact points makes a quite noticeable sampling of such interface over an estimated length of 6 km, with an estimated accuracy of 2 km, and leads us to propose a significant extension of the subhorizontal shape of this interface.
4 Conclusion
By analysing local earthquake records at four stations located in the northern Gulf of Corinth, we have shown that it is possible to perform a converted phase investigation in this area. By applying a regional selection of earthquakes, three major converted phases have been identified between the P and S arrival times. In this study, we have analysed the most energetic of these phases on the horizontal components (phase A). We have performed a search for different converted wavetypes at different interface depth by using three-dimensional P- and S-tomographic models. The observed phase (phase A) can be explained with an impedance contrast on a subhorizontal structure located at a depth of around 3 km in the northeastern part of the Psaromita Peninsula. Further investigations, as the modelling of converted travel-times for more complex interface shapes and the analysis of seismograms recorded at other stations could provide us with more precise information. Other data may also provide additional information on sharp interfaces below the Gulf of Corinth.
The two other phases (phase B and C) identified in this study and shown in Figs. 3 and 4, correspond to possible other interfaces. Their polarities and travel-times seem to indicate that those conversions have been generated by deeper structures. Further studies are needed to check if the phases B and C are linked to conversions at the same interface and to estimate the depth of their correlated discontinuity. The future analysis of these deeper interfaces might allow new structural information that can shed light on the presence of a detachement zone in the western Gulf of Corinth.
Acknowledgements
We thank Marc Regnier for useful discussions on the converted wave analysis subject. The manuscript was improved by critical comments from two anonymous referees. This work was supported by the European 3F-CORINTH project ENK6-CT-2000-000056V. Partial funding has been obtained from the French ‘Programme national des risques naturels’ and from the French ‘Groupe de recherche Corinthe’. This is the Géosciences Azur contribution No. 606.