

Version française abrégée
Les données historiques ([29], et Yiou et Masson-Delmotte [37]) et paléoclimatiques sont nécessaires pour documenter pleinement la variabilité du climat. Cet article décrit les progrès et les résultats obtenus pour atteindre cet objectif. Nous nous limiterons au dernier million d'années, période suffisamment brève pour que la position des continents soit restée la même.
1 Les outils paléoclimatiques
Les enregistrements obtenus dans les glaces polaires permettent de documenter la composition chimique de l'air, sa teneur en éléments traces et en poussières d'origine volcanique ou continentale. En outre, la composition isotopique des glaces dépend directement de la température de condensation de la vapeur d'eau qui donne naissance aux précipitations neigeuses.
Aux plus basses latitudes, l'analyse des anneaux d'arbres permet de reconstituer température et précipitation, avec une résolution annuelle. Concrétions des cavernes, pollens et fossiles présents dans les sédiments lacustres et les tourbières donnent une bonne image des climats continentaux.
En milieu océanique, l'analyse faunistique, isotopique et géochimique des sédiments profonds documente les variations de la température et de salinité des eaux de surface, ainsi que celles de la circulation profonde [14]. En outre, les variations de composition isotopiques des foraminifères benthiques permettent de reconstituer les variations du niveau de la mer liées au volume des calottes glaciaires.
Le lecteur trouvera plus de détails dans [8], tout comme pour la chronostratigraphie, qui joue un rôle essentiel pour comparer les différents enregistrements.
2 La théorie astronomique des paléoclimats
Les outils paléoclimatiques ont été utilisés pour valider la théorie astronomique des paléoclimats et rejeter les autres théories, qui n'étaient pas capables d'expliquer la succession quasi-périodique des glaciations du Quaternaire. En effet, les variations de l'orbite que décrit la Terre autour du Soleil sont dues à la présence des autres planètes du système solaire. Les variations de l'inclinaison de la Terre, d'une périodicité de 41 000 ans, accroissent le contraste saisonnier lorsque l'inclinaison augmente [4]. L'effet conjugué de la précession des équinoxes et de la déformation de l'orbite elliptique conduisent au déplacement du périhélie (point le plus près du Soleil) par rapport aux saisons, avec une périodicité proche de 21 000 ans. Celle-ci a lieu actuellement en janvier, alors qu'elle se produisait en juillet il y a 11 000 ans. Les étés de l'hémisphère nord étaient alors plus chauds et les hivers plus froids qu'aujourd'hui. Enfin, les variations de l'excentricité de l'orbite terrestre présentent des périodicités proches de 100 000 et de 400 000 ans. Elles induisent de faibles variations de la distance moyenne Terre–Soleil, et donc de faibles variations d'insolation en moyenne annuelle globale (< 0,3 % au cours des derniers 106 ans).
L'analyse des carottes de glace polaires et des sédiments marins a montré que les variations du climat de la Terre contiennent les périodicités orbitales, ce qui constitue un soutien très fort à la théorie astronomique (Fig. 1). Cependant, si les variations d'insolation contribuent à fixer le rythme des glaciations, de nombreuses rétroactions interviennent pour amplifier le forçage astronomique. Par exemple, lors de l'entrée en glaciation il y a 115 000 ans, la baisse d'insolation a provoqué un refroidissement des hautes latitudes, un accroissement du transport de vapeur d'eau vers les mers nordiques, une baisse de leur salinité, une réduction de la circulation globale de l'océan et du flux de chaleur vers les hautes latitudes [26,27]. Ces changements ont favorisé l'installation de la glaciation, qui a été amplifiée par la disparition de la forêt boréale, remplacée par une toundra d'albédo élevé [13], puis par la baisse des teneurs en gaz à effet de serre [5]. L'océan, la biosphère et les cycles biogéochimiques contribuent donc conjointement aux changements du climat en réponse aux variations d'insolation. Il reste toutefois un mystère, à savoir la prédominance de la périodicité de 100 000 ans dans les enregistrements paléoclimatiques du dernier million d'années. On ne sait toujours pas comment des composantes lentes du système climatique (calottes glaciaires, isostasie, cycle du carbone) interagissent pour la produire.
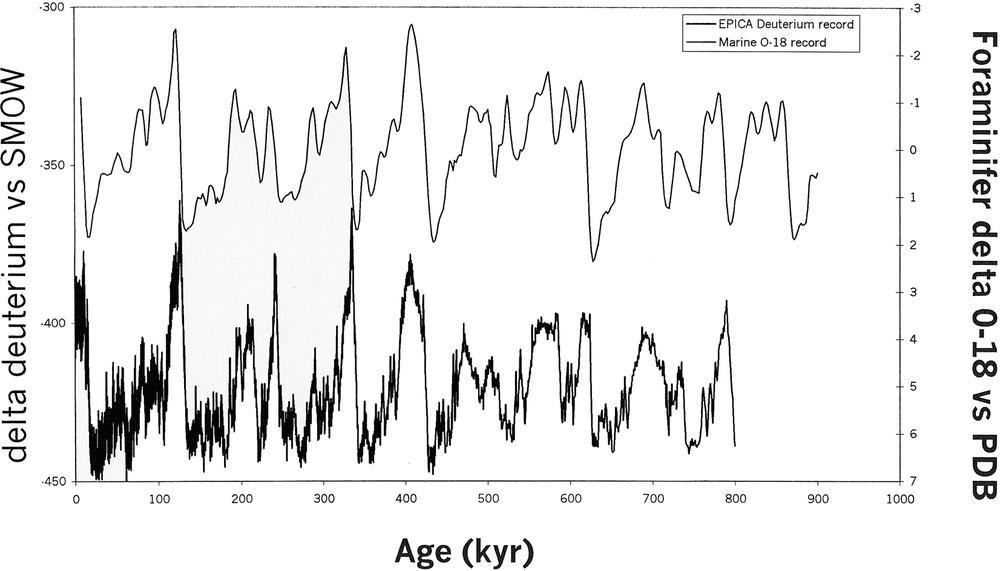
Comparison of the Dome C (Antarctica) deuterium ice record [18] with the oceanic 18O record [3], showing the periodicities predicted by the Milankovitch theory.
Comparaison des variations du deutérium dans le forage du dôme C (Antarctique) [18] et de 18O dans les sédiments marins [3], montrant les périodicités prédites par la théorie de Milankovitch.
3 Les variations climatiques rapides
Les enregistrements paléoclimatiques obtenus dans les carottes de glace polaires et les sédiments de l'océan Atlantique nord (Fig. 2) témoignent de l'existence d'une succession de changements climatiques rapides durant la dernière glaciation et la transition vers le climat chaud actuel [7,12]. La datation 14C des foraminifères d'une carotte prélevée au large du Portugal montre un réchauffement de 10 °C en moins de 400 ans [2]. En comptant les couches annuelles de glace enregistrant le même événement au Groenland, on constate qu'il s'est produit en 70 ans [34].
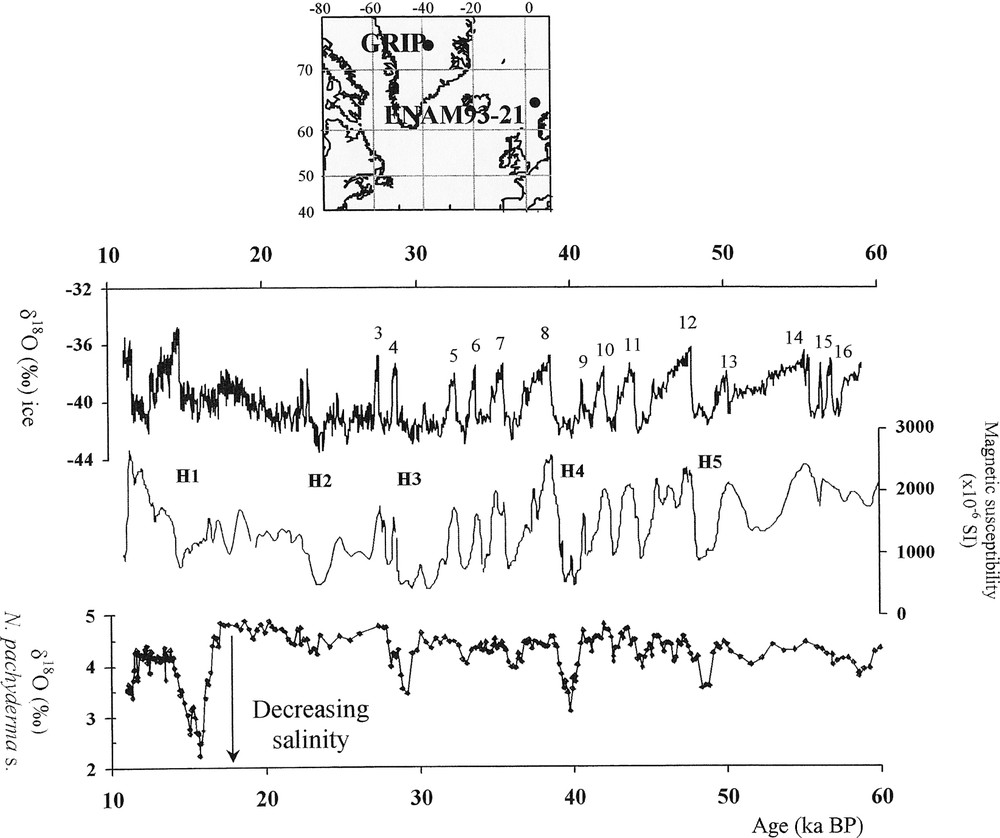
Variations of the air temperature over Greenland [12], magnetic susceptibility of the sediment, proxy for thermohaline circulation [28] and 18O in planktonic foraminifera, proxy for surface water salinity in core ENAM 93–21.
Variations de la température de l'air au Groenland [12], de la susceptibilité magnétique des sédiments, proxy de la circulation thermohaline [28] et 18O dans les foraminifères planctoniques, proxy de la salinité des eaux de surface dans la carotte ENAM 93–21.
Les principaux coups de froid se marquent, dans l'Atlantique nord, par le dépôt de sédiments pauvres en fossiles, mais riches en éléments détritiques volcaniques et en carbonates provenant du bouclier Laurentide. Ce sont les événements de Heinrich (HE) qui sont associés à des débâcles massives d'icebergs relâchés par la carotte glaciaire Laurentide. L'enregistrement paléoclimatique obtenu au Groenland témoigne également d'une variabilité climatique à l'échelle millénaire. Ce sont les événements de Dansgaard–Oeschger (D–O), marqués par un réchauffement rapide, suivi d'un lent refroidissement. Les HE correspondent aux périodes les plus froides [9] et les D–O semblent associés à des débâcles des calottes glaciaires européennes [16].
Ces événements rapides ne sont pas associés à des variations d'insolation, mais à des réorganisations internes du système climatique. Les débâcles massives d'icebergs provoquent une injection d'eau douce, qui diminue la salinité et la densité des eaux de surface [7,11], ralentit les formations d'eau profonde et la circulation océanique thermohaline [17,35], et l'apport de chaleur transporté depuis l'hémisphère sud par les eaux de surface de l'océan Atlantique [19]. Ainsi est apparue l'idée que la circulation thermohaline pouvait passer rapidement d'un mode actif en climat chaud à un mode ralenti en période froide (Fig. 3).
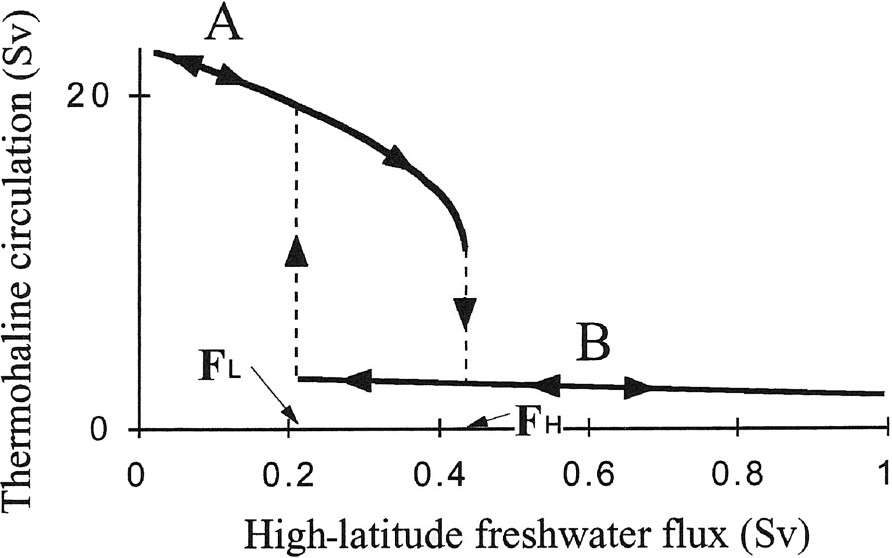
Idealized diagram of the thermohaline circulation as a function of additional freshwater input at high latitudes. When the input exceeds a threshold FH, the surface water stratification becomes so strong that no deep water may be formed. Circulation abruptly becomes weak and can stay so as long as the freshwater input is higher than a low threshold FL, which is required to allow winter convection and surface water sinking. A scenario for HE is to alternate between positions A and B on the diagram. The ice sheet grows slowly (A: several kyrs) up to the point that a massive iceberg discharge is triggered, producing a massive freshwater input (B: a few centuries). When the iceberg discharge stops, the cycle is closed (return to A) [31]. Masquer
Idealized diagram of the thermohaline circulation as a function of additional freshwater input at high latitudes. When the input exceeds a threshold FH, the surface water stratification becomes so strong that no deep water may be formed. Circulation abruptly becomes ... Lire la suite
Variations de la circulation thermohaline en fonction de l'injection d'eau douce résultant de la fonte des icebergs. Lorsque celle-ci dépasse un seuil haut (FH), les eaux superficielles sont si stratifiées que les plongées d'eau dans les abysses deviennent impossibles. La circulation ralentit et passe en mode faible. Elle y reste tant que l'injection d'eau douce reste supérieure à un seuil bas (FL), qui doit être franchi pour que la convection hivernale puisse reprendre avec formation d'eau profonde. Un scénario pour les HE est une alternance entre les positions A et B sur le diagramme. La calotte glaciaire croît lentement (A, quelques millénaires) jusqu'au point où se déclenche une décharge massive d'icebergs, produisant une énorme injection d'eau douve (B, d'une durée de quelques siècles). On revient rapidement en A lorsque la débâcle est terminée [31]. Masquer
Variations de la circulation thermohaline en fonction de l'injection d'eau douce résultant de la fonte des icebergs. Lorsque celle-ci dépasse un seuil haut (FH), les eaux superficielles sont si stratifiées que les plongées d'eau dans les abysses deviennent impossibles. La ... Lire la suite
On retrouve sur l'ensemble du globe le contrecoup des HE et D–O. On ne connaît pas encore l'ensemble des interactions au sein du système climatique qui permettent un changement rapide de l'ensemble de la circulation atmosphérique. Le rôle de l'océan est certain, en raison de sa capacité calorifique. Il explique la persistance des changements et une réponse différée de quelques siècles des hautes latitudes de l'hémisphère sud [6]. Quant aux mécanismes qui favorisent l'extension des changements à l'ensemble du globe, ils restent mal connus. On pense que la dynamique de l'atmosphère tropicale aurait un impact fort en raison de l'énergie énorme qu'elle met en jeu, mais on ne lui connaît pas de modes distincts d'activité. Des expériences conduites avec des modèles de circulation générale de l'atmosphère ne rendent que partiellement compte des variations observées [1]. Ou bien on n'a pas encore compris l'ensemble des facteurs déclenchant les variations climatiques abruptes dans la région nord-atlantique, ou bien les modèles simulent mal l'ampleur des changements associés au passage d'un seuil.
4 Conclusion
Le système climatique est un système de haute complexité. Il est sensible aux variations saisonnières de l'insolation calculées par la théorie astronomique, qui rend bien compte des variations observées aux échelles de 104 à 106 ans. De nombreuses rétroactions (changements de circulation océanique, du cycle hydrologique, de la végétation, de l'albédo et des gaz à effet de serre) sont nécessaires pour rendre compte quantitativement des variations climatiques observées. Aux échelles de 102 à 103 ans, ce sont des réorganisations internes du système climatique qui rendent compte des variations climatiques abruptes, mais leur mécanisme est encore loin d'être connu dans le détail. Avec les incertitudes actuelles, on ne peut exclure que le changement climatique induit par les activités humaines augmente la probabilité de variations abruptes qui auraient un impact écologique considérable au cours des prochains siècles.
1 Introduction
Meteorological records are too short to capture the full range of the climate system variability, which is documented by geological data and historical records ([29] and Yiou and Masson-Delmotte [37]). Together with recent evidence of warming in many parts of the world, these data have convinced climatologists that the present climate is changing [22]. Here, we shall review the progress made to quantitatively reconstruct past climates changes and discuss the theories developed to explain them. We shall restrict ourselves to the last 106 years, because this time interval is short enough with respect to the time constants of plate tectonics and focus on mechanisms responsible for centennial to millennial climatic variability.
2 Modern methods for quantitatively reconstructing past climates
Past climates must be reconstructed with proxy variables, which stand in for unobservable climate variables. Proxies are numerous and can be classified according to the climatic variable they stand in for. Each proxy is characterized by its temporal resolution, the timescale for which it provides climatic estimates and the accuracy of these estimates. We will briefly describe the most widely used proxies and refer to [8] for more details and discussion on chronostratigraphy, which is essential to compare climatic records from different locations.
2.1 Atmospheric variables and continental surface
The past atmospheric composition (CO2, CH4, N2O) is directly reflected in air bubbles trapped in polar ice cores. Ice cores also provide records of air mass characteristics seen in total ion glaciochemistry as well as the history of explosive volcanic eruptions and changes in atmospheric dust content that may have had significant impacts on the global energy balance of the atmosphere. The accumulation of past snowfall in the polar ice sheets provides a local record not only of precipitation amounts but also of air temperature: The greater the fall in temperature, the lower will be the H218O or HD16O concentration in the precipitation.
In mid-latitudes, interannual variations in tree-ring width or density contain a strong climatic signal, mainly related to air temperature and humidity. Dendroclimatology provides annually resolved records as long as fossil trees are preserved, i.e. the last 12 000 years. On a longer time scale, cave concretions, pollen and fossils preserved in lake sediment and peat bogs provide information on continental hydrology and climate. Maps reporting the distribution of pollen in continental sediments for a given time interval are used to reconstruct the vegetation cover and to estimate continental albedo.
2.2 Oceanic variables
Many parameters describe the configuration of the past ocean [14]. Sea-level variations, which are linked to continental ice volume changes, may be reconstructed from coastal deposits, or indirectly from the 18O record of deep-sea sediment cores. Sea Surface Temperature (SST) may be estimated either from faunal or geochemical changes in deep sea sediments. When SST is known, the 18O/16O ratio of planktonic foraminifera can be used to estimate the 18O/16O ratio of past sea water, which is closely linked to salinity. The sea ice extent can be reconstructed from fossil diatoms. Deep water masses form at high latitude. After leaving the surface, their chemical composition evolves as a result of bacterial activity and this change is recorded in the Cd or 13C content of shells of benthic foraminifer, which can thus be used to reconstruct the deep-water flow lines.
3 The astronomical theory of palaeoclimates (Milankovitch theory)
18O analyses of deep sea cores showed that there were numerous ice ages. Many theories tried to explain their occurrence. One group of theories invokes internal elements of the climate system, which have response times sufficiently long to yield fluctuations in the range 104 to 105 years. Such features include the growth and decay of ice sheets, the ice cover of the Arctic Ocean, the distribution of carbon dioxide between atmosphere and ocean or the deep circulation of the ocean. Other theories were based on factors external to the climate system, including volcanic or interstellar dust that might weaken the penetration of the solar radiation to the Earth's surface, variations in the output of the sun, and changes in the Earth's orbital geometry.
Changes in the Earth's orbital parameters lead primarily to changes in the intensity of the seasonal cycle [4]. Increasing the tilt of the Earth's axis increases the amplitude of the cycle: winters are colder and summers are hotter in both hemispheres, since the summer hemisphere intercepts more solar radiation. The temporal variation of the tilt has a period of approximately 41 000 years. The effect of precession on insolation is less straightforward, but together with the rotation of the ellipse around the sun, it determines the time of the perihelion, i.e. the point of the Earth's orbit, which is closer to the sun. The variation in the time of perihelion has a period of approximately 21 000 years. Perihelion is now reached in January, so that the Northern Hemisphere's winter is slightly milder and the southern hemisphere winter cooler than it was 11 000 years ago, when the perihelion was reached in July.
The eccentricity of the Earth's orbit varies with periods close to 100 000 years and 400 000 years. It has two distinct effects on insolation. The greater the eccentricity of the orbit, the greater the difference between the maximum and the minimum distance of the Earth from the sun, and hence the greater the amplitude of the precession effect. The total insolation also varies with the eccentricity of the orbit. Since the area of the ellipse decreases when the eccentricity increases, the Earth receives more heat annually when the eccentricity is greater. However, this effect is small: the global annual insolation has changed by at most 0.3% over the past 106 years [4].
Long marine and polar ice records contain the periodicities of orbital variations and provide a wealth of evidence supporting the astronomical theory of climatic change (Fig. 1). However, insolation changes constitute only a trigger of climatic variations and feedbacks play an essential role. For instance, at the end of the last interglaciation, about 115 000 years ago, an early cooling of the Nordic Seas in response to the local insolation decrease resulted in an increase of SST gradient and atmospheric moisture transport between low to high latitudes, a reduction of surface salinity in Nordic Seas, an increase in sea ice enhancing the ice-albedo feedback, and less active thermohaline circulation [26,27]. These changes provided optimal conditions for delivering snow over the Northern Hemisphere and initiating ice sheets. The ocean therefore amplifies the initial response to the primary insolation forcing. Replacement of the boreal forest by tundra would lead to further cooling by enhancing the surface albedo [13]. Finally, the drop of the atmospheric CO2 and CH4 content results in an additional cooling by reducing the greenhouse effect in the atmosphere [5]. However, we have not yet determined the whole set of feedbacks, which translate the astronomical signal into a climate response of glacial–interglacial magnitude. One of the paradoxes of Quaternary climate is the dominance of the 100-kyr periodicity during the past 106 years, even though the amplitude of insolation changes at this period is extremely small. We still do not know how the major non-linear interactions (ice volume variations, isostasy, carbon cycle, air–sea–ice system fluctuations) interfere with the orbital forcing to generate this strong 100-kyr cycle.
4 Abrupt climatic changes
Both ice and marine climatic records (Fig. 2) show that large, widespread, abrupt climate changes have occurred repeatedly throughout the last glaciation [7,12]. How fast did climate vary during such events? 14C dating of foraminifer shells shows that surface water warmed by 10 °C in less than four centuries at the end of the glaciation [2]. The same event was found in the Greenland ice record, where annual layers of snow deposit can be counted: the warming developed in about 70 years [34].
Major cooling events related to periods of massive iceberg discharges have punctuated the last glacial period. In the North Atlantic sediment cores, these events called Heinrich Events (HE) are characterized by sudden increase of the coarse lithic fraction (>150 μm) and a lowering of sea surface salinity. The major source of icebergs during these events was the Laurentide ice sheet. The end of iceberg discharge is marked by a very rapid warming over the whole North Atlantic area. Furthermore, the Greenland ice record of air temperature variations reveals climate variability on millennium timescales. These cycles, called Dansgaard–Oeschger cycles (D–O) are also characterized by rapid warming followed by progressive cooling. HE occurred during the coldest periods [9], whereas the cold phase of D–O events is associated with iceberg discharges originating from Iceland and European ice sheets [16].
Unlike the glacial–interglacial changes, these rapid climatic shifts are not associated with variations in the orbital parameters of the Earth and must be explained by internal reorganization of the climatic system. The isotope record of North Atlantic cores provides evidence that massive iceberg discharge associated with HE resulted in a large injection of freshwater reducing the salinity and the density of surface water [7,11]. Surface hydrological changes induced a drastic reduction of deep water formation in the Nordic Seas and a slowdown of the overall Atlantic thermohaline circulation [17,35]. The decreased advection of heat carried from the Southern Hemisphere by oceanic circulation explained the cooling of the North Atlantic area. At the end of the iceberg discharge, a rapid restart of the circulation leads to abrupt warming ([19] and Roche and Paillard [33]).
The deep-water circulation was significantly different from today during the last glacial maximum [15]. This led to the view of a bimodal ocean–atmosphere system: a warm (interstadial) mode characterized by a strong thermohaline circulation and a cold (stadial) mode with a weak thermohaline circulation (Fig. 3).
Climate changes correlative with D–O and H events have been identified in a number of high resolution climate records from areas as distant as Central Asia [36], western Europe ([20], Genty et al. [21], and Masson-Delmotte et al. [30]), Mediterranean Basin ([10], and Kageyama et al. [25]), South America [32], and Antarctica (Jouzel et al. [23]), where they are out of phase with those of the North Atlantic [6]. What is the chain of interactions producing immediate, large and widespread atmospheric impacts and delayed temperature variations in Antarctica? Ocean thermohaline circulation changes are implicated in both the persistence and delayed response. However, the mechanisms that spread anomalies across the whole Earth are less obvious. Interactions between the tropical ocean and the atmosphere might play a role, but there is no evidence for bifurcation in tropical dynamics between cold and warm stages. General circulation models (GCM) forced by hypothesized causes of abrupt climate changes often simulate some regional changes rather well, underestimate others, and fail to generate sufficiently widespread anomaly patterns [1]. Therefore, either some natural forcings have been omitted from the GCM simulations, or the GCMs have underestimated the climate response to threshold crossing. The palaeoclimatic record provides numerous evidences that ice-sheet instabilities and ocean reorganizations constitute the primary trigger of abrupt climate changes, but we do not fully understand how they have perturbed the global atmosphere dynamics (Kageyama and Paillard [24]).
5 Conclusion
The climate system is complex because it is made up of several components (atmosphere, ocean, sea ice, continental surface, ice sheets), each of which has its own response time. The palaeoclimate record provides ample evidence that these components interact nonlinearly with each other and with global biogeochemical cycles, which drive greenhouse gas concentration in the atmosphere.
The climate system is sensitive to the seasonal variations of the insolation due to changes in the Earth's orbit around the sun. On the 104- to 106-year timescale, the astronomical theory of palaeoclimates accounts for most of the reconstructed variations. However, the magnitude of changes can only be explained by taking into account numerous feedbacks to the primary insolation forcing.
On shorter time scales (102 to 103 years), internal reorganization of the climate system without significant external forcing results in large abrupt changes. The magnitude, timing and geographic extent of these changes is well documented, but little is known about the physical mechanisms that cause them. Numerical experiments have shown that the ocean circulation can switch abruptly between different equilibriums with large variations in heat transport [33] and ice sheets can oscillate, potentially explaining episodic massive iceberg discharges [29]. How these oscillators, which are present in the climate system, interact to redistribute moisture and heat in space and time across the globe is poorly understood. In the present context of uncertainty, we cannot exclude that human forcing of climate change might increase the probability of large, abrupt events, which would have serious ecological impacts within the next centuries [22].
Acknowledgements
This work was supported by CNRS–INSU, CEA (France) and EU climate programmes.