

1 Introduction
Given the importance of stream and river temperature for freshwater ecology [4,5,7] and quality, it is of considerable interest to understand how the thermal regime changed in the past in order to better predict future modifications [13]. However, data that are both detailed enough (hourly) and recorded over a sufficiently long period (20 years or more) are scarce [13]. Models can help to reconstitute past-time series of river temperature and thereby give a better understanding of how they evolved in the past. In this type of application, regression or stochastic models that only take into account atmospheric temperature are currently the most attractive, daily time series of atmospheric temperature sometimes going back to the 19th century. Moreover, this is one of the meteorological variables that climate models of general circulation simulate best [10,12], making it possible to envisage carrying out prospective studies on the consequences of possible climate change on water temperatures. In France, river temperature was first recorded continuously in the 1970s, often by the electricity generating authority (‘Électricité de France’, EDF), within a statutory framework. In this paper, continuous temperature data from 1976 to 2003, collected at four stations of the Middle Loire, are used to derive monthly values in order to: (i) determine trends and changes since 1976, (ii) determine the possible influence on the thermal regime of the middle Loire of incoming groundwater from the Beauce aquifer, (iii) test the ability of a regression model to reconstruct annual, spring and summer water temperatures since 1881 based on long-term air temperature and discharge data, (iv) characterize the exceptional year 2003 in relation to the reconstituted 1881–1975 time series and data measured between 1976 and 2003.
2 Methods
The 266-km-long reach studied is located between Belleville and Avoine (Fig. 1). Belleville is situated 536 km downstream of the Loire's source and 71 km downstream of its junction with the Allier River, its main tributary at this point. The long distance travelled means that memory of the upstream temperature has been lost, and the temperature of the middle Loire is mainly influenced by thermal exchange with the atmosphere [11]. For the upstream reach between Belleville and Dampierre (45 km), inflow from its tributaries and groundwater is too small to modify the thermal regime of the Loire. On the other hand, between Dampierre and Saint-Laurent-des-Eaux, it is subject to continuous thermal exchange with the limestone aquifers from the nearby Beauce region and with the ‘Val d'Orléans’ system, especially downstream of Orleans [1,2,6].
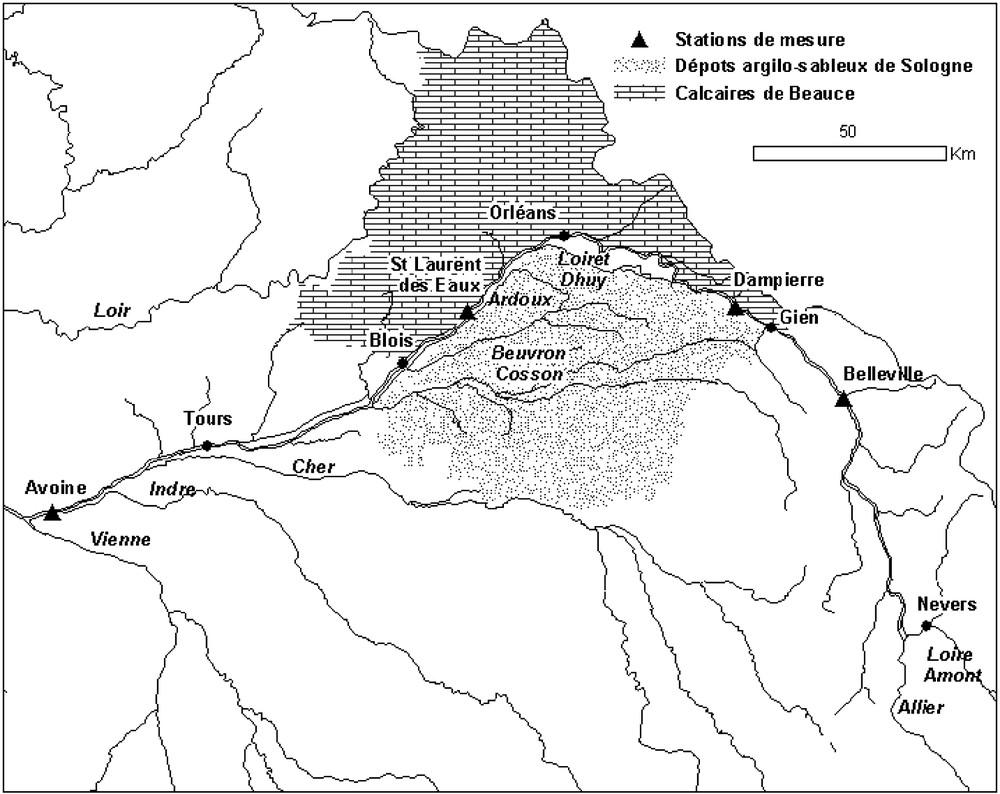
Location of the studied sites: Belleville, Dampierre, Saint-Laurent-des-Eaux, Avoine (Chinon).
Localisation des sites étudiés : Belleville, Dampierre, Saint-Laurent-des-Eaux, Avoine (Chinon).
The temperature data used in this paper were collected by EDF at continuous monitoring stations upstream of the four nuclear power plants: Belleville, Dampierre, Saint-Laurent-des-Eaux and Avoine (Fig. 1). The hourly-recorded temperature data began in 1976 at Avoine and Saint-Laurent-des-Eaux, in November 1979 at Dampierre and 1978 at Belleville. The data were examined and approved by EDF on a daily and hourly time step, particularly to detect outliers and drift [8]. However, for this study, an additional examination was carried out at a monthly level, from which any long-term break in the time series could be detected a posteriori. In this way, temperature values for some months were corrected according to inter-station correlations.
Nuclear power stations are equipped with closed-circuit cooling towers, allowing the heat to be discharged directly into the atmosphere. Thermal waste into the Loire, essentially from purging the cooling towers, is very low. For example, studies carried out by EDF indicate that, 90%of the time, the daily temperature rise of the Loire downstream of the Dampierre power station is less than 0.3 °C, the median rise being 0.1 °C. Moreover, the greatest rise in temperature is in winter, which means that the statistics for summer increases result in even lower values. In this study, we therefore considered that temperature rises caused by nuclear power stations are of secondary importance in the trends that concerned us. This will be confirmed from the analysis of the series from Belleville, situated upstream of all the Loire power stations.
Trends in time series of annual, quarterly and monthly Loire temperatures were analysed using the non-parametric Spearman rank correlation test. This test looks for a trend in a time series, without specifying whether the trend is linear or non-linear.
To explain the temperature differences observed during summer periods between Dampierre and Saint-Laurent-des-Eaux, an energy balance based on mean data for the month of August was derived for the 1980–2003 period. This energy balance is based on Eq. (1), where ρ and are the water density and heat capacity, and are the stream flow rates entering the study reach ( at Orleans) and leaving it (i, at Blois, 30 km downstream of Saint-Laurent-des-Eaux). and are the temperatures at the Dampierre and Saint-Laurent-des-Eaux monitoring stations.
| (1) |
The surface heat exchange () was modelled as a combination of five processes, radiative (solar and atmospheric long-wave radiations, long-wave back radiation from the water) and non-radiative mechanisms (conduction and evaporation), A being the exchange surface area of the reach (water) [3]. We considered that the main inflow to the Loire is from the limestone aquifers of the Beauce region () and possibly the limestone system of ‘Val d'Orléans’, and then inflow from the tributaries (). In this way, the energy balance for the month of August each year is completed with the mass balance (Eq. (2)).
| (2) |
The relationship between air temperature, water flow and temperature was examined at annual, spring and summer levels using multiple regression analysis. Flow data came from the water monitoring stations at Gien (1976–2003), Orleans (1976–2003) and Blois (1881–2003) (DIREN Centre). Meteorological data were taken from two sources: (1) daily atmospheric temperatures, relative humidity or vapour pressure of the air, solar radiation and cloud cover at the Tours and Orléans stations, for calculating the energy balance, and (2) monthly atmospheric temperature at Orléans (1881–2003), homogenized by Météo-France as part of French climate change studies in the 20th century [9] for trend analysis.
3 Results
3.1 Trends in water temperature in the middle reach of the Loire since 1976 (Fig. 2)
Analysis of average quarterly temperatures shows significant increases at the 99%confidence level (Spearman's test) for all four Loire monitoring stations, but only in spring and summer (Table 1). For the rest of the year, increases are not significant at this confidence level, with the exception of Saint-Laurent-des-Eaux and Chinon in winter, although increases at some stations appear at a lower confidence level. This indicates some changes in the thermal regime during the period when the water warms up in spring and summer. The average spring and summer increases (Fig. 2b and c) range between 2.4 and 3 °C, and these differences cannot be explained by the location of the stations. During the same periods, a significant rise (at a 99%confidence level) was observed in the air temperatures at Orléans, and a decrease in flow at Gien (at a 90%confidence level for March to May, 95%for June to August and annually). Moreover, it can be seen that the series at Belleville, situated upstream of all the nuclear power stations on the Loire, follows exactly the same trends as the other series influenced by thermal discharge, thereby confirming that warming caused by the power stations is largely secondary to other phenomena that could explain these trends.
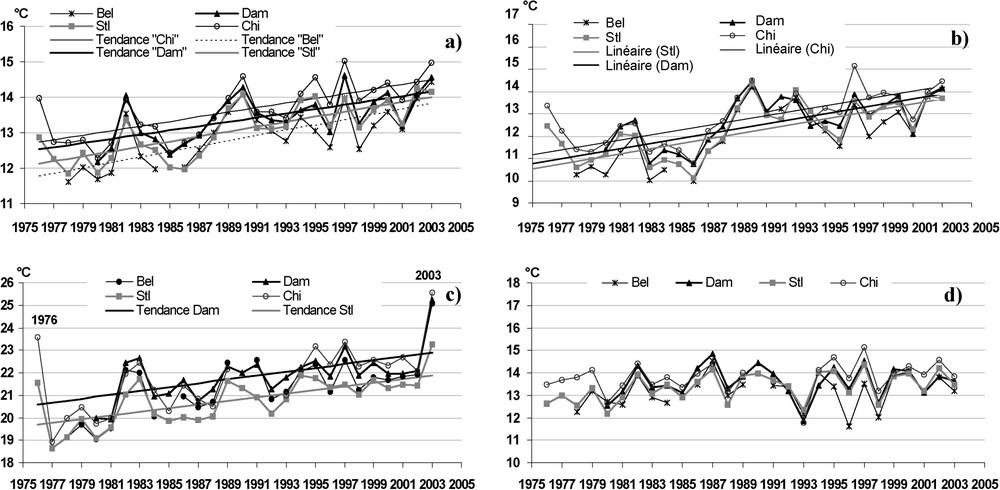
Trend of temperatures of the middle Loire since 1976: (a) annual mean values, (b) spring mean values (March to May), (c) summer mean values (June to August), (d) autumn mean values (September to November). Bel = Belleville, Dam = Dampierre, Stl = Saint-Laurent-des-Eaux, Chi = Chinon (Avoine).
Évolution des températures de la Loire moyenne depuis 1976 : (a) moyennes annuelles, (b) moyennes printanières (mars à mai), (c) moyennes estivales (juin à août), (d) moyennes à l'automne (septembre à novembre). Bel = Belleville, Dam = Dampierre, Stl = Saint-Laurent-des-Eaux, Chi = Chinon (Avoine).
Significance and amplitude of trends observed from mean quarterly data on water temperature (Belleville, Dampierre, Saint-Laurent-des-Eaux, Chinon), air temperature (Orléans) and flow (Gien and Blois) (1976–2003). The probability of incorrectly rejecting a trend is: <1%(in bold print), <5%(in bold italics), and <10%(in italics). The amplitude of trends is only shown when detected at a 99%confidence level (probability <1%)
Significativité et amplitude des tendances observées sur les données de température de la Loire (Belleville, Dampierre, Saint-Laurent-des-Eaux, Chinon), atmosphériques (Orléans), et des débits (Gien et Blois) (période 1976–2003). La probabilité de rejeter à tort une tendance est : inférieure à 1%(en gras), inférieure à 5%(en gras italique), et inférieure à 10%(en italique). L'amplitude des tendances n'est indiquée que pour les détections avec un niveau de confiance de 99%(probabilité <1%)
| Teau | Mars à Mai | Juin à Aout | Sept–Nov | Dec–Fev | Année | |||||
| Hausse (°C) | prob. | Hausse (°C) | prob. | Hausse (°C) | prob. | Hausse (°C) | prob. | Hausse (°C) | prob. | |
| Belleville | 2.9 | 0.0002 | 2.8 | 0.0019 | + | 0.0891 | + | 0.0545 | 1.9 | 0.0001 |
| Dampierre | 2.4 | 0.0002 | 2.4 | 0.0116 | + | 0.1825 | + | 0.0407 | 1.7 | 0.0000 |
| St Laurent | 2.7 | 0.0001 | 2.5 | 0.0005 | + | 0.0141 | 2.1 | 0.0021 | 2 | 0.0000 |
| Chinon | 2.6 | 0.0000 | 3.0 | 0.0006 | + | 0.0723 | 1.6 | 0.0088 | 1.9 | 0.0000 |
| Tair | Hausse (°C) | prob. | Hausse (°C) | prob. | Hausse (°C) | prob. | Hausse (°C) | prob. | Hausse (°C) | prob. |
| Orléans | 2.1 | 0.0002 | 2.0 | 0.0109 | + | 0.5859 | + | 0.0695 | 1.5 | 0.0009 |
| Débits | Baisse | prob. | Baisse | prob. | Baisse | prob. | Baisse | prob. | Baisse | prob. |
| Gien | – | 0.0925 | – | 0.0191 | – | 0.5435 | – | 0.4053 | – | 0.0102 |
In addition, the data show between-site temperature differences along the middle reach of the Loire. Taken as monthly values, the river temperature increases by about 0.5 °C in the Belleville–Dampierre and Saint-Laurent–Avoine reaches, even though the latter is three times longer. On the other hand, between Dampierre and Saint-Laurent, there is a decrease of about 0.2 °C in the annual mean temperature and 1 °C in the summer mean value (Fig. 2b). The differences between monthly mean values recorded at the two stations show a seasonal dependence, based on flow rates (Fig. 3). They are negative during dry periods: the multi-annual mean temperature at Saint-Laurent in August is 1.1 °C lower than at Dampierre.
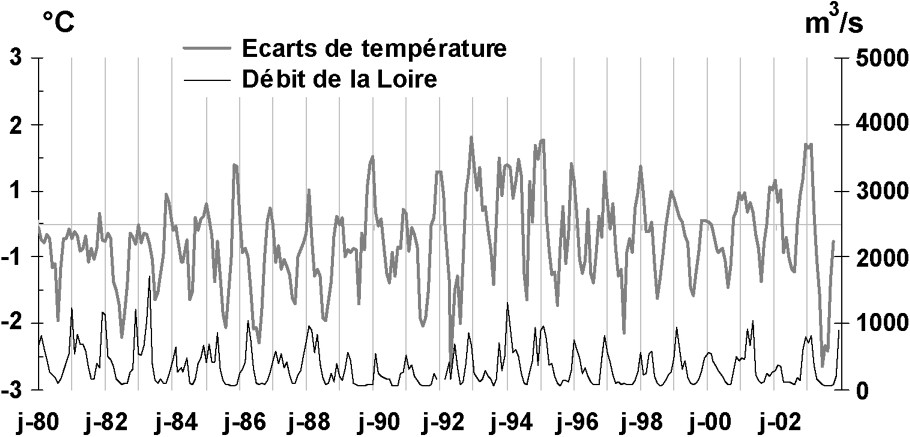
Time series of the monthly flow of the Loire at Blois and differences in mean monthly temperature between Saint-Laurent-des-Eaux and Dampierre from 1980 to 2003.
Évolution des débits mensuels de la Loire à Blois et des écarts des températures moyennes mensuelles entre Saint-Laurent-des-Eaux et Dampierre de 1980 à 2003.
The energy balance in August between 1980 and 2003 on the Orléans–Saint-Laurent-des-Eaux reach explains this cooling of the Loire, even if there are some uncertainties about the input data. Cooling is due to the relatively greater inflow of groundwater from the Beauce limestone aquifers (average multiyear temperature 13.5 °C) compared to the Loire discharge at this time of the year (Table 2). As the Loire temperature was not known at Orléans, we took it to be the same as that measured at Dampierre, assuming that losses on the Dampierre–Orléans stretch do not change the temperature. This approximation can also be justified on account of the small difference in temperature observed in the Belleville to Dampierre section during the summer period (Fig. 2b). However, unlike temperature values, it is very difficult to estimate over a long period of time the overall incoming flow rates from the Beauce aquifers and the small tributaries. Using a piezometric map, Gonzalez (1993) showed that the springs along a 1500-m stretch of the main channel of the Loire at la Chapelle-Saint-Mesmin constitute the greatest incoming flow (catchment area: 1066 km2). Their mean flow rate was estimated to be between 11.5 and 12 m3 s−1, using the mixing law of solutes in the river during the low-water period of 1986, when the flow rate of the River Loire was between 59 and 70 m3 s−1 [7]. Other studies, based on the difference between historical discharge rates measured at the gauging stations, showed the incoming flow rates to be between 6 and 19 m3 s−1 during the low discharge period prior to 1980 when abstraction rates for agricultural purposes were lower. The summer water temperatures of the springs measured by piezometers installed near the Loire since 2001 (DIREN Centre) varied between 13 and 14 °C. Therefore, we computed the energy balance on the basis of a constant water discharge of 10 m3 s−1 from the underground Beauce aquifer at a temperature of 13.5 °C. The overall inflow rate from tributaries was estimated to be the difference between the discharge of the Loire at Blois and Orléans, the discharge of the Beauce aquifer being deducted. The temperature of the incoming flow was estimated from the air temperature, using existing correlations at a regional level.
Input data and results of summer energy balance in the Orléans–Saint-Laurent-des-Eaux reach. monthly air temperature at Orléans, monthly temperature of the Loire at Dampierre, monthly temperature of the Loire at Saint-Laurent-des-Eaux, Δt= monthly temperature difference between Saint-Laurent-des-Eaux and Dampierre, QOrléans and discharge at the two stations, F(i−1) and F(i)=incoming and outgoing heat flux of the reach, heat flux from tributaries, heat flux from groundwater, heat flux from tributaries, net heat exchange with the atmosphere, outgoing heat flux calculated from Eq. (1), Δ= difference between and F(i)
Données d'entrée et résultats du bilan énergétique estival sur le tronçon Orléans–Saint-Laurent-des-Eaux. température mensuelle de l'air à Orléans, température mensuelle de la Loire à Dampierre, température mensuelle de la Loire à Saint-Laurent-des-Eaux, Δt= écart mensuel de température entre Saint-Laurent-des-Eaux et Dampierre, QOrléans et débits mensuels aux deux stations, F(i−1) et F(i)=flux d'entrée et de sortie du tronçon, flux de chaleur apporté par les eaux souterraines, flux de chaleur apporté par les affluents, flux de chaleur net échangé avec l'atmosphère, flux de chaleur à la sortie du tronçon, évalué d'après l'Éq. (1), Δ= différence entre et F(i)
| date | (°C) | (°C) | (°C) | Δ T (°C) | Q Orléans m 3 /s | m 3 /s | W/m 2 | W/m 2 | W/m 2 | W/m 2 | W/m 2 | W/m 2 | Δ % |
| août-80 | 19.6 | 22.1 | 20.6 | −1.5 | 84.1 | 134.1 | 972 | 1446 | 71 | 393 | 12 | 1447 | 0.0 |
| août-81 | 20.1 | 21.4 | 21.0 | −0.4 | 151.6 | 170.3 | 1697 | 1872 | 71 | 87 | 27 | 1881 | 0.5 |
| août-82 | 17.80 | 21.4 | 20.1 | −1.3 | 90.5 | 112.9 | 1012 | 1186 | 71 | 113 | −5 | 1190 | 0.4 |
| août-83 | 19.3 | 22.4 | 21.3 | −1.0 | 84.1 | 105.1 | 982 | 1171 | 71 | 107 | −32 | 1128 | −3.7 |
| août-84 | 18.3 | 21.4 | 20.4 | −1.0 | 66.8 | 89.1 | 746 | 948 | 71 | 114 | −9 | 922 | −2.7 |
| août-85 | 17.0 | 20.9 | 19.3 | −1.6 | 70.1 | 100.6 | 765 | 1016 | 71 | 179 | 5 | 1019 | 0.3 |
| août-86 | 17.4 | 21.4 | 19.6 | −1.8 | 65.8 | 84.7 | 735 | 866 | 71 | 79 | −25 | 860 | −0.8 |
| août-87 | 18.4 | 21.6 | 20.5 | −1.1 | 91.9 | 126.3 | 1039 | 1355 | 71 | 229 | 39 | 1377 | 1.7 |
| août-88 | 18.6 | 22.4 | 20.9 | −1.5 | 84.6 | 107.6 | 990 | 1177 | 71 | 123 | 40 | 1223 | 3.9 |
| août-89 | 19.4 | 22.7 | 21.5 | −1.2 | 51.5 | 62.0 | 611 | 695 | 71 | 4 | 25 | 711 | 2.3 |
| août-90 | 21.4 | 23.0 | 22.6 | −0.4 | 52.6 | 68.2 | 633 | 805 | 71 | 59 | 763 | −5.3 | |
| août-91 | 21.2 | 24.0 | 22.6 | −1.4 | 43.6 | 67.8 | 547 | 801 | 71 | 149 | 5 | 772 | −3.6 |
| août-92 | 20.4 | 23.5 | 22.0 | −1.5 | 75.2 | 86.2 | 923 | 991 | 71 | 10 | −25 | 979 | −1.2 |
| août-93 | 18.3 | 22.1 | 21.1 | −0.9 | 58.9 | 74.5 | 679 | 823 | 71 | 52 | 17 | 819 | −0.5 |
| août-94 | 20.1 | 22.3 | 21.2 | −1.1 | 81.3 | 94.9 | 949 | 1051 | 71 | 36 | 27 | 1083 | 3.0 |
| août-95 | 21.2 | 23.3 | 22.9 | −0.3 | 60.1 | 81.7 | 730 | 978 | 71 | 122 | −30 | 892 | −8.8 |
| août-96 | 18.6 | 22.0 | 21.1 | −0.9 | 67.8 | 95.3 | 778 | 1050 | 71 | 166 | −37 | 977 | −7.0 |
| août-97 | 22.3 | 26.0 | 23.8 | −2.2 | 61.6 | 73.0 | 837 | 907 | 71 | 15 | −21 | 902 | −0.6 |
| août-98 | 19.8 | 22.6 | 21.73 | −0.8 | 74.0 | ||||||||
| août-99 | 19.5 | 23.0 | 21.87 | −1.1 | 83.7 | ||||||||
| août-00 | 20.0 | 23.2 | 22.29 | −0.9 | 81.8 | 102.0 | 993 | 1188 | 71 | 102 | −15 | 1151 | −3.1 |
| août-01 | 20.2 | 23.0 | 22.15 | −0.9 | 97.5 | 115.0 | 1172 | 1331 | 71 | 75 | −30 | 1288 | −3.2 |
| août-02 | 18.8 | 21.8 | 21.12 | −0.7 | 70.7 | 0 | |||||||
| août-03 | 24.5 | 26.0 | 24.11 | −1.9 | 45.6 | 61.4 | 620 | 773 | 71 | 69 | −6 | 754 | −2.6 |
Table 2 shows the input data and the terms of the energy balance in W m−2. The last column indicates the difference (as a percentage) between the outgoing heat flux () at the end of the reach at Saint-Laurent-des-Eaux, and the same heat flux calculated from the energy balance calc. These two values are found to be roughly within ±4%, except in 1990, 1995 and 1996, and show that the decrease in temperature during August at Saint-Laurent-des-Eaux is closely related to the inflow of groundwater. The influence of groundwater is also shown by the stabilising of the temperature regime at Saint-Laurent-des-Eaux shown by lower annual amplitude between summer and winter temperatures: 16.5 °C between monthly August and January temperatures at Saint-Laurent-des-Eaux compared to 17.5 °C for the two upstream stations (Belleville and Dampierre).
3.2 Restoring water temperature data in the middle Loire since 1881
3.2.1 Regression model for water temperature over the 1976–2003 period
The annual, spring (March–May) and summer (June–August) time series of the temperature of the middle Loire (mean of Dampierre and Chinon series) were modelled by multiple regression based on air temperature in Orléans and discharge in Blois. Air temperature is the predominant explanatory variable, as shown by several authors. It explains 71 to 84%of the variance of temperature of the middle Loire (Figs. 4a–c). Using flow as a second explanatory variable is not often found in the literature on this type of study but proved to be of interest (partial correlation for spring data, for summer data). As shown in Fig. 4, the two variables have a greater influence on temperature in summer, probably due to the more stable hydrological conditions, and when the water temperature is close to the equilibrium water temperature [11]. Thus, the two variables (air temperature, or discharge or its Napierian logarithm) can give a convincing estimate of the temperature of the middle Loire, as shown by the coefficient of determination and standard deviation of errors in the order of 0.3 °C. However, it can be observed that the regressions tend to underestimate the temperatures in 1976 and 2003 by about 0.6 °C.
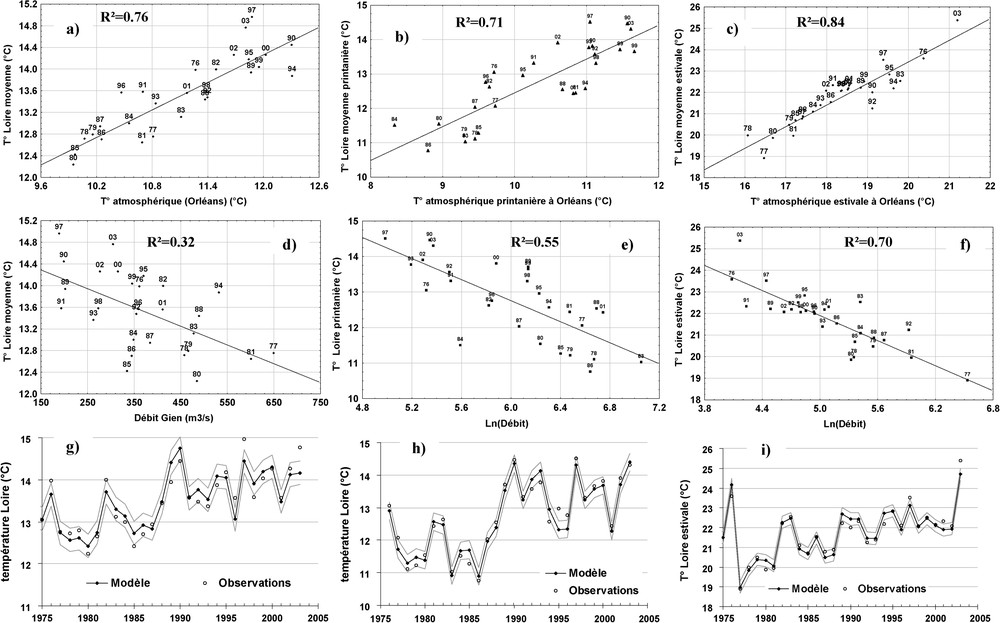
Estimation of annual, spring and summer temperatures of the middle Loire by multiple regression: (a), (b), (c) water temperature in relation to air temperature – (a) annual mean, (b) March to May, (c) June to August –; (d), (e), (f) water temperature in relation to flow – (d) annual mean, (e) March to May, (f) June to August –; (g), (h), (i) comparison of measured and estimated values for the three time-scales studied – (g) annual, (h) March to May, (i) June to August.
Estimation de la température annuelle, printanière et estivale de la Loire moyenne par régression multiple : (a), (b), (c) température de l'eau en fonction de la température de l'air – moyenne annuelle (a), de mars à mai (b), de juin à août (c) – ; (d), (e), (f) température de l'eau en fonction du débit – moyenne annuelle (d), de mars à mai, (e) de juin à août (f) ; (g), (h), (i) comparaison valeurs mesurées-valeurs estimées pour les trois échelles de temps étudiées : (g) moyennes annuelles, (h) moyennes de mars à mai, (i) moyennes de juin à août.
3.2.2 Water-temperature trends since 1881
The previous results suggest that it should be possible to predict annual and summer mean water temperature by studying similar information on air temperature and discharge. In the context of climate change studies in France, the long-term monthly air-temperature data series, going back to 1881 at Orléans, was validated by Météo-France [9]. The discharge has been recorded since 1863 on the River Loire at Blois. Fig. 5a–c show reconstructed (1881–1975) and measured (1976–2003) water temperature data series (annual, spring and summer mean values), the 10-year running mean of reconstructed data and one standard deviation (based on regression residuals) around the mean values.
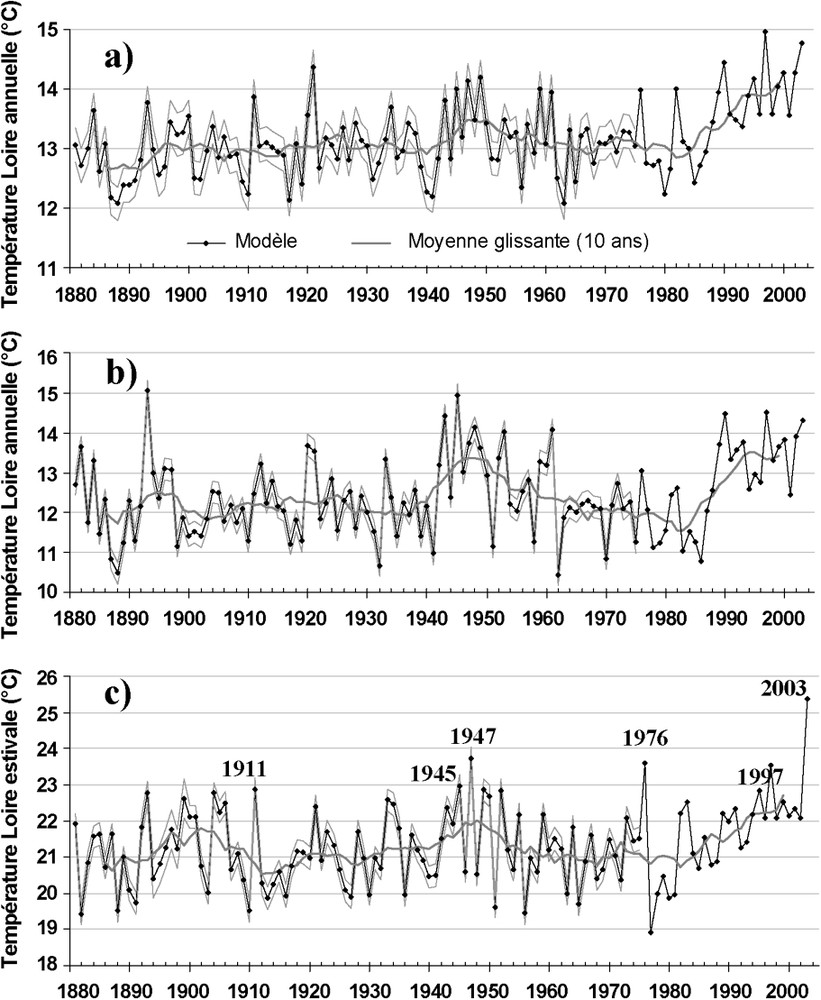
Trend in temperature changes of the middle Loire since 1881: (a) annual mean values, (b) spring mean values (March to May), (c) summer mean values (June to August). A standard error interval around the values estimated by the model (1881–1975) is shown. The smoothed curve shows a 10-year moving average.
Évolution des températures de la Loire moyenne depuis 1881 : (a) moyennes annuelles, (b) moyennes printanières (mars à mai), (c) moyennes estivales (juin à août). Un intervalle de un écart type d'erreur autour des valeurs estimées par le modèle (1881–1975) est représenté. La courbe lissée représente une moyenne mobile sur 10 ans.
Fig. 5a indicates that the highest annual mean temperatures occurred in the most recent period. For 100 years (1881–1980), the temperature of the Loire fluctuated around 13 °C, with a warmer period between 1942 and 1954. However, since 1990, it has fluctuated around 14 °C. The warmest decade was 1994–2003 with a temperature 1.1 °C higher than the inter-annual centennial mean, and 0.6 °C higher than the previous warmest decade (1942–1951). The trend of the time series for 1881–2003, defined as the linear regression slope, shows a rise of 0.8 °C over this period.
Mean spring temperatures fluctuated around 12.3 °C between 1881 and 1980, and around 12.9 °C since 1981. A warm period is clearly shown around 1945, prior to the current period. Even though the differences between these periods are not very marked, the 13 °C threshold having been reached or exceeded in 12 years in both the first warm period (out of 20 years) and since 1988 (out of 15 years), certain changes in variability can be observed. A study of the structure of the time series through analysis of autocorrelation and partial autocorrelation functions in three distinct periods (before 1930, between 1930 and 1965, and since 1965) also shows increasing persistence of warm temperatures from year to year during the recent period, while spring temperatures during the first two periods show no particular memory from year to year.
For the summer mean values, the pattern of changes in the consecutive mean shows the existence of three warm periods: around 1900, 1950 and the current period. Summers that combined drought and a heat wave are particularly remarkable (2003, 1976, 1947). Air temperatures during the summer of 2003 were considerably hotter: 0.8 to 1.4 °C above the mean summers of the five previous hottest summers (1976, 1947, 1911, 1983 and 1994). The low flow period in 2003 experienced low discharge (an average of 64.5 m3 s−1 for June–August 2003 in Blois), in spite of being supported by the reservoirs of Villerest and Naussac as early as May and benefiting from groundwater inflow from the Beauce limestone aquifer, which is typically high at the beginning of the summer. As indicated in Fig. 5b, the Loire reacted differently to the combined effects of high temperature and severity of low water flow, with warmer water (up to 1.7 to 2.4 °C) than in the five previously ranked summers (1976, 1947, 1997, 1945, 1911). We can observe that 1983 and 1944, with hot summers but less severely restricted flow (discharge above 100 m3 s−1 in Blois), are in 15th and 26th position with regard to the Loire water temperature. On the other hand, 1997, with higher than normal temperatures from as early as February, and an early and prolonged low-water period (mean annual discharge 188 m3 s−1), was similar to 1976. Likewise, the low water period of 1949, which is the benchmark for the Loire, only comes 7th due to the lower air temperatures.
Comparative analysis of the temperature series of the Loire (partially reconstituted) and air temperatures since 1881 shows very similar trends. Fig. 6a–c show the 5-year moving average of temperature anomalies, evaluated as differences between data series and the respective interannual values (1881–1980). This indicates that, compared to the complete series, the marked warming highlighted in the 1976–2003 series is also due to the particular position of the colder than normal years around 1980. During this period, the discharge was also high, as shown in Fig. 6d.

Trend of summer flows and river and air temperature anomalies from the respective inter-annual means (1881–1980). The series represents 5-year running means: (a) annual mean, (b) spring mean, (c) summer mean, (d) summer mean (June to August) in Blois.
Évolution des débits estivaux et des écarts de température de la Loire et atmosphériques aux moyennes interannuelles (1881–1980) respectives. Les séries représentent des moyennes mobiles sur 5 ans : (a) moyennes annuelles, (b) moyennes printanières, (c) moyennes estivales, (d) moyenne estivale (juin à août) des débits à Blois.
4 Conclusions
Analysis of the water temperature of the Loire for the period 1976–2003 shows a change in the energy regime with very significant rises in spring and summer (from 1.5 to 2 °C), increases being less pronounced in winter, and absent in autumn. During the summer of 2003, which combined severe low-water levels and a heat wave, the River Loire reached absolute temperature records: 25.4 °C on average from June to August, i.e. 4 °C higher than the inter-annual mean and 1.7 °C higher than 1976, a memorably dry year.
The four series analysed, over a distance of approximately 266 km, show remarkable consistency, in spite of specific local characteristics. The series at Saint-Laurent-des-Eaux differs from the others by its water which is colder in summer (1.4 °C less on average in August) and warmer in winter (0.3 °C higher on average in January), which can be explained by the inflow of groundwater from the Calcaires de Beauce aquifer. This cooling can be clearly observed through modelling this inflow in August with a discharge of 10 m3 s−1 at 13.5 °C.
Linear regression models based on monthly air temperature and discharge data are well suited to the reconstruction of annual, spring and summer series. Firstly, they explain the upward trend since 1976 as a result of both rising air temperature and decreasing discharge. In June to August, water temperatures thus increased by 1.3 °C between the two 14-year sub-periods of 1976–1989 and 1990–2003. From this model, approximately 60%of this temperature rise can be estimated to be linked to the rise in air temperature (0.8 for a 1.5 °C rise in air temperature) and 40%to the drop in discharge (0.5 °C for a 100 m3 s−1) drop in discharge). The same models used for the period 1881–2003 show that the rapid rise of water temperature observed since 1976 forms part of a slower trend over the century, marked by other warm periods around 1900 and 1950.
According to these models, the mean annual temperature of the Loire has thus risen by about 0.8 °C on average during the 20th century, a figure which is similar to that observed by Webb and Nobilis (1994) for the Danube at Linz based on probably the only long-term measured temperature series available in Europe [14]. However, the rise in temperature of the Danube occurs mainly in autumn and winter and does not appear to be linked to atmospheric warming as in the Loire but, according to the authors, to man-made changes [13,14].
Finally, the rise in temperature observed in the spring could have an impact on fish and benthic life, as has been shown in the River Rhone [5]. This period is generally considered as the breeding period for most cyprinidae populating the major French rivers and is a key period in the response of organisms to climate change. The increase in temperature observed could thus bring about a change in the population, e.g., with an increase of thermophilic species.
Acknowledgements
Authors thank to Michel Lepiller, from University of Orléans for our useful discussion on the functioning of hydrogeological systems of ‘Val d'Orléans’ and Beauce. We are also grateful to Valérie Daussa-Thauvin and Frédéric Verley from the DIREN Centre for providing us the data on temperature and discharge values of the outflows of Beauce limestone aquifers. Ghislain de Marsily and the two anonymous referees from CR are also acknowledged for their helpful comments. This study was achieved with the financial support of CNRS within the Loire Research Programme.