

Version française abrégée
Introduction
La formation des argilites du Callovo-Oxfordien de l'Est du bassin de Paris a été subdivisée verticalement en 10 niveaux lithologiques [9,13,19], que nous avons numérotés de 1 à 10 (Fig. 1). Plus de 600 échantillons cylindriques (∼10,8 cm3) ont été collectés tous les 3 à 4 m le long du forage oblique EST211, ainsi qu'au sommet et à la base du Callovo-Oxfordien argileux, à l'aide des forages verticaux MSE101 et HTM102. Ces échantillons sont préservés des perturbations physiques et chimiques liées à la proximité de la surface. Ils sont étudiés pour leur susceptibilité magnétique, leur rémanence magnétique et leur anisotropie de susceptibilité magnétique, qui sont comparées à leur concentration en sulfate, carbonate et fer (Tableau 1). Ces grandeurs permettent de préciser la nature et la concentration relative des minéraux dans le sédiment, ainsi que leur orientation préférentielle, à l'aide de l'anisotropie de la susceptibilité magnétique (ASM). On peut alors tenter de remonter à l'origine des apports sédimentaires, ainsi qu'à leur variabilité, au sein de la formation argileuse.
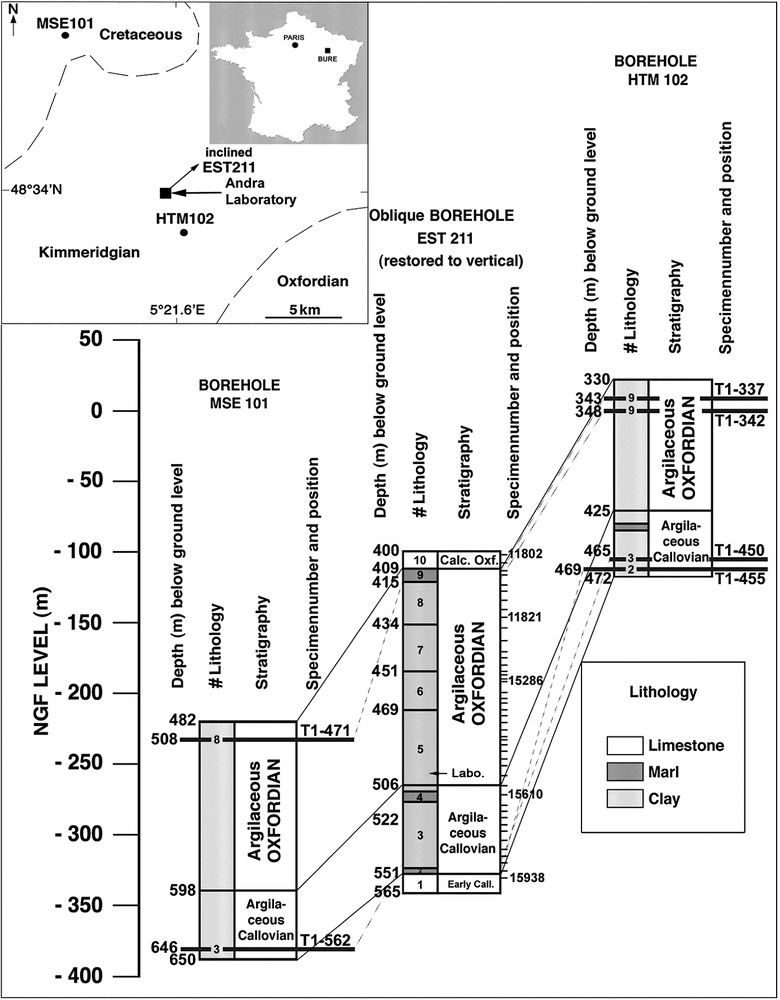
Site of the ANDRA Laboratory, localization and log of the three boreholes from which the specimens under study were collected (HMT102, MSE101, EST211).
Site du Laboratoire de l'Andra, localisation et log des trois forages étudiés (HMT102, MSE101, EST211) d'où sont extraits les échantillons de cette étude.
Magnetic data used in this study (, K, NRM, L and P: see text). For (magnetic lineations) only their azimuth has been reported since they are close to horizontal (including for the T1-471 core, for which the magnetic foliation dips 33° to the west). For the six vertical cores (T1), each lineation averages n=15–20 individual specimens (484 specimens in total). The magnetic remanence values after each NRM and ARM demagnetization between (5–20 mT), (20–40 mT) and (50–100 mT) are synthesized with the HIRM/K and S-ratio values. CaCO3, Fe2O3t and SO4 concentrations are reported in percentage, with their corresponding vertical depth below the ground level
Données magnétiques utilisées dans ce travail (, K, NRM, L, P : voir texte). Pour , seul l'azimut est reporté, car les linéations sont subhorizontales (y compris pour le tronçon T1-471). Pour les six tronçons verticaux (T1), chaque ligne est la moyenne de n=15 à 20 échantillons individuels (total : 484 échantillons). Les valeurs de rémanence magnétique restante après démagnétisation sont synthétisées pour la NRM et l'ARM entre (5–20 mT), (20–40 mT) et (50–100 mT), ainsi que les valeurs de HIRM/K et S-ratio. Les concentrations en CaCO3, Fe2O3t et SO4 sont reportées en %, avec les profondeurs verticales de mesures par rapport à la surface
Données magnétiques
Susceptibilité et rémanence
La capacité des minéraux à s'aimanter en présence d'un champ magnétique faible, mesurée par leur susceptibilité magnétique K, est comparée à leur capacité à conserver leur aimantation naturelle, ou aimantation rémanente (NRM ; Fig. 2). Sur la Fig. 3, susceptibilité et rémanence, notées et NRM*, sont normalisées au maximum rencontré dans la formation. Les valeurs de K reportées en fonction de NRM (Fig. 2) traduisent deux tendances liées à la nature des porteurs magnétiques : (1) les échantillons distribués le long de l'axe de la susceptibilité, et allant de l'origine (riche en carbonate) jusqu'aux valeurs maximales (, valeurs classiques observées sur les marges passives [12]), sont les plus riches en argiles : c'est le cas de la lithologie 5 ; (2) les échantillons plus rémanents (maximum = 1890 μA m−1), tirés vers la droite du diagramme (Fig. 2), correspondent principalement aux lithologies les plus silteuses. K et NRM, comparés aux concentrations en sulfate, carbonate et fer (Fig. 3), aident à caractériser la nature des porteurs du signal magnétique. Dans les lithologies 1 et 10, riches en carbonate, tous les paramètres (sauf le carbonate) ont de faibles valeurs. Dans la lithologie 5 déjà citée, est supérieur à NRM*, et la concentration maximum en fer souligne la dominance des minéraux paramagnétiques porteurs du fer, c'est-à-dire des argiles et, éventuellement, de la chlorite. La concentration en sulfate comparée à celle du fer et à la rémanence, aide à diagnostiquer la présence de sulfure de fer para- (pyrite) ou ferrimagnétique (pyrrhotite : Fe7S8, ou greigite : Fe3S4) [6,7,18,20]. Les valeurs élevées en sulfate, fer et celle de la rémanence permettent de soupçonner la présence de greigite : c'est le cas de la moitié supérieure de la lithologie 3. Sulfate et fer élevés, mais avec une rémanence faible, indiquent la présence de pyrite : c'est le cas de la lithologie 5 (Fig. 7b). Enfin, la concentration élevée de fer, associée à une forte rémanence, pour de faibles concentrations en sulfate, indique la présence d'oxydes ferrimagnétiques : titano-maghémite ou titano-magnétite (Fig. 7a) : c'est le cas de la transition entre les lithologies 3 et 4, ainsi que de la lithologie 7.

Magnetic susceptibility as a function of magnetic remanence. (a) Individual data with symbols referring to lithologies 1 to 10. (b) Analysis lithology by lithology; arrows indicate evolution of (K, NRM) with time.
Susceptibilité magnétique en fonction de la rémanence magnétique. (a) Données individuelles ; les symboles correspondent aux lithologies numérotées de 1 à 10. (b) Analyse lithologie par lithologie ; les flèches indiquent l'évolution de (K, NRM) avec le temps.
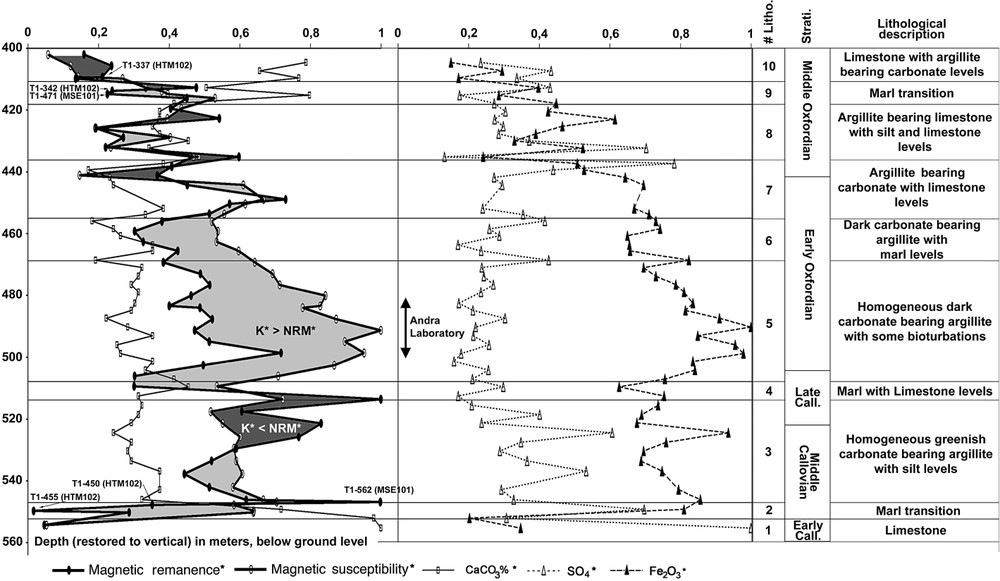
Composite log from EST211, MSE101 and HTM102 boreholes, showing the relationships between magnetic susceptibility, remanence and CaCO3 (left-hand side), and SO4 and Fe2O3 contents (right-hand side). The ANDRA lithological subdivision has been here numbered from 1 to 10. Note the location of the ANDRA Laboratory at the maximum of susceptibility (maximum clay zone). The maximum values used for the normalization are: K=196 μSI; NRM = 1890 μA m−1; CaCO3 = 100%; SO4 = 3410 mg kg−1, and Fe2O3 = 5.17%. Light-grey areas correspond to and the dark-grey ones to .
Log composite des forages EST211, MSE101 et HTM102, allant du Callovien inférieur à l'Oxfordien moyen, montrant les relations entre valeurs (normalisées au maximum rencontré : *) de susceptibilité, de rémanence magnétiques et de CaCO3 (à gauche), et les teneurs en SO4 et Fe2O3 (à droite). Le découpage lithologique est celui de l'Andra, que nous avons numéroté de 1 à 10. Noter la position du laboratoire de l'Andra, au maximum de susceptibilité (maximum de la fraction argileuse). Les valeurs maximum ayant servi à la normalisation sont : K=196 μSI ; NRM = 1890 μA m−1 ; CaCO3 = 100% ; SO4 = 3410 mg kg−1 ; Fe2O3 = 5.17%. Les zones en gris clair correspondent à et les zones en gris foncé à .
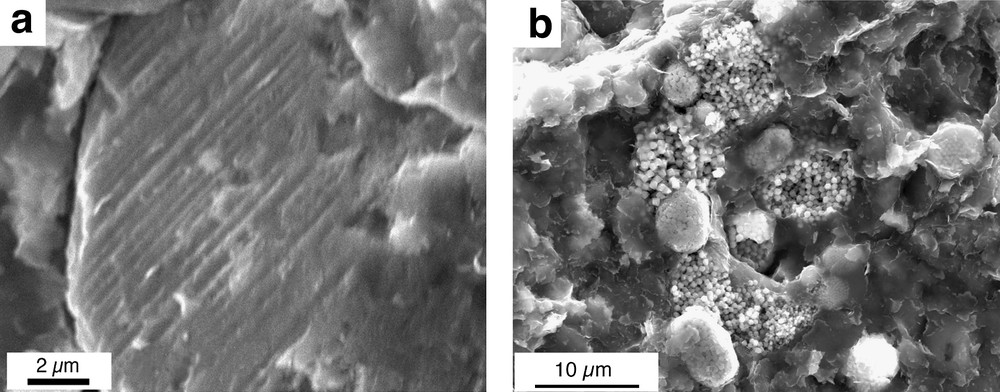
Scanning electron microscope photos of iron-rich grains in the Callovo-Oxfordian argillites: (a) detrital titano-magnetite grain (EDS determination); (b) framboids made of iron-sulfide grains (pyrite and perhaps greigite).
Photographies au microscope électronique à balayage de grains riches en fer dans les argilites du Callovo-Oxfordien : (a) grain de titano-magnétite (détermination par EDS) ; (b) framboïde composé de grains de sulfate de fer (pyrite, et peut-être greigite).
Minéralogie magnétique
La coercivité de la rémanence « naturelle » (ou aimantation résiduelle après désaimantation sous champ alternatif, AF) et « artificielle » (ou aimantation résiduelle après aimantation puis désaimantation AF) pour des valeurs de désaimantation partielle comprises entre 5 et 20 mT, 20 et 40 mT, et 50 et 100 mT, respectivement pour la faible, moyenne et haute coercivité (Fig. 4), donne des indications sur la concentration relative en oxyde et sulfure de fer. La famille de plus faible coercivité « naturelle » porte quelques pour-cent de la rémanence totale et présente des valeurs négatives (lithologies 5 et 8), signe de gyrorémanence, un effet d'aimantation spontanée oblique sur l'axe de désaimantation et attribué à la greigite ferrimagnétique [25]. La rémanence « artificielle » est principalement portée par les familles de moyenne et de haute coercivité, qui contiennent chacune 30 à 50% de l'aimantation totale. Un pourcentage égal suggère que les populations minérales sont de même nature, à la taille de grain près. C'est le cas de la lithologie 7, où les oxydes de fer semblent dominer.
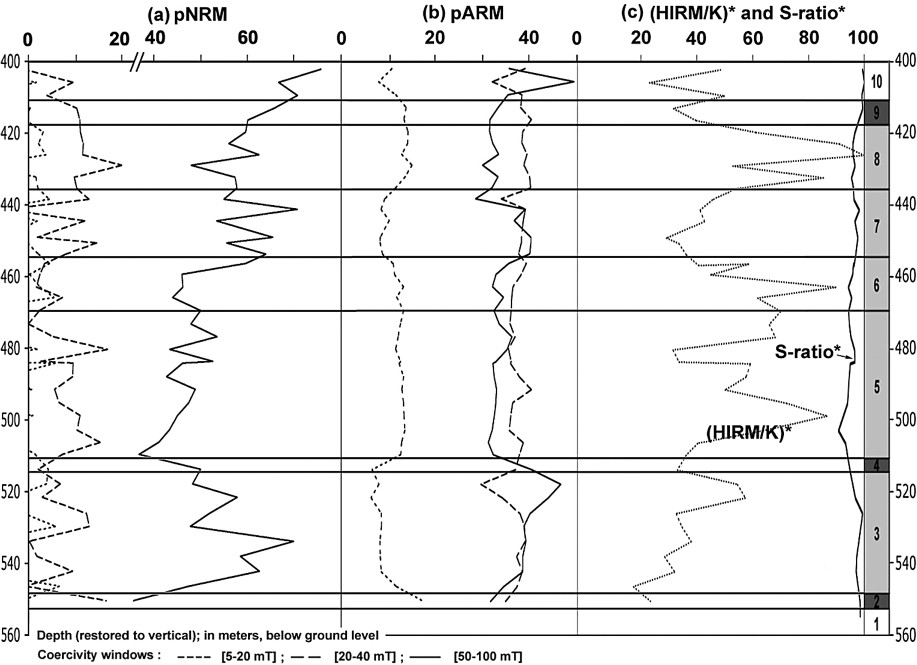
Magnetic parameters evolution for the mineralogical characterization in the Callovo-Oxfordian argillite formation (normalized and in %) used to characterize the nature of the minerals. From the left to the right: data of the partial demagnetization of the natural remanence (in the coercivity windows indicated): (a) pNRM, and artificial, (b) pARM, (c) parameters HIRM/K and S-ratio (see text) used to trace the greigite and the iron oxides.
Évolution des paramètres magnétiques (normalisés, en %) permettant de préciser la nature des minéraux de la formation argileuse du Callovo-Oxfordien. De gauche à droite : valeurs de démagnétisations partielles de la rémanence naturelle (dans les fenêtres de coercivité indiquées) : (a) pNRM, et artificielle, (b) pARM, (c) paramètres HIRM/K et S-ratio (voir texte) destinés à tracer la présence de greigite et d'oxydes de fer.
Les mesures d'aimantation sous champs plus forts (IRM) sont utilisées pour tracer la présence de la greigite via le paramètre HIRM/K [8,21] qui minimise l'influence des oxydes de fer, ou pour détecter les oxydes de fer [1,10] et/ou l'absence de dissolution sélective de magnétite via le S-ratio [8]. Ainsi, la lithologie 3 s'enrichit, pendant son dépôt, en oxydes de fer, corroborant une période d'apport silteux. La lithologie 5, la plus riche en argile, présente les plus fortes concentrations en sulfure de fer ferrimagnétique et les plus faibles concentrations en oxyde de fer, ce qui souligne une période d'absence d'apport silteux dans un milieu très réducteur favorisant la formation de grains authigènes de sulfure de fer (greigite, pyrite...).
La pétrofabrique
L'anisotropie de la susceptibilité magnétique est représentée par un ellipsoïde d'axes [2,3,15], qui permettent de calculer les paramètres suivants (ici en %) : degré d'anisotropie , anisotropie planaire , et anisotropie linéaire . Le degré d'anisotropie, principalement dû au litage des argilites parallèle à l'orientation moyenne des plaquettes d'argiles, prend sa valeur minimum dans les lithologies carbonatées. Une anisotropie linéaire, bien que peu prononcée, de 0,14% en moyenne et atteignant 0,3% dans les lithologies 3 et 7 les plus silteuses, est mesurable dans le plan du litage (Tableau 1).
Les échantillons ont été réorientés par rapport au Nord magnétique, en utilisant l'orientation du forage incliné EST211 et en postulant que le litage est horizontal, ce qui est vérifié à une exception près (T1-471). Pour les forages verticaux, la réorientation a été effectuée par la mesure du vecteur rémanent de faible coercivité, méthode classique en paléomagnétisme [4,28,29], dont l'inclinaison, très proche de celle du site de forage, est de l'ordre de +65°. L'azimut de la linéation, donné par l'axe de l'ASM, apparaît alors très constant sur l'ensemble de la formation, autour de nord–sud, à l'exception des lithologies 3 et 7, où une composante NNW–SSE semble apparaître (Fig. 5). La dispersion des azimuts a été traitée par la statistique de bootstrap (Fig. 6) [5,24]. Elle est faible (±8°) pour les lithologies riches en carbonate (1 et 10), où l'ellipsoïde est triaxial, et augmente progressivement pour les lithologies argileuses (une partie de 3, 5, 6 et 8) et silteuses (une partie de 3 et 7), pour atteindre ±20° dans les lithologies de transition (2, 4 et 9), où l'ellipsoïde est presque uniaxial planaire.
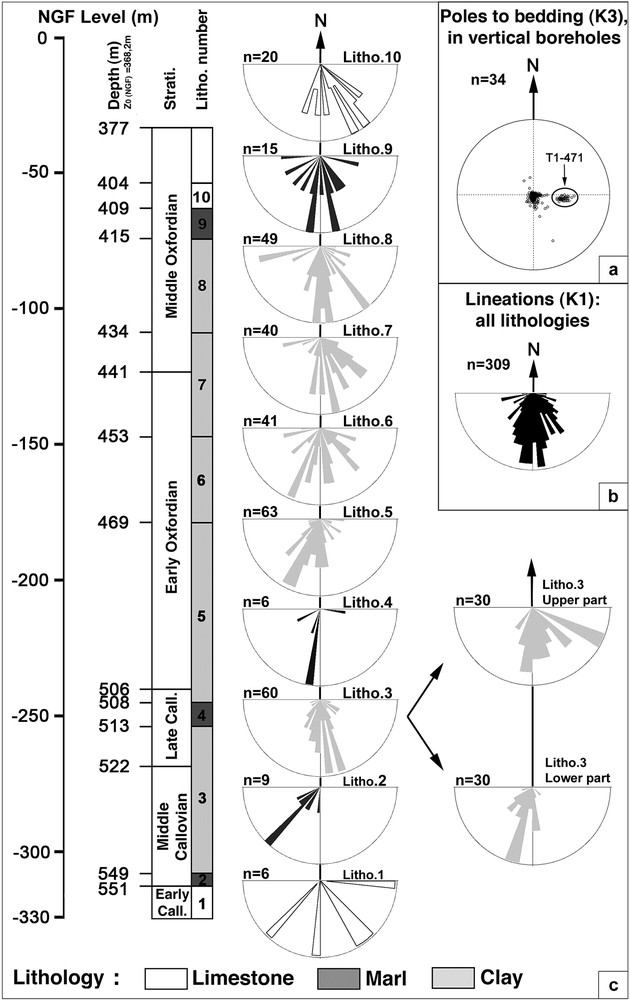
Petrofabric data of the Callovo-Oxfordian argillites. (a) Orientation diagram (Schmidt, lower hemisphere) of the poles to bedding () in the vertical boreholes. Note that measurements from T1-471 give a bedding dipping 33° to the west, a structure attributed to a sealed fracture. (b) Rose diagram (in map view) of the magnetic lineations () measured in all the 10 lithologies (309 measurements). (c) Rose diagrams of the magnetic lineations for each lithology, with a complementary subdivision for lithology 3 (see text). Note: for the six, 30-cm-long core-sections from the vertical boreholes (HTM102 and MSE101), the 9 to 15 data acquired each 10 cm have been averaged; for the inclined borehole (EST 211) the 6 data acquired each 3–4 m have been averaged.
Pétrofabrique des argilites du Callovo-Oxfordien. (a) Diagramme d'orientation (Schmidt, hémisphère inférieur) des pôles de plan de litage () des forages verticaux. Noter que les mesures de T1-471 donnent un litage penté vers l'ouest d'environ 33°, ce que nous considérons comme étant dû à l'amortissement d'une fracture. (b) Diagramme en rose (dans le plan horizontal orienté par le nord) des linéations magnétiques () mesurées dans tous les échantillons (309 mesures). (c) Diagrammes en rose des linéations magnétiques pour chaque lithologie, avec une subdivision supplémentaire pour la lithologie 3 (voir texte). Nota : pour les six tronçons de 30 cm chacun, issus des forages verticaux (HTM102 et MSE101), on a moyenné les 9 à 15 mesures effectuées tous les 10 cm. Pour le forage incliné (EST 211), on a moyenné les six mesures effectuées chaque 3 à 4 m.

AMS bootstrap statistics with mean orientation of the three main AMS axes, calculated and represented on a north-oriented diagram. Their confidence ellipses for each lithology (1 to 10) are also plotted. Histogram diagrams of each lithology are the frequencies of each one of the three main AMS tensors (i.e., AMS geometric ellipse).
Statistique de bootstrap des mesures d'anisotropie de la susceptibilité magnétique, avec l'orientation moyenne des trois axes principaux d'ASM, calculées et représentées sur diagramme d'orientation orienté par rapport au nord pour les 10 lithologies. L'ellipse de confiance leur correspondant, pour chaque lithologie, est aussi dessinée. Les histogrammes de chaque lithologie correspondent à la fréquence des valeurs du tenseur d'ASM des trois axes principaux (géométrie de l'ellipsoïde d'ASM).
Discussion
La rémanence magnétique (NRM) est très sensible à la présence de grains ferrimagnétiques, oxydes de fer (maghémite, magnétite) et/ou sulfures de fer (pyrrhotite ou greigite, mais non pyrite) [18,22,26]. Dans les sédiments contenant de la matière organique, les oxydes proviennent plutôt de la fraction détritique, alors que les sulfures sont issus du milieu réducteur, comme l'indiquent les framboïdes de pyrite (Fig. 7b), souvent observées dans les argilites du Callovo-Oxfordien [9], et parmi lesquelles les sulfures ferrimagnétiques se sont développés. L'abondance des grains ferrimagnétiques est donnée par l'écart à l'axe vertical du diagramme de la Fig. 2. Leur nature, oxyde ou sulfure, exige un examen minutieux des teneurs en fer et en sulfate (Fig. 3) ainsi que d'autres données (Fig. 4). Par exemple, les maximums de rémanence qui apparaissent à la base et au sommet de la lithologie 3 sont attribués à la présence d'oxydes de fer, car les valeurs en sulfate sont faibles pour une teneur en fer importante. Au contraire, à proximité de la transition Callovien moyen–supérieur de la lithologie 3, la rémanence, le sulfate et le fer sont importants, ce qui suggère la présence de greigite, argument renforcé par l'effet de gyrorémanence, et par un pic de HIRM/K souvent associé aux niveaux les plus riches en argile (Fig. 4). La très faible perméabilité de ces niveaux est peut-être à l'origine de la formation et/ou de la préservation de la greigite, qui semble associée à la pyrite.
Ainsi, la lithologie 3 connaît-elle un enrichissement progressif en oxyde de fer amené par la fraction silteuse détritique, dans un environnement où le sulfure de fer authigène est présent. La lithologie 5 connaît le plus fort taux d'argile autour de −490 m, riche en sulfure de fer et probablement en greigite, caractères qui diminuent progressivement jusqu'à la mise en place de la plate-forme calcaire de l'Oxfordien (lithologie 10). De courtes périodes de passées silteuses, riches en oxydes de fer, sont présentes dans les lithologies 7 à 9, mais leurs intensités diminuent avec le taux d'argile, de sulfate et de fer, en relation avec l'enrichissement en carbonate. En terme de séquence sédimentaire, et en accord avec les descriptions stratigraphiques existantes [19], la lithologie 3 apparaît comme une séquence de 3e ordre divisée en deux épisodes séparés par un changement d'intensité relative de NRM* et , qui a lieu au maximum d'inondation [19], modifiant la nature des apports sédimentaires. La lithologie 5, qui a le plus fort apport d'argile, correspond au maximum d'inondation des séquences de 2e et 3e ordre qui caractérisent le Callovo-Oxfordien.
L'analyse de la pétrofabrique montre un degré d'anisotropie planaire d'autant plus fort que le taux d'argile est important. Mais une linéation magnétique, malgré sa faible intensité (≪1%), est mesurée autour de nord–sud, sauf en ce qui concerne les lithologies riches en silt, où elle est plutôt NNW–SSE. Plutôt qu'effets de vortex, qui orienteraient les particules perpendiculairement à la direction du courant [17,27], nous interprétons ces directions comme traduisant l'orientation préférentielle des plaquettes d'argiles en zone autour d'un axe parallèle aux courants [11,12,16] issus des massifs du Nord, Bohémien et Rhénan [19,20]. La direction NNW–SSE est liée à l'alignement des grains détritiques d'oxydes de fer ferrimagnétiques autour de la direction d'un courant qui semble issu du massif de Londres–Brabant, au nord-ouest.
Conclusion
Dans cette étude, les propriétés magnétiques (susceptibilité, rémanence et paramètres magnétiques) associées à la concentration en sulfate, carbonate et fer sont utilisées comme indicateur de la nature des minéraux et des apports sédimentaires. Elles aident à préciser les principaux caractères lithologiques du Callovo-Oxfordien. Un changement des conditions de dépôt sédimentaire à la fin du Callovien, ainsi qu'une diminution de l'intensité des décharges sédimentaires silteuses pendant l'Oxfordien, sont révélés par la relation . Les données de l'anisotropie de la susceptibilité magnétique montrent la stabilité de la direction nord–sud des linéations sur l'ensemble de la formation. Celles-ci sont parallèles aux paléocourants originaires des massifs du Nord de type rhénan, bohémien et Londres–Brabant, où ce dernier fournit préférentiellement des fractions détritiques riches en silt.
1 Introduction
Boreholes undertaken in the eastern Paris Basin, in between the ‘Meuse’ and ‘Haute-Marne’ districts, give a unique opportunity to study specimens that are preserved from chemical and physical perturbations due to the proximity of the surface (hydration, oxidation...). This study concerns the dark-coloured, with organic mater, Early Callovian to Middle Oxfordian claystones, containing 35–60% clay minerals, the remaining being shared mainly by calcite and silt [13]. These clay-rich rocks are called Callovo-Oxfordian argillites [9] and, on the base of the lithological description by ANDRA and P. Pellenard [19], we have subdivided them into lithologies 2 to 9 (Fig. 1). At the base and top of this clay-rich formation, lithologies 1 (Early Callovian) and 10 (Middle Oxfordian) are dominated by limestones.
In this paper, we present (i) magnetic susceptibility and remanence intensity data, and (ii) anisotropy of susceptibility data acquired from regularly spaced specimens collected from the ANDRA borehole cores drilled in the vicinity of the laboratory. Compared with carbonate, sulfate and iron oxide contents, the former data provide information about the nature and relative concentrations of the constituting minerals, and the latter inform on the petrofabric, i.e. lattice and shape preferred orientations of the rock-forming minerals. Thus, in addition to sedimentary characters already described by other authors [13,19], our magnetic data bring new information about the nature of the sedimentary supplies, their variability within the formation, and about the possible origin of these supplies.
2 Sampling procedure
This study concerns two vertical boreholes, HTM102 (lat: ; long: ; above sea level) and MSE101 (lat: ; long: ; a.s.l.), and the oblique borehole EST211 (lat: ; long: ; a.s.l.) that cuts across the Callovo-Oxfordian argillites at the vicinity of the ANDRA Laboratory (Fig. 1). Six, 30-cm-long cylinders, 9 cm in diameter, come from HTM102 (T1-337, T1-455, T1-450, T1-342) and MSE101 (T1-471, T1-562), from the upper and lower parts of the Callovo-Oxfordian argillites (lithologies 2, 3 and 9). In addition, 46 5-cm-long cylinders come from the oblique EST211 borehole, which was sampled each 3 to 4 m (Fig. 1). A total of 600 cylindrical specimens, of ∼10.8 cm3 each, the standard volume for magnetic measurements, were collected from these borehole cores. All the specimens have been measured (Table 1) for their magnetic susceptibility and anisotropy using the KLY-3 susceptometer (AGICO Ltd), and using the JR5-A spinner magnetometer (AGICO Ltd) for their natural remanent magnetization (NRM). The LDA-3 demagnetizer/magnetizer (AGICO Ltd) was also used to measure the anhysteretic remanent magnetization (ARM) and the pulse magnetizer MMPM10 (Magnetic Measurements Ltd) for the isothermal remanent magnetization (IRM) of specimens coming from EST211.
3 Magnetic data
3.1 Susceptibility and remanence
The magnetic susceptibility (K) of a material quantifies its ability to acquire magnetization (M) in the presence of an applied inducing field (H), such that: . This ability depends on the addition of three main magnetic behaviours of the constituting rock-forming minerals: dia-, para- and ferro-magnetism sensu lato. Diamagnetism reflects the low and negative susceptibility (∼−10 μSI) that is present in any material. In our sediments, calcite and quartz principally only display a diamagnetic contribution. By contrast, para- and ferrimagnetism, mainly due to iron, display a positive susceptibility, of low intensity for paramagnetism (∼100 μSI), and of high intensity for ferrimagnetism (≫100 μSI). Silicates including iron in their lattice, such as the clay minerals essentially (smectites, illites), as well as some detrital silicates belonging to the silt fraction (chlorite, glauconite...), have a paramagnetic behaviour. Note that pyrite, the most common iron sulfide FeS2, has also a paramagnetic behaviour at room temperature. The ferrimagnetic minerals, characterized by a natural permanent, or remanent magnetization (NRM) in the absence of inducing field, consist mainly of iron oxides (titano-maghemite, titano-magnetite) that usually accompany the silt fraction, itself made of fine-grained erosional products. In addition, some iron sulfides, such as greigite (Fe3S4) and/or monoclinic pyrrhotite (Fe7S8), have also a ferrimagnetic behaviour [6,7,14,23].
The gross mineralogical nature of the different lithologies is deduced from the comparison between K, which ranges from 10 to 194 μSI, and NRM, which ranges from 61 to 1416 μA m−1 (Fig. 2 and Table 1). These values, although rather classical for marginal sea sediments (e.g., [12]), vary greatly across the stratigraphic column, as attested in the K-versus-NRM plots of Figs. 2 and 3. Within a given lithology, K and NRM vary during deposition (Fig. 2b: arrows) according to the respective supplies in carbonate, clay and ferrimagnetic fractions. The area close to the origin corresponds to the limestones of lithologies 1 and 10, and to some carbonate-enriched levels, such as in lithologies 7 and 8. High susceptibility and low remanence characterize mostly the phyllosilicates, namely smectites and illites, which are slightly iron-bearing, in addition to a few other accessory detrital silicates, mostly chlorite. Most specimens from lithology 5 (end of the Late Callovian and base of the Early Oxfordian), the richest in clay minerals, belong to this high K/low NRM category. At the onset of deposition of this lithology, a rapid increase in susceptibility is noted, up to the highest observed K values that define the maximum clay zone [13]. Then comes a rather strong increase of NRM for maximum K values, followed by a regular decrease in both K and NRM. High remanence specimens, such as mainly in lithology 3, are considered as being enriched in silt fraction, itself ascribed to detrital material made of quartz grains principally, and including some iron oxides responsible for the ferrimagnetism. However, the presence of ferrimagnetic sulfides such as greigite, likely of diagenetic origin, cannot be ruled out (see Section 3.2). The highest NRM values are restricted to the base and top parts of this lithology 3 (Fig. 3), and tentatively attributed to silt-enriched discharges. Finally, we observe that the transitional carbonate-enriched lithologies 2 and 4, located just under and above lithology 3, have K values that indicate the presence of a clay fraction, and have very low NRM values, pointing to a lack in the silt fraction.
Fig. 3 helps comparing between K and NRM (normalized with respect to the maximum values encountered in the studied specimens), on the one hand, and the normalized values of CaCO3, and total Fe2O3, on the other hand. Note that our samplings, from which K and NRM are measured, have neither the same frequency, nor the same exact localization than the chemical data that was extracted from the ANDRA database. We readily observe that CaCO3-rich lithologies (1 and 10) have the lowest K, NRM and iron-oxide values. This contrasts with the clay-rich lithology 5, where K is high, NRM relatively low, while iron is at its maximum. This high K/low NRM character in the presence of high iron content strengthens the role of paramagnetism as the main magnetic carrier. In turn, this points to the dominance of the clay minerals in the susceptibility signal, in addition to a few detrital silicate grains containing iron such as chlorite. The SO4 values, when compared with Fe2O3 and NRM, help deciphering the nature of the iron sulfide. Three main cases are distinguished: (1) dominance of the ferrimagnetic sulfide (likely greigite [23]) is suspected when high SO4, Fe2O3 and NRM values are encountered, like in the upper half-part of lithology 3. This portion of the Callovo-Oxfordian formation is also characterized by its (normalized) NRM values higher than its (normalized) K values (: Fig. 3); (2) dominance of the paramagnetic sulfide (pyrite) is likely when low NRM values are observed in presence of high Fe2O3 values, like in most of lithology 5, the richest in clay; and (3) dominance of ferrimagnetic iron-oxides (titano-maghemite or -magnetite) is most probable when SO4 is low and both NRM and Fe2O3 are high, like at the transition between lithologies 3 and 4. The nature of these ferrimagnetic carriers is tentatively refined using magnetic mineralogy methods.
3.2 Magnetic mineralogy
The coercivity of the magnetic carriers, or their ability to retain a permanent magnetization, was first tested through step-by-step AF-demagnetization up to 100 mT of one specimen every 3–4 m. Coercivity was further tested by imparting an anhysteretic remanent magnetization (ARM; AF: 100 mT and DC: 0.5 mT) followed by the same AF-demagnetization. These data were used to calculate the partial magnetizations (pNRM and pARM) remaining in-between the low- (5–20 mT), medium- (20–40 mT) and high- (50–100 mT) demagnetization windows (Fig. 4a and b) that helped to separate the mineral coercivities into three categories. Boundaries between windows were chosen on the basis of the main stable components of the natural remanence vectors, a classical palaeomagnetic technique [29]. For the sake of comparison, these boundaries were used for both types of partial demagnetization.
We observe that the low and medium pNRM windows (Fig. 4a) have very low values (∼5–10%), while the high pNRM window carries more than 50% of total remanence. The lowest pNRM window sometimes display negative values, a character pointing to a gyroremanent effect, a spontaneous oblique magnetization appearing during demagnetization [10], attributed to the ferrimagnetic greigite. By contrast, the ARM is mostly carried by the medium and high pARM windows, both of equal value and retaining ∼40% of the total remanence. This suggests that the medium- and high-coercivity windows, of both the NRM and ARM experiments, are carried by the same mineral species. They may, however, differ in grain sizes, since the NRM and ARM intensities are different [10].
Further characterization refinement was tempted using high DC-fields with a pulse magnetizer, to look for the ferrimagnetic sulfide, which has a higher coercivity than magnetite. Note that in our sediments, hematite and goethite, the highest coercivity phases are not observed, since the magnetic saturation is reached at rather low fields (≪1 T). The S-ratio ([1 − (IRM−0,3T/SIRM2T)]/2 of Bloemendal et al., [1]), where SIRM is the magnetization at 2-T DC field (pulse magnetizer) imparted parallel to the +Z axis of the specimen, and IRM−0.3T is the isothermal magnetization then imparted at 300 mT (pulse magnetizer) parallel to −Z, devoted to erase the low coercivity phases. The high values of the S-ratio (Fig. 4c), usually larger than 0.9, point to the dominance of rather low-coercivity minerals. Alternatively, according to [8], high S-ratios suggest the absence of a selective dissolution of magnetite, a character typical of low permeability sediments. The S-ratio also allows to distinguish between the lower-half of lithology 3, in which the highest values are attributed to a dominance, or preservation, of iron oxides, and the upper-half of lithology 3 and lithology 5, where smaller values point to the presence of ferrimagnetic iron sulfides (in addition to pyrite, see Section 3.1). TiFe oxides were indeed observed in lithology 3 (Fig. 6a), and framboid iron sulfides were observed in lithology 5 (Fig. 6b), with a scanning electron microscope equipped with an EDS system.
Greigite (Fe3S4) was also looked for using HIRM/K, where HIRM = (SIRM2T + IRM−0.3 T)/2 is modified from Roberts [21] in order to minimize the influence of iron oxides. In Fig. 4c, this parameter is normalized to its maximum encountered value. High values of (HIRM/K)* strongly suggest the presence of greigite. They are observed in the maximum clay zone of lithology 5, and also in lithologies 6 and 8. By contrast, the smallest values are observed in silt-enriched levels (lithologies 3 and 7), reinforcing the dominance of (titano-) magnetite in these lithologies.
4 Petrofabric data
The anisotropy of magnetic susceptibility is characterized by an ellipsoid whose principal axes are in both orientations and intensities [2,3,15]. For the scalar aspects of the anisotropy, the bulk anisotropy, and the planar and linear anisotropies, here noted in %, are the most classical magnetic parameters: , and . In our argillites, the bulk anisotropy varies from to for the carbonate-dominated lithologies (lithologies 1, 10 and part of 7), and from to for the other lithologies (Table 1). In all cases, the bulk anisotropy results mainly from to the sub-horizontal bedding of the argillites, parallel to the average planar orientation of the clay mineral platelets. Accordingly, the planar anisotropy is larger in the clay-richest rocks, in the order of 0.1 to 5%, i.e. close to the bulk anisotropy values. A linear anisotropy, however, does exist within the bedding plane, with an average value of , reaching more than 0.3% in lithologies 3 and 7, the richest in silt (Table 1).
For the directional aspects of the anisotropy, the studied core-sections were re-oriented with respect to the magnetic North, with a precision better than ±5°. For the vertical boreholes (HTM102 and MSE101), this re-orientation was performed using the low-coercivity contribution to the total remanence according to the classical palaeomagnetic techniques [4,28]. The resulting NRM vector shows a constant inclination close to that of the present north (∼+65°) at the borehole site. This suggests that the NRM vector does record the present magnetic North, which was therefore used to re-orient the core-sections. For the oblique borehole (EST211), whose azimuth and inclination were measured with a great precision (<1°), the magnetic North was reconstructed by assuming a horizontal bedding, which is true within ±3° (ANDRA database). Bedding horizontality is also confirmed in the vertical boreholes, except for core-section T1-471 (MSE101), whose planar magnetic anisotropy dips 33° to the west (Fig. 5a), which we attribute to a local compaction structure or to a blind fault.
Systematic re-orientation of the specimens allowed us to examine the orientation of the magnetic lineation with respect to the geographical frame (Fig. 5c). The magnetic lineations are found to be remarkably constant, around north–south in azimuth, all along the whole Callovo-Oxfordian formation (Fig. 5b), except principally for lithologies 3 and 7. In the upper half-part of lithology 3, and at its very base (T1-450; Fig. 1), where , the mean lineation azimuth tends to NNW–SSE (30 measurements). This contrasts with the lower half-part, silt-depleted part of lithology 3 (), where these azimuths are clearly NNE–SSW (30 measurements). The same phenomenon is observed in parts of lithologies 7 to 10, and also in lithology 1, but the statistical coverage may not be sufficient here (six specimens).
The dispersion of the directional data and their means were analysed using the bootstrap technique of Constable and Tauxe [5], already applied to marine sediments for the same purpose [24]. This numerical technique, based on a Monte-Carlo approach, repeatedly calculates the means of ‘para-datasets’ randomly chosen from the original dataset. Orientation diagrams showing the ‘bootstrapped’ means are produced, along with the 2D-dispersions of the axes of the confidence ellipses, and the frequency histograms of the ‘bootstrapped’ tensor axis values (Fig. 6). In the limestones (lithologies 1 and 10) the NNW–SSE direction of (∼160°N) has a small angular dispersion (±8°). A small angular dispersion (±10°) is also observed in lithologies 3, 5 and 6. In the other lithologies, this dispersion reaches ±20°, in particular in the transitional lithologies 2, 4 and 9, enriched with carbonate. This analysis confirms that the clay- and carbonate-enriched lithologies have north–south to NNE–SSW lineation trends, while the silt-enriched lithologies have NNW–SSE lineations trends. The histograms confirm that all the ellipsoids are strongly planar, the linear component being well-defined in the limestones lithologies (1 and 10) and decreasing from the silt-enriched lithologies (3-upper-half-, 7 and 8) toward the clay-enriched ones (2, 3-lower-half-, 4, 5, 6 and 9).
5 Discussion
5.1 Nature and status of the ferrimagnetic fraction
Remanent magnetization is a sensitive property since just a few ferrimagnetic grains suffice to confer a remanence to the rock. In sediments, the main carriers of ferrimagnetism at the origin of the increase in the NRM*/ ratio are the iron oxides (maghemite and magnetite principally) and iron sulfides (pyrrhotite, greigite) as described by [18,22,26], but not pyrite, which is paramagnetic under laboratory conditions. In our carbon-rich sediments, where rather reducing conditions are favoured, iron oxides likely belong to the detrital fraction: thus they are preferentially ascribed to the silt fraction. Remnants of titano-magnetite have, indeed, been observed with the SEM (Fig. 6a). On the other hand, these sedimentary conditions favour the authigenic growth of sulfides, as evidenced by the abundance of pyrite framboids among which the ferrimagnetic sulfides must have developed (Fig. 6b).
In the K-versus-NRM diagrams in Fig. 2, departure from the carbonate–clay vertical axis is due to the ferrimagnetic minerals. To know whether iron oxides, sulfides or both mineral species dominate requires a close examination of the other data, principally sulfate and total iron-oxide (Fig. 3). For example, the peak values of the natural remanence, which appear at the base and the top of lithology 3, are mostly ascribed to the presence of iron oxides, since sulfate has low values, whereas total iron oxide is close to its maximum. By contrast, inside lithology 3, close to the transition between the Middle and the Late Callovian, the peak value of NRM is rather due to sulfides, as suggested by the coeval large amount of both sulfate and total iron oxides. Greigite is strongly suspected of being the ferrimagnetic iron-sulfide carrier in our sediments, as hinted by its gyroremanent behaviour and also by the HIRM/K peak values (Fig. 4), which are preferentially associated with levels that are the richest in clay. The very low permeability of these clay-rich levels may be at the origin of the formation and/or preservation of greigite, which seems to be associated with pyrite.
5.2 Sedimentary evolution of the Callovo-Oxfordian
The simultaneous use of K and NRM (Fig. 2) helps us to understand the evolution of the sedimentary sequence throughout the Callovo-Oxfordian, since K represents mostly the amount of clay with respect to carbonate, and NRM, the amount of ferrimagnetic grains, ascribed either to the detrital fraction (iron oxides) or to the authigenic fraction (iron sulfides). Two main evolutions can be observed in the K-versus-NRM plot. The first one, with , characterizes all lithologies but 3 and 7, and corresponds, at the first order, to a mixture between clay and carbonate, to which a given amount of ferrimagnetic minerals is added. The second one, with , characterizes the silt-dominated sediments, typical of lithologies 3 and 7.
Lithology 3 is a third-order sequence clearly subdivided into two episodes, separated by a change in the relative intensities of NRM* and , which takes place at about the maximum flooding stage [19]. The change in the relative values of K and NRM at constant K marks a drastic change in the sedimentary conditions, from depleted to enriched with the ferrimagnetic fraction at a rather constant clay fraction. Although the SO4 values are rather high, the ferrimagnetic fraction is mostly attributed to silt supplies, since HIRM/K and the S-ratio (Fig. 4) call for the dominance of iron oxides in the presence of pyrite. Other discharges of this type are observed during the Oxfordian, marked by peaks of NRM values within lithologies 7 to 9, of decreasing intensities toward the carbonate platform (lithology 10).
A low flooding stage is marked by the carbonate-enriched lithology 4, where K and NRM are close to the minimum. By contrast, lithology 5, the richest in clay, corresponds to the maximum flooding surface of both second- and third-order sequences [19], including the maximum recorded K values of the formation, also called the maximum clay zone. This flooding is followed by a continuous decrease in susceptibility, remanence, sulfate, and iron contents, hence in clay and silt (at the exception of short discharges in silt, as noted above), the sediment being progressively enriched with carbonate up to the carbonate platform of the Oxfordian.
5.3 Message from the petrofabrics
The lattice and/or shape preferred orientation of the magnetic minerals, namely the clay minerals plus a few detrital silicates and the ferrimagnetic grains, is studied through their anisotropy of magnetic susceptibility at low field. We have seen (Section 5.1) that the paramagnetic clay fraction dominates the magnetic signal. However, at places where the NRM has high values, the ferrimagnetic fraction may play a significant role in the anisotropy signal. The planar magnetic anisotropy hence reflects mostly the strong planar organization of the clay minerals. The linear anisotropy is modest in intensity over the whole formation, from a few percent to exceptionally one third of the total anisotropy. It provides information on the preferred zone-axis disposition of the clay platelets, i.e. on the preferred axis around which these platelets rotate, or on the preferred alignment of the ferrimagnetic grains in case of high NRM values.
The planar anisotropy likely originates from the sedimentation of the clay minerals, i.e. deposition plus compaction. The origin of the linear anisotropy is not straightforward to interpret. It may represent the shear direction that the sediment underwent during or after compaction towards the basin depocentre. It may also relate to the regional stress regime at a given time. However, the sediment does not appear to have suffered any plastic deformation, as strongly suggested by numerous observations of intact sedimentary microstructures.
Our favoured interpretation is that the linear anisotropy provides information on the direction of the currents that were active during sedimentation [11,12,16]. Linear anisotropy directions that would indicate a flow perpendicular to these directions are discarded, since the very small linear anisotropy magnitudes (≪1%) exclude the possibility of vortices that characterize turbulent flow regimes [17,27]. Hence, we postulate that the linear anisotropy indeed represents the flow direction of the currents. Note however that we have no marker giving the sense of this flow. These directions are mostly trending about north–south over the whole Callovo-Oxfordian (Fig. 5b), in agreement with palaeogeographical reconstructions in which the Rhineland and Bohemian areas, respectively to the north and the northeast of the study area, are considered as source regions for the sediments [19,20]. This interpretation is strengthened by noting that the upper half-part of lithology 3 (Table 1: 513–533 m) and lithology 7, where NRM values already attributed to iron oxides are maximum, have also the highest linear anisotropies, a character that we easily explain as due to grains aligned within micro-channels of the sediment. These grain alignments were probably parallel to currents coming from either the southeast (Subalpine massifs) or the northwest (London–Brabant massif). Following Pellenard [3], the latter origin for the silt fraction is preferred, in accordance with the northerly source regions of the clay minerals.
6 Conclusion
In this study, the magnetic properties (susceptibility, remanence and some derived parameters) associated with sulfate, carbonate and iron contents are used as indicators of mineral natures and supplies in the sediment. They help to clarify the main characters of the Callovo-Oxfordian lithologies. A change in the sedimentary conditions during the end of the Callovian, as well silt-enriched discharges decreasing in intensity during the Oxfordian, are revealed by the relation . The anisotropy of magnetic susceptibility data reveals that constant approximately north–south lineation directions prevailed over almost the whole formation. They are interpreted as parallel to palaeocurrents originating from the Rhineland, Bohemian and London–Brabant massifs, the latter region being the preferential provider of the silt-enriched fractions.
Acknowledgements
L.E. thanks GdR FORPRO (CNRS) for financial support, and ANDRA for his PhD fellowship at the University of Toulouse (France), LMTG (UMR CNRS #5563). Roberto Siqueira is warmly thanked for his constant support at the magnetic laboratory of the LMTG. We also thank Dennis Lahondes, Claude Aurière, and Hervé Rebours for providing the samples from the core storage (ANDRA laboratory). This work is the GdR FORPRO contribution # 2005/01 A.