

1 Introduction
Fluorite is a rather common mineral, but optical-quality fluorite, used in infrared optics, is much rarer. Best-quality deposit in Russia, which has provided most of the optical fluorite used in the former Soviet Union, is found within the Nordvik-Taimyr salt dome caprock, located along the coast of the Khatanga Gulf (Fig. 1a). Other optical fluorite occurrences in the former Soviet Union, however of lesser quality, were in Polar Urals (Amderminskoe) or Tadzhikistan (Kulikolonskoe) [7]. Why so perfect fluorite occurs in Nordvik has been discussed for a long time. Rather old studies favoured hydrothermal deposition [4], whereas others call for low-temperature processes, namely leaching–redeposition from dolomite limestone by cold waters issued from the subsurface [8], or even the permafrost zone [6]. Clearly, the temperature of fluorite crystallisation is central to the debate, a problem which can be solved by fluid inclusion investigation.
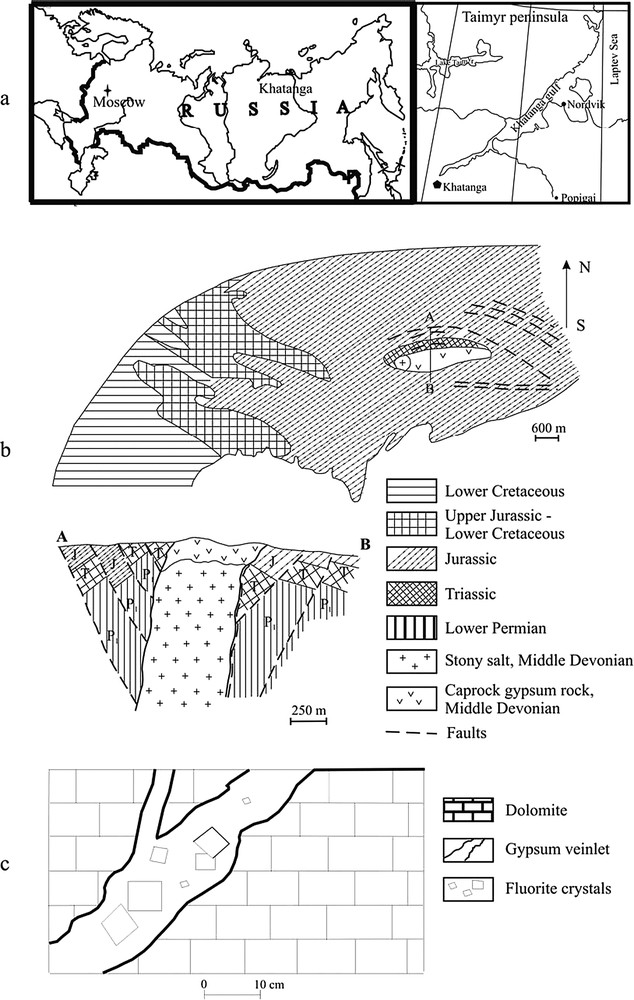
Geology of the Nordvik-Taimyr salt dome: (a) Geographical situation, (b) geological map and profile (AB) of the salt dome. Dashed lines = fracture system associated to the diapir, (c) detailed cross section in the caprock, showing the occurrence of optical fluorite within gypsum veinlets.
Géologie du dôme salifère de Nordvik-Taimyr : (a) Situation géographique, (b) carte géologique et profil (AB) du dôme salifère. En tireté : réseau de fractures, associé au diapir, (c) coupe détaillée de la zone apicale, indiquant le mode de gisement de la fluorite optique dans des veines de gypse.
2 Geological setting
The Palaeozoic Nordvik salt dome, about in size, is located on the Nordvik Peninsula, between the Nordvik and Khatanga Gulfs (Fig. 1a). It cuts a large anticline of Triassic to Early Cretaceous age, which constitutes the major structural unit of the eastern part of the peninsula (Fig. 1b). In the core of the anticline, the salt dome is topped by a complex caprock, up to 135-m thick, made of a mélange of various brecciated blocks of Cretaceous age (dark-grey dolomite and dolomitized limestone, dark-grey thin plated limestone, grey anhydrite, greenish-grey diabase, and bluish-grey clay) in a matrix of Middle Devonian gypsum. Drillings have shown that heterogeneities continue at depth, the caprock appearing as a mega breccia formed by a series of blocks, 1–30 cm in size, separated by gypsum breccias and/or gypsum sand [2].
In more detail, three zones have been identified (Upper, Middle and Lower, respectively), which all contain fluorite, typically occurring in up to 1-m long, 1–20-cm wide calcite and gypsum veinlets, cementing meter-size limestone and dolomite blocks (Fig. 1c). Another type of occurrence corresponds to more or less spherical pockets, up to 3–4 cm in diameter. Fluorite crystals, which can reach up to 4–5 cm in size, have usually a rather irregular shape, related to available growing space. Well-formed idiomorphic cubic crystals with octahedral facets are very rare; in most cases only traces of one to three cubic facets can be seen. The colour ranges from colourless through blue to light violet and violet. Rare mineral inclusions are anhydrite, dolomite, and rutile [5]. Most crystals are only semi-transparent, due to a great number of minute fluid inclusions. Only a fraction (less than 10%) are transparent and colourless enough to be suitable for optical purposes, but these are of outstanding quality. For fluid inclusion studies, six fragments from different crystals occurring within the Middle Zone have been investigated (samples 1–6, Table 1). This zone is composed of light-grey and grey gypsum, containing minute clay impurities. Well-formed dolomite rhombohedra and large (0.5–3.0 cm) trapezohedral crystals may also occur.
Microthermometric data (all temperatures). : Total homogenization; : beginning of ice melting; : first number (brackets): final solid dissolution (NaCl), second number: final ice melting (antarcticite?); : final CO2 melting; : CO2 homogenization (L: to liquid); : final clathrate melting
Données microthermométriques (températures). : homogénéisation totale ; : fusion commençante de la glace ; : premier chiffre (parenthèses) : dissolution du solide (NaCl) ; second chiffre : fusion finale de la glace (antarcticite ?) ; : fusion finale CO2 ; : homogénéisation du CO2 (L : liquide) ; : fusion finale du clathrate
| An. | Type | (°C) | (°C) | (°C) | (°C) | (°C) | (°C) | Salinity, wt.% eq. NaCl | (mol/kg H2O) | d (g cm−3) |
| Sample 1 | ||||||||||
| 1 | A | 332 | −52 | (270)–11.6 | −59.0 | 28.3 L | −29.0 | 36.0 | 0.05 | 1.06 |
| 2 | A | 324 | −55 | (267)–11.4 | −59.0 | 29.5 L | −29.1 | 35.8 | 0.05 | 1.06 |
| 3 | A | 327 | −55 | (273)–11.8 | −59.0 | 29.0 L | −27.2 | 36.2 | 0.05 | 1.06 |
| 4 | A | 335 | −55 | (271)–11.5 | −59.4 | 21.5 L | −28.9 | 36.1 | 0.05 | 1.06 |
| 5 | G | – | – | – | −58.0 | −16.2 L | −20 | – | – | 1.00 |
| 6 | G | – | – | – | −58.0 | −15.4 L | – | – | – | 1.00 |
| 7 | G | – | – | – | −57.6 | −16.2 L | – | – | – | 1.00 |
| 8 | G | – | – | – | −57.6 | −14.4 L | – | – | – | 1.00 |
| 9 | G | – | – | – | −58.4 | −16.1 L | −22 | – | – | 0.99 |
| 10 | G | – | – | – | −57.9 | −15.5 L | −21 | – | – | 1.00 |
| 11 | M | n.d. | −55 | n.d. | −57.6 | −9.8 L | – | – | – | – |
| 12 | M | n.d. | −55 | n.d. | −58.1 | −12.3 L | – | – | – | – |
| 13 | M | n.d. | −55 | n.d. | −58.0 | −11.1 L | – | – | – | – |
| 14 | M | n.d. | −55 | n.d. | −58.3 | −13.7 L | – | – | – | – |
| Sample 2 | ||||||||||
| 15 | A | 281 | −51 | (170)–12.2 | −59.0 | 30.5 L | −26.6 | 30.5 | 0.04 | 1.03 |
| 16 | A | 279 | −55 | (168)–12.7 | −59.1 | 31.0 L | −26.1 | 30.4 | 0.04 | 1.03 |
| 17 | A | 282 | −54 | (170)–12.4 | −59.0 | 29.3 L | −26.4 | 30.5 | 0.04 | 1.03 |
| 18 | A | 283 | −55 | (179)–12.1 | −59.3 | 28.8 L | −26.2 | 30.9 | 0.04 | 1.03 |
| 19 | A | 284 | −52 | (176)–12.3 | −59.0 | 29.9 L | −26.7 | 30.7 | 0.04 | 1.03 |
| 20 | A | 285 | −51 | (171)–12.8 | −58.9 | 30.3 L | −26.1 | 30.5 | 0.04 | 1.03 |
| 21 | G | – | – | – | −59.3 | −15.9 L | – | – | – | 0.96 |
| 22 | G | – | – | – | −62.0 | −18.3 L | – | – | – | 0.90 |
| 23 | G | – | – | – | −58.2 | −14.8 L | – | – | – | 0.98 |
| 24 | G | – | – | – | −58.1 | −15.9 L | – | – | – | 1.00 |
| 25 | M | n.d. | −55 | n.d. | −58.2 | −10.3 L | – | – | – | – |
| 26 | M | n.d. | −55 | n.d. | −58.5 | −7.2 L | – | – | – | – |
| 27 | M | n.d. | −55 | n.d. | −57.7 | −11.4 L | – | – | – | – |
| Sample 3 | ||||||||||
| 28 | A | 314 | −54 | (246)–12.1 | −58.9 | 28.9 L | −26.1 | 34.4 | 0.05 | 1.04 |
| 29 | A | 308 | −55 | (241)–11.9 | −59.0 | 29.0 L | −25.4 | 34.1 | 0.05 | 1.05 |
| 30 | A | 303 | −53 | (238)–11.8 | −59.0 | 29.2 L | −25.9 | 34.0 | 0.06 | 1.04 |
| Sample 4 | ||||||||||
| 31 | A | 298 | −53 | (224)–12.2 | −59.3 | 29.4 L | −26.5 | 33.1 | 0.06 | 1.05 |
| 32 | A | 299 | −55 | (229)–12.0 | −59.1 | 29.8 L | −25.8 | 33.5 | 0.05 | 1.06 |
| 33 | A | 293 | −52 | (216)–11.9 | −58.8 | 29.7 L | −25.3 | 32.7 | 0.06 | 1.04 |
| 34 | A | 290 | −55 | (208)–11.8 | −59.1 | 29.5 L | −25.7 | 32.3 | 0.06 | 1.05 |
| Sample 5 | ||||||||||
| 35 | A | 287 | −54 | (194)–11.7 | −58.9 | 29.5 L | −24.6 | 31.6 | 0.05 | 1.03 |
| 36 | A | 285 | −55 | (190)–11.8 | −59.2 | 29.8 L | −25.6 | 31.4 | 0.06 | 1.04 |
| Sample 6 | ||||||||||
| 37 | A | 282 | −55 | (182)–12.1 | −59.1 | 30.0 L | −26.0 | 31.0 | 0.06 | 1.03 |
| 38 | A | 285 | −52 | (176)–12.0 | −58.9 | 30.2 L | −25.7 | 30.7 | 0.05 | 1.04 |
| 39 | A | 280 | −54 | (181)–11.8 | −59.2 | 30.1 L | −26.3 | 30.9 | 0.06 | 1.05 |
3 Analytical techniques
Fluid inclusions have been studied in double polished plates (typical size: ), first optically, then by microthermometry using a THMSG-600 ‘Linkam’ freezing-heating stage equipped with Olympus-80 objective at IGEM, RAS. Precision at low temperature (cooling) is about 0.7 °C, reaching about 2 °C at high temperature (heating). Salinity in aqueous fluids was estimated from final ice melting temperature () and/or halite dissolution temperature (), according to the procedure described, e.g., in [5].
Gas composition was checked beside microthermometry by Raman analysis at the ‘Centre de recherches sur la géologie des matières premières minérales et énergétiques’, UMR CNRS G2R–‘Université Nancy-1’, France, using a spectrometer Dilor RTI-30 (J. Dubessy, analyst).
Bulk inclusion analysis by gas chromatography and ion chromatography has been carried out in the Vernadsky Institute of Geochemistry and Analytical Chemistry, Russian Academy of Science, Moscow, Russia. The first technique used a chromatograph ‘Tzevet-100M’ (O.F. Mironova, analyst). The second one used a chromatograph ‘Tzvet 3006’ (N.I. Savel'eva, analyst). The detection limit of the technique is 0.001 μg μl−1.
4 Observations at and microthermometry: A, G and M fluid types
Each plate contains up to hundred inclusions, roughly identical in all six studied samples. All inclusions are isolated (primary) or short trail-bound (pseudosecondary) within the crystal host. There is no sign of fluids having been introduced from outside, but also no clear relations with the crystal growth zones. The sub-idiomorphic shape of the fluorite, growing in open cavities, indicates however that all fluids must have been present during the crystallization of fluorite, a fact that does not preclude the possibility of major post-trapping changes after initial trapping (notably for the pseudo-secondary inclusions). Three fluid types have been identified, based on phase relations at room temperature and microthermometric behaviour (Fig. 2).
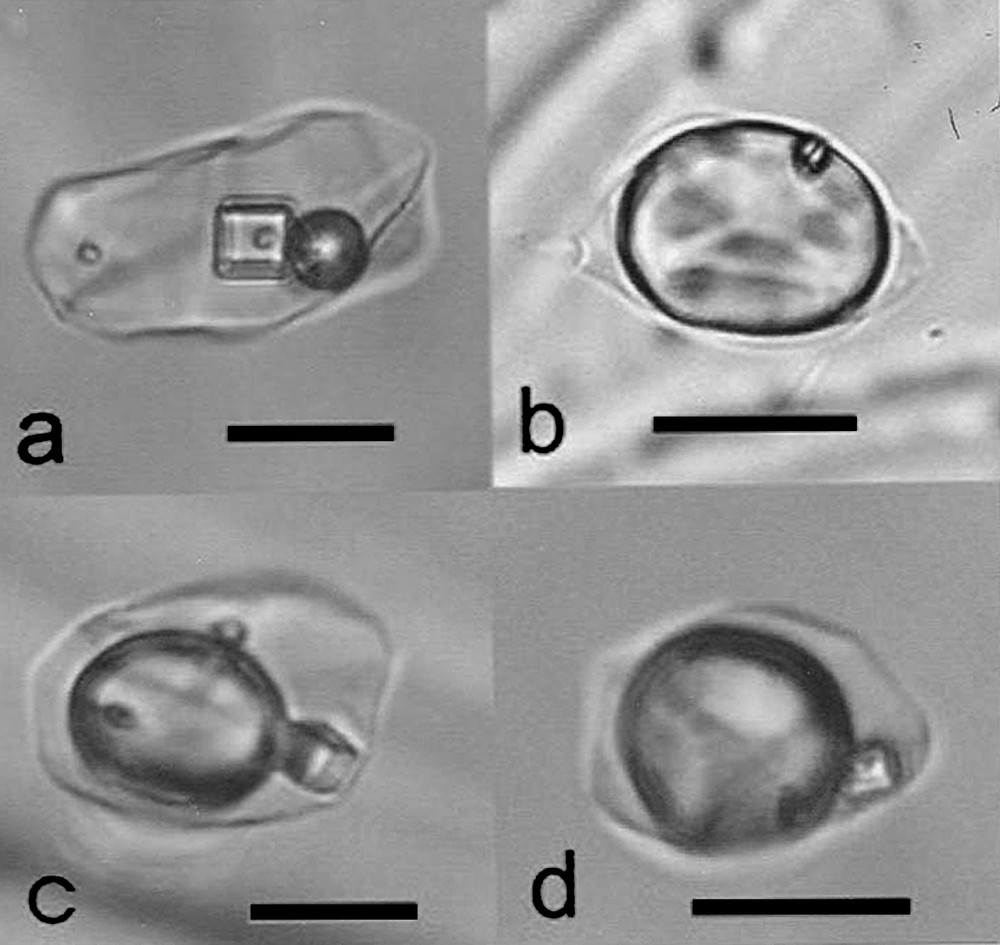
Fluid inclusions in optical fluorite (all photographs taken at room temperature). Cube = NaCl, small rounded solid = native sulfur: (a) type A, (b) type G, (c) and (d) type M. Length of the bar: 20 μm.
Inclusions fluides dans la fluorite optique (toutes photographies à température ambiante). Cube = NaCl, petit solide arrondi = soufre natif : (a) type A, (b) type G, (c) et (d) type M. Longueur du trait : 20 μm.
Type-A corresponds to inclusions, 5 to 35 μm in size, containing at room temperature a cubic halite crystal and a spherical bubble of comparable size, each roughly 10–15% of total volume (Fig. 2a). A dark globule occurs almost systematically within halite, determined as native sulphur [5]. The gas bubble frequently shows an internal meniscus, disappearing (to liquid) upon slight heating (subcritical CO2, cf. Table 1). Few inclusions contain minute anisotropic solids, which dissolve progressively upon moderate heating at 330–335 °C. Their composition remains unclear.
The behaviour of type-A inclusions upon freezing-heating is quite complex, described on the basis of 22 representative inclusions listed in Table 1 (all temperature symbols identical in the text and table). Upon freezing of the liquid, which occurs suddenly in the −70/−100 °C T-range, the gas bubble frequently disappears, due to the expansion of ice. Then, upon slow-rate heating, CO2 melting (when seen) occurs around −59 °C (). Then, the first droplet of liquid (eutectic melting) appears at −51/−55 °C, together with the formation of a rounded isotropic phase, which disappears between −11.6 and −12.8 °C. This can be taken as final ice melting (), even if the refractive index of the dissolving solid remains somewhat higher than the enclosing liquid. It can thus be supposed that this ‘ice’ is a salt hydrate, most probably Ca-bearing (antarcticite?). It can also be seen that at these low temperature halite has turned to hydrohalite, which again will revert to halite between 0 and +5 °C. Upon ice melting, the gas bubble does not reappear immediately. Firstly, an irregular white mass can be seen, which disappears progressively (but rapidly) between −26 and −29 °C, together with the reappearance of the spherical bubble. Sometimes, minute bubbles are expelled from this disappearing mass, immediately merging with the large bubble: typically a gas hydrate (clathrate), to be expected in this type of inclusion (temperature of clathrate melting).
Upon further heating (), the first phase change to be seen is CO2 homogenization (to liquid, +28.3 to +36 °C), then dissolution of the halite cube (, number in brackets) between 171 and 273 °C, and finally total homogenization (to ) between 279 and 332 °C.
Type-G inclusions are gas-dominated, with only a small quantity of liquid water at both inclusion ends (Fig. 2b). Frequently this liquid phase is not visible, making only a thin film of the walls of the cavity. Its volume remains always below about 10% of the total volume. Most inclusions contain a small rounded solid, assumed to be sulphur, which typically adheres to the internal boundary of the gas meniscus (Fig. 2b). Microthermometry data are simpler than for A-type inclusions. In inclusions where a liquid phase is visible at room temperature, a solid appears at about −40 °C (freezing), which melts between −22 and −20 °C, in a somewhat indistinct and erratic way. Like for A-type inclusions, it can be assumed that this solid is a clathrate, but results were too imprecise to be reported in Table 1. Phase transitions are more clearly visible in the large gaseous bubble, with sudden freezing at about −100 °C (solid about 50% cavity volume), final (solid) melting between −58 and −62 °C, in most cases after a short, but distinct melting trajectory (, Table 1), and homogenization, always to liquid, between −14.4 and −18.3 °C (, Table 1).
Type-M inclusions combine all features of A- and G-types. The volume of the gas bubble ranges from 20 to 70 vol.%, and all solid phases may be present, either halite or sulphur (Fig. 2c and d). Microthermometric data are also comparable to the two other types: eutectic temperature is −55 °C (, Table 1) and CO2 homogenizes at −13.7 to −7.2 °C into liquid (, Table 1) with CO2 melting temperatures (, Table 1) between −58.5 to −57.6 °C. These data indicate that type-M inclusions are nothing but mechanical mixtures between Types A and G fluids, which must have both existed together at the time of the crystal growth.
5 Discussion and interpretation
5.1 Fluid composition
Direct observation and microthermometry data indicate that the liquid phase (at room temperature) in all inclusions is basically H2O (with a considerable amount of dissolved ions), the solid(s) dominated by NaCl and the gas phase by CO2. Microthermometric data, notably the melting trajectory and deviation from CO2 triple point (−56.6 °C) for G-type inclusions, indicate however that fluid systems are not pure. This has been confirmed by Raman or bulk chromatographic analysis. In G-type inclusions, Raman analysis has shown the presence of significant quantities of H2S, in the order of 0.8/0.9 mol%. Gas chromatography (on bulk samples) has shown the presence of small quantities of CO, mostly in Type A (and M) inclusions. Ion chromatography, on the liquid phase separated from inclusions, has only detected chlorine ions, in large amounts (292 g/kg H2O). These data, as well as the frequent occurrence of native sulphur, notably within halite crystals, indicate a significant amount of this element in the fluid system. Keeping these complexities in mind, as well as the rather large variations in temperatures of phases changes and relative volume, it is possible to express an average fluid composition (in NaCl salinity equivalent) for A-type fluid as 30.4–36.1 wt% NaCl equivalent [1]. Density of this fluid (d, Table 1) is 1.03–1.06 g cm−3. The density of G-type fluids is difficult to estimate, due to the presence of other components than CO2 in the system. But quantities detected by Raman (less than about 1 mol%) remain small enough to have only a minor influence on the fluid density. This is also indicated by the maximum homogenization temperature recorded in G-type inclusions (36 °C), only 5 °C higher than the CO2 critical temperature. The density of G-type fluid can thus be estimated from pure CO2 which would homogenize at the same temperature (CO2 equivalent). Results (d, Table 1) are between 0.90 and 1 g cm−3, only slightly lower than for A-type fluids (1.03–1.06 g cm−3). They have important consequences:
- – the ‘gas-dominated’ inclusions at room temperature (G-type) contain indeed a large dark, monophase bubble having at first sight the appearance of a low density gas (or vapour). Liquid/vapour transition occurs upon cooling, hence this fluid at room temperature is supercritical. But its density corresponds to a liquid, not to a gas;
- – in the fixed inclusion volume, this fluid exerts a high internal volume of the walls of the cavity, more than 100 bar at room temperature, increasing rapidly with temperature along the isochore [3]. If inclusions are broken, e.g., by crushing a fragment of fluorite in oil between two glass plates, this ‘gas’ has a large expansion capacity, tiny inclusions forming large bubbles moving through the oil.
5.2 Hydrothermal fluids: immiscibility, depth of unmixing
Total homogenization temperature of A-type inclusions is about 300 °C, which for these inclusions corresponds to a minimum trapping temperature. Clearly, these results are completely incompatible with a cold subsurface source, either the surface itself or, even more, the permafrost zone. In this respect, fluid inclusion data give an immediate answer to the question raised in the introduction: the deposition of optical fluorite results from hydrothermal fluids, in line with the old hypothesis of L.P. Smirnov and L.P. Sidorchuk [4]. These fluids did constitute a heterogeneous system at the time of trapping, either liquid (A-type) or gas (G-type) dominated: a clear case of fluid immiscibility [3]. A temperature of about 300 °C applied to the high-density, G-type inclusions would give a pressure of several kilobars, completely unrealistic in the local environment (also, very different from pressure at total homogenization of A-type). Unmixing must have occurred at depth, and a rough estimate based on an hypothetical homogeneous H2O–CO2–NaCl fluid system [3], assuming an equal quantity of G- and A-fluids, indicates a minimum pressure at unmixing of 2 kbar, corresponding to a depth of at least 5 km (lithospheric pressure regime). Then fluids must have migrated separately, and the small density difference suggests that the relatively lighter fluid (G-type) has risen slowly within the fluid column, remaining in close contact with A-type fluid for a long time. The strong pressure exerted by the G-type fluid must have led to constant fracturing and healing, explaining the abundance of mixed (M-type) inclusions. This situation can be compared with other examples of fluid immiscibility, involving comparable fluid systems, but occurring at higher temperature. Best examples are found in shallow granite intrusions (Cu-porphyries), in which boiling fluids released from the crystallizing magma cause intense fracturing and initiate a widespread convecting hydrothermal system [3]. Temperature in the present case was much lower (300 against about 700 °C), and any externally-derived aqueous fluid will immediately be absorbed by the salt diapir: no way to initiate any convective system, like for Cu-porphyry intrusions. Fluid-induced fracturing is however clearly visible, through the spectacular radial network of fractures developed around the diapir. It can then be hypothesized that the expansion capacity of the gaseous phase has provided a lot of energy to the rising diapir, helping it to reach its intrusive character.
6 Conclusion
Fluid inclusion data confirm without any ambiguity the hydrothermal origin of the optical fluorite occurring within the Nordvik-Taimyr salt dome caprock. Fluorite was deposited at a temperature of about 300 °C from an immiscible fluid mixture of salty brine and dense CO2. Other optical fluorite deposits are indeed formed at significantly lower temperatures (120 to 200 °C for Amderminskoe, 110–230 °C for Kulinkolonskoe), from low-salinity aqueous fluids (3–7 wt% eq. NaCl) [7]. High formation temperature and high salinity fluids can thus explain the clarity and crystalline perfection of the Nordvik optical fluorite. Moreover, it is suggested that the dense CO2 fluid, which has originated by unmixing of a homogeneous CO2–H2O–NaCl (dominantly) fluid phase at a depth of several kilometres, has significantly contributed to the intrusive character of the salt diapir.
Acknowledgements
This study was supported by Russian Foundation for Basic Research (Project 04-05-65119). During reviewing, critical comments by Louis Raimbault and Michel Cuney are greatly appreciated.