

1 Introduction
The agglomeration of Khartoum, Omdurman and Khartoum North, in central Sudan, with more than 7 millions inhabitants, is confronted with a drastic shortage of freshwater supply both from the rivers and the shallow aquifers. Human activities contribute to the pollution of the rivers that run through the agglomeration. During the high-water seasons (May–August), tap water quality is faced with the problems of suspended materials.
Many wells were drilled in the Khartoum, Omdurman and Khartoum North areas to face shortages and overcome the poor water quality during the high-water seasons. As a result of many years of investigation and exploration of groundwater, it has been possible to identify deeper freshwater aquifers in several favourable areas. However some deep groundwater and some superficial areas have salty water with variable TDS contents. The chemical characteristics vary in a very complicated way and are known in some areas only. Therefore, it is very important to use efficient exploration techniques to delineate the extent of such variation, not only near the surface, but also in depth.
Vertical electrical sounding has been widely used and has played a significant role in groundwater geophysics [3,4,9]. Owing to the straight contrast of resistivity between a freshwater aquifer (a few hundreds ) and a saline water aquifer (a few ), the efficiency of the vertical electrical sounding method lies in the direct correlation, in simple cases, of the measurements with important data of groundwater quality. The investigation depth of this method is some 1/4–1/10 of the distance between the current electrodes with the Schlumberger array. A total number of 35 soundings were carried out in the study area (Fig. 1). Well logs of 30 drilled well were made available for this study.
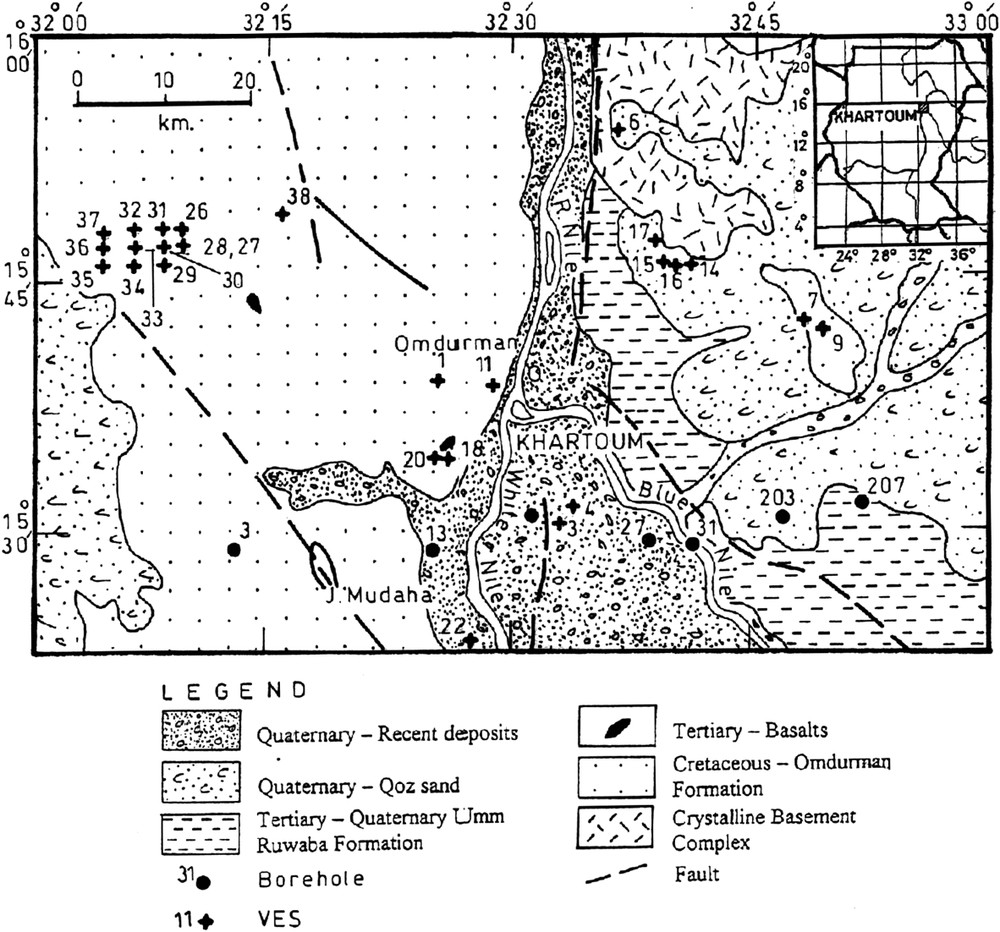
Location of the study area, simplified geological map, VES and drilled-holes locations.
Localisation de la zone d'étude, carte géologique simplifiée, position des sondages électriques verticaux et des forages.
2 Tectonic and geologic setting
The study area represents the northern part of the Great Blue Nile rift, which extends in a NW–SE direction [7,8]. It forms an integral part of an intra-continental basin in the region. The rapid rifting and subsidence rates have assisted in filling the basin with a thick sequence of siliciclastic sediments. East–west- and north–west-striking normal faults are the prominent structural features in the area.
The oldest rock unit in the Khartoum area is considered to be of Precambrian to Early Palaeozoic age [10]. It is overlain by a sedimentary sequence consisting, from the oldest to the youngest, of the Omdurman Formation, the Umm Ruwaba Formation and Quaternary-to-Recent unconsolidated sediments. The Omdurman Formation is essentially formed of sandstones with mudstone layers. The Umm Ruwaba is comprised of deltaic, lacustrine, fluvial sediments that occupy the triangular area between the White Nile and Blue Nile, this unit being masked by Quaternary and Recent sediments. The Umm Ruwaba Formation is mainly formed of unconsolidated gravels, sands, silts and clays.
The tectonic trough began to subside in the Late Tertiary. Basalts in the forms of sills and local eruptions of small volcanic plugs took place during the Tertiary and Quaternary times.
In the study area, several drilled boreholes tapped water-bearing zones in the Omdurman Formation and other sedimentary units; however, water-bearing horizons within the Umm Ruwaba Formation were characterized with high total dissolved solids and salty water was encountered in some places, possibly due to the presence of kankar (calcareous nodules).
3 Data collection and processing
The data used in this study includes 35 VES and 30 drilled borehole logs. The data was sourced from the Groundwater Information Centre of the Ministry of Irrigation of Sudan. The locations of VES points and boreholes are shown in Fig. 1. The measurements were made using the SAS 300 resistivity unit. The AB/2 extended up to 1200 m. The VES data was interpreted by the IPI2Win software [2]. The curves were adjusted so that the error is less than 5%. The interpreted layering and resistivity values were further processed by the RockWorks software [5]. Using inverse distance and declustering algorithm, the data was interpolated and presented in a block diagram. To better show the distribution of resistivity at 50-m depth intervals, four slices were constructed from the block diagram.
4 Subsurface geology
The subsurface geological information on the study area was made available from records of geological logs obtained from 30 drilled wells.
This information was confined to the penetrated depths [1]. Most of the wells in the study area are 18–22.4 cm in diameter and were drilled using rotary rigs. The lithological description shows the multilayer nature of the sedimentary system. It is composed mainly of a succession of detrital materials, of sandstones and mudstones, with some localized conglomeratic and pebbly layers. The cementing material includes siliceous, clayey and sometimes calcareous minerals. The vertical thickness of the sandstone layers vary from less than 5 m to some 60 m, the mudstone layers being of less than 1 m to some 150 m in thickness. The horizontal variation of these sedimentary layers reflects facies changes possibly due to structural factors such as synchronic subsidence of the basin, and to other sedimentological factors related to provenance, palaeoenvironments, water depth, palaeocurrent magnitudes and directions.
Groundwater was found available in three main water-bearing sandstone layers. The average hydrogeological properties collected from results of pumping and recovery tests carried out on the above drilled wells are summarized as follows: transmissivity values are in the range 8.7–490 m2 d−1, hydraulic conductivity varies from 0.12 to 7.82 m d−1 and the storage coefficient was found in the range of 10−4 to 10−1 [1]. The detailed picture of the subsurface is illustrated in Fig. 3a.

Selected (a) drilled-holes logs, (b) geoelectrical VES.
Choix de quelques coupes de forages (a) et de sondages électriques verticaux (b).
5 Vertical electrical soundings
The results of 35 VESs are presented in Figs. 2 and 3b. The resistivity curves are classified into four general types. These types are five-layer, four-layer, three-layer and six-layer earth models. They represent 40, 30, 20 and 10% of the total resistivity curves, respectively. The subsurface geology discussed earlier has shown that the stratigraphy in the study area is almost horizontal. The assumption of a layered model is thus justified. Using the interactive software IPI2Win and a multiplayer 1D model, the resistivity and the thickness of each layer were successfully modified until the theoretical VES curves have a best fit with the experimental VES curves at each station.
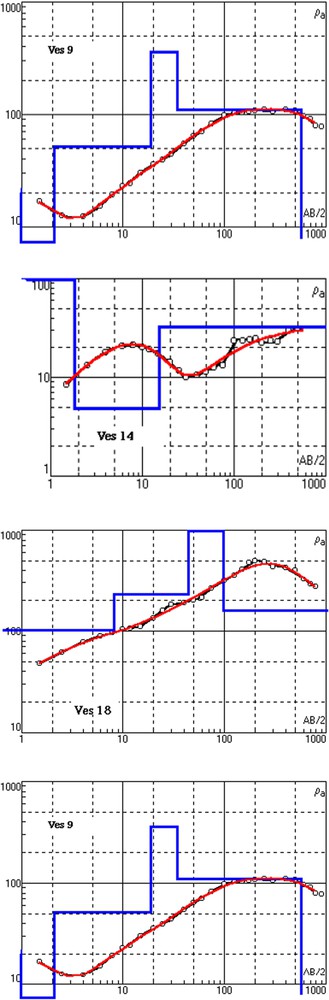
Representative VES curves.
Courbes résistivité–longueur de ligne de quelques sondages électriques représentatifs.
The results of selected stations are summarized in Fig. 3b in the form of geoelectric cross-sections corresponding to the VES results and geological well logs. The VES geoelectrical cross-section gives more details and is more sensitive to shallow structures than the geological description of the well logs. It is therefore possible to correlate the geoelectric cross-section with the stratigraphy. Resistivity is a function of porosity, saturation and salinity. Low resistivity values within the same detrital geological layer with the same physical characteristics correspond to mudstone and/or a saline water aquifer. Both are good conductors. Fresh groundwater can be indicated by relatively high resistivity values. The crystalline basement does not contain any interesting aquifer and is highly resistive.
6 Electric tomography
The interpretation of the VES and the drilled-well logs presented above provided an electrical image of the underground structure from the surface until a depth of 200 m. It was then possible to realize an electric tomography by drawing resistivity maps at different depths. Fig. 4 shows four layers or maps corresponding respectively to depths 50, 100, 150 and 200 m and covering the entire surface of the study area.
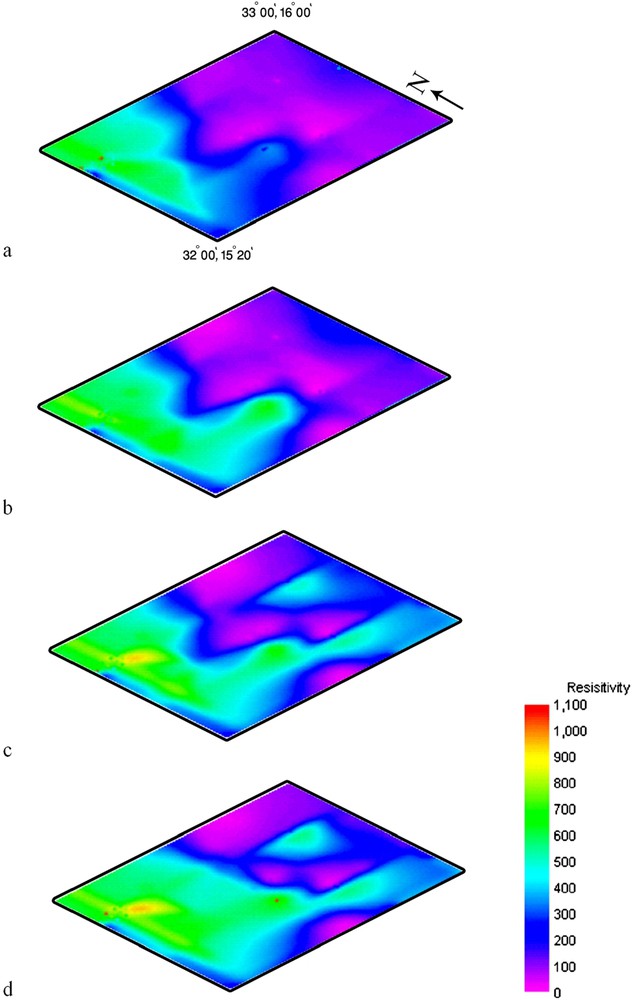
Electric tomography of the study area: resistivity maps at four depths: 50 m; 100 m; 150 m; 200 m.
Tomographie électrique de la zone d'étude : cartes de résistivité vraies à quatre profondeurs : 50 m, 100 m, 150 m, 200 m.
6.1 50-m depth
A low resistivity zone of less than (rose colour) is shown on the eastern part of the study area (Fig. 4a). This zone corresponds to the Omdurman area and the area east of the River Nile. In Omdurman, mudstones dominate at this depth. At the far eastern border of the map, a relatively lower resistivity zone is explained by the presence of saline water in the vicinity of the Sheikh Al Amin Balla village [6]. Towards the west, a relatively higher resistivity zone is encountered and marked with blue, sky blue and green colours . This cover constitutes an excellent freshwater bearing horizon in higher relief areas.
6.2 100-m depth
The low resistivity zone shown above in the eastern part seems to decrease in its surface extension (Fig. 4b). The higher resistivity covers a wider area in the western part. An even more resistive band, running in the north–south direction, appears in the far western border. It acquires light green to yellow colour on the map.
6.3 150-m depth
The rose and violet colour zones diminish largely and become more localized (Fig. 4c). Fresh groundwater is encountered all over the study area away from this zone, with the exception of the far-west highest resistivity areas. This far-west area seems to be devoid of groundwater saturation. A semicircular yellow batch is most likely reflecting the basaltic intrusion of the Tertiary period. Basalt intrusions of saucer-shape have been identified earlier [1] at Jebel Toriya.
6.4 200-m depth
The low-resistivity zone in the east has now shifted and becomes localized in two small batches, one to the southern border of the study area and the other towards the far east (Fig. 4d). The higher resistivity neck becomes very distinctive in the west. A very small circular spot of high resistivity appears as well towards the centre. This may correspond to another small basaltic neck.
7 Discussion and conclusions
For more than three decades geological investigation has devoted great efforts to explore groundwater in the Khartoum area away from the River Nile. We have been confronted by the presence of mudstones and/or saline water in the area [1]. The application of the Vertical Electrical Sounding method was challenged when mudstones and/or saline water were present. The distinction between the two was a difficult task.
In the present paper, a combined VES/Well log data gives a good electric image of the ground structure from the surface until a depth of some 200 m. Geological information from drilled wells provided good constraints on the stratigraphic interpretation of the geoelectric results. The resulting electric tomography is made of electrical images in horizontal planes at different depths. The methodology is less expensive and gives a clear sound picture of the subsurface. The electric tomography constitutes an interesting and cheap methodology for the qualitative evaluation of groundwater resources in the Khartoum area and possibly for other similar areas in Sudan, and in arid regions in general.
Acknowledgements
The authors are greatly indebted to Mr. M. Hassan Ibrahim (Aldoory) and Mr. M. Al-Kabir from the Groundwater Information Centre, Ministry of Irrigation and Water Resources of Sudan. Mr. Aftab Aziz is acknowledged for drafting the line drawings. M. Al-Yousef has kindly helped in preparing Fig. 4. G. de Marsily, Professor at the University Paris-6, is highly acknowledged for reviewing this manuscript.