

Two modifications of the original Table 2 (p. 231) are necessary:
- – the whole line of Tb contents is missing (between Gd and Dy lines), without any consequences for the Rare Earth Elements (REEs) distribution patterns of Fig. 6 (p. 234);
- – 6 out of the 23 Ce anomaly values are wrong, and must be modified as indicated in the Table; accordingly, Fig. 6 is also modified regarding the vertical distribution of Ce anomalies and the limestone REE patterns (the dolostone patterns remain unchanged).
pro parte. REE contents of Bwipe cap carbonates (changes in bold)
Tableau 2 pro parte. Teneurs en terres rares des cap carbonates de Bwipe (modifications en gras)
| Sample no. | 7099 | 7102 | 7104 | 7106 | 7109 | 7112 | 7114 | 7115 | 7119 | 7122 | 7129 | 7134 | 7136 | 7140 | 7142 | 7144 | 7146 | 7147 | 7149 | 7150 | 7151 | 7152 | 7154 |
| La (ppm) | 4.36 | 6.54 | 3.76 | 4.20 | 4.39 | 5.33 | 4.89 | 3.68 | 4.60 | 5.76 | 3.90 | 3.62 | 3.85 | 4.27 | 4.64 | 4.77 | 3.14 | 3.59 | 10.08 | 3.85 | 7.84 | 12.21 | 6.02 |
| Ce | 8.79 | 11.48 | 6.71 | 7.21 | 9.19 | 8.55 | 8.29 | 7.00 | 7.83 | 9.84 | 6.84 | 6.68 | 6.98 | 6.82 | 7.80 | 8.01 | 5.33 | 5.14 | 14.86 | 9.85 | 18.50 | 20.13 | 12.07 |
| Pr | 1.03 | 1.60 | 0.95 | 0.97 | 1.20 | 1.25 | 1.19 | 0.94 | 1.11 | 1.48 | 0.91 | 0.89 | 1.00 | 1.03 | 1.18 | 1.16 | 0.77 | 0.80 | 2.30 | 1.26 | 2.36 | 2.76 | 1.54 |
| Nd | 4.18 | 6.64 | 3.82 | 4.38 | 5.03 | 4.74 | 5.05 | 3.65 | 4.27 | 5.96 | 3.43 | 3.63 | 3.75 | 4.27 | 4.53 | 4.58 | 3.02 | 3.18 | 9.14 | 5.46 | 9.80 | 10.30 | 6.04 |
| Sm | 1.07 | 1.55 | 0.86 | 0.86 | 1.26 | 0.99 | 1.06 | 0.80 | 0.92 | 1.34 | 0.68 | 0.60 | 0.78 | 0.83 | 1.02 | 0.98 | 0.72 | 0.62 | 2.04 | 1.21 | 1.78 | 2.02 | 1.29 |
| Eu | 0.32 | 0.34 | 0.20 | 0.20 | 0.30 | 0.26 | 0.30 | 0.19 | 0.25 | 0.32 | 0.16 | 0.14 | 0.19 | 0.22 | 0.23 | 0.24 | 0.15 | 0.16 | 0.52 | 0.30 | 0.49 | 0.50 | 0.35 |
| Gd | 0.94 | 1.31 | 1.05 | 0.80 | 1.18 | 1.15 | 1.09 | 0.88 | 0.91 | 1.40 | 0.64 | 0.68 | 0.72 | 0.83 | 0.93 | 1.02 | 0.62 | 0.71 | 2.41 | 0.91 | 1.64 | 1.66 | 1.00 |
| Tb | 0.16 | 0.18 | 0.14 | 0.12 | 0.17 | 0.17 | 0.16 | 0.12 | 0.13 | 0.22 | 0.10 | 0.10 | 0.10 | 0.12 | 0.13 | 0.16 | 0.08 | 0.10 | 0.34 | 0.15 | 0.24 | 0.22 | 0.15 |
| Dy | 0.94 | 1.17 | 0.83 | 0.75 | 1.04 | 1.22 | 1.03 | 0.72 | 0.94 | 1.43 | 0.70 | 0.52 | 0.60 | 0.78 | 0.82 | 0.96 | 0.54 | 0.60 | 2.33 | 0.84 | 1.22 | 1.39 | 0.83 |
| Ho | 0.21 | 0.24 | 0.17 | 0.18 | 0.20 | 0.21 | 0.21 | 0.13 | 0.18 | 0.31 | 0.12 | 0.09 | 0.12 | 0.17 | 0.18 | 0.24 | 0.13 | 0.14 | 0.48 | 0.14 | 0.27 | 0.28 | 0.17 |
| Er | 0.65 | 0.60 | 0.46 | 0.41 | 0.51 | 0.75 | 0.53 | 0.34 | 0.52 | 0.80 | 0.34 | 0.29 | 0.39 | 0.48 | 0.51 | 0.66 | 0.33 | 0.39 | 1.48 | 0.37 | 0.65 | 0.70 | 0.42 |
| Tm | 0.09 | 0.11 | 0.07 | 0.07 | 0.06 | 0.09 | 0.08 | 0.05 | 0.08 | 0.14 | 0.06 | 0.05 | 0.06 | 0.08 | 0.07 | 0.10 | 0.05 | 0.07 | 0.24 | 0.06 | 0.10 | 0.11 | 0.06 |
| Yb | 0.66 | 0.60 | 0.53 | 0.41 | 0.45 | 0.73 | 0.49 | 0.36 | 0.54 | 0.85 | 0.34 | 0.39 | 0.39 | 0.49 | 0.56 | 0.74 | 0.34 | 0.37 | 1.47 | 0.30 | 0.64 | 0.65 | 0.38 |
| Lu | 0.09 | 0.10 | 0.08 | 0.07 | 0.06 | 0.11 | 0.08 | 0.04 | 0.08 | 0.14 | 0.06 | 0.05 | 0.06 | 0.07 | 0.09 | 0.11 | 0.06 | 0.05 | 0.24 | 0.05 | 0.10 | 0.10 | 0.06 |
| Ce anomaly after (Elderfield & Greaves, [10]) | −0.02 | −0.08 | −0.08 | −0.08 | −0.02 | −0.12 | −0.10 | −0.05 | −0.09 | −0.10 | −0.08 | −0.06 | −0.08 | −0.12 | −0.11 | −0.10 | −0.10 | −0.16 | −0.15 | 0.03 | 0.01 | −0.10 | −0.03 |
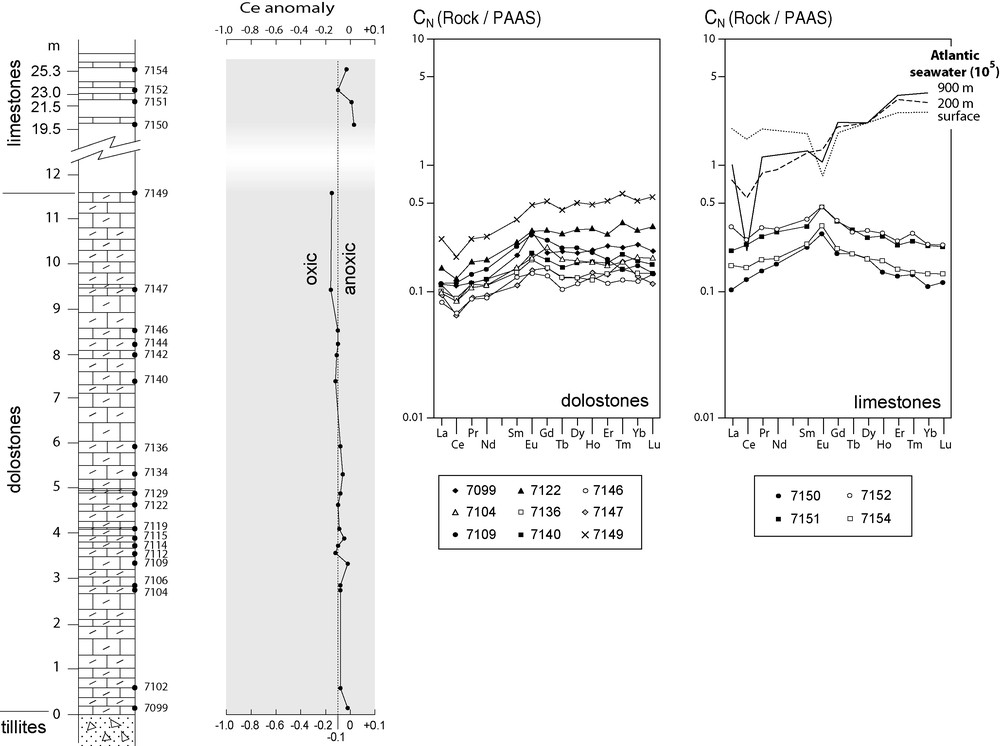
Vertical distribution of the Ce anomaly in Bwipe cap carbonates and rare-earth element patterns normalised to the post-Archaean Australian shales (PAAS); Atlantic seawater patterns for comparison.
Fig. 6. Distribution verticale de l’anomalie en Ce dans les cap carbonates de Bwipe et spectres de terres rares normalisés aux shales australiens post-archéens (PAAS) ; spectres de l’eau de mer atlantique pour comparaison.
Consequently, the text of p. 235 must also be slightly altered as follows:
- – lines 2–4: The Ce negative anomaly of the dolostones […] is small (−0.02 to −0.16), without exception instead of The Ce negative anomaly of the dolostones […] is small (−0.02 to −0.16), except for one sample (7144).
- – lines 12–13: The Ce anomaly ranges from 0.03 to −0.10 in the upper limestones instead of The Ce anomaly ranges from −0.42 to −0.81 in the upper limestones.
We apologize to our readers for these mistakes and thank G. Shields for having pointed them out.