

Version française abrégée
Introduction et contexte géologique
Les dépôts glaciaires néoprotérozoïques, dus à des glaciations quasi-globales [25], sont surmontés de cap carbonates peu épais, qui sont caractérisés par une valeur négative de δ13C [15]. Nous présentons une étude sédimentologique et géochimique détaillée des cap carbonates qui affleurent au Ghana, dans l’Ouest du bassin des Volta (Fig. 1). Ces carbonates forment la base du supergroupe de la Pendjari et correspondent à une série marine transgressive [1]. À l’est du Bassin, la datation des nappes d’avant-pays de la chaîne panafricaine [4] fournit un âge minimal de 620 Ma pour les cap carbonates.
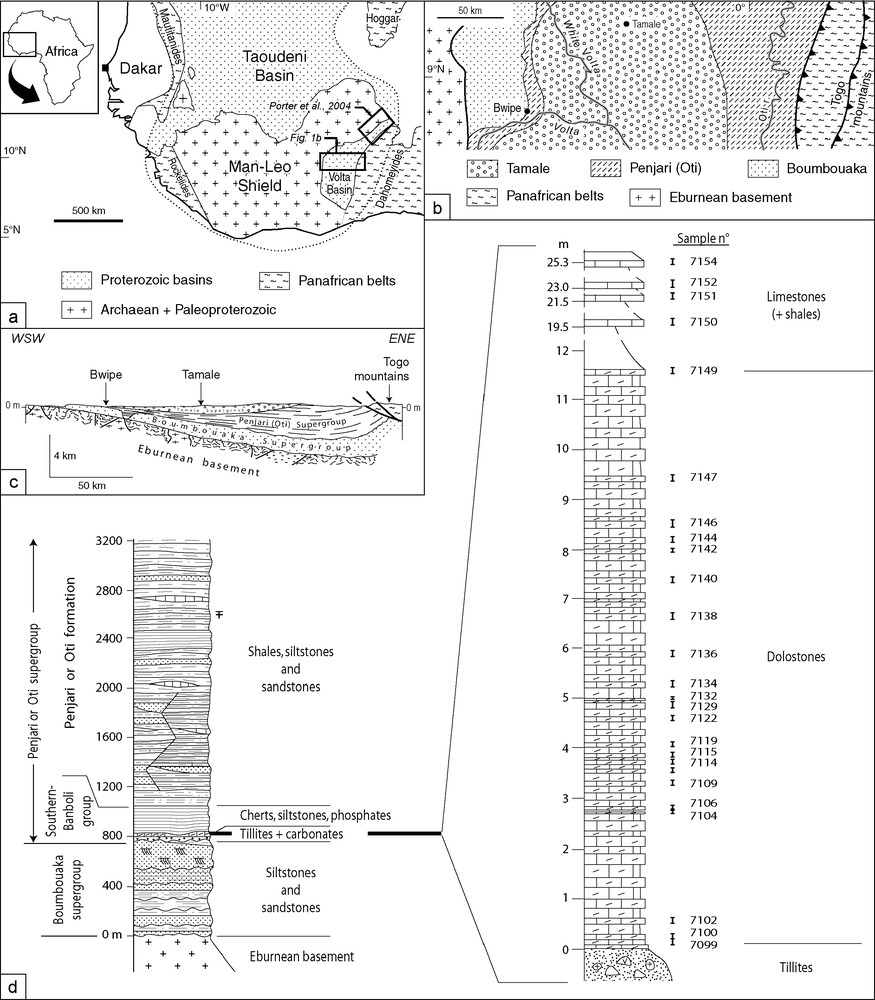
(a) Location of the Volta Basin in the West Africa craton. (b) Geological map of the studied area. (c) Cross-section of the Volta Basin. (d) Stratigraphy of the Proterozoic in the Bwipe area; (b, c) redrawn from [1].
Fig. 1. (a) Situation du bassin des Volta dans le craton Ouest-Africain. (b) Carte géologique du secteur d’étude. (c) Coupe du bassin des Volta. (d) Stratigraphie du Protérozoïque dans la région de Bwipe ; (b, c) redessinés d’après [1].
Sédimentologie
Les carbonates de Bwipe commencent par une dizaine de mètres de dolomies (cap carbonates sensu stricto), reposant directement sur les tillites. Vers le haut, les dolomies passent à des calcaires, avec des intercalations d’argiles et de silexites. Les dolomies présentent des caractères primaires très bien préservés, contrairement aux calcaires (Fig. 2b et c). On peut y distinguer trois groupes (Fig. 1d et Tableau 1) :
- – la partie inférieure (échantillons 7099 à 7109) comprend deux microfaciès. Le microfaciès A présente des lamines dolomicritiques régulières pelletoïdales où un pseudomorphe de filament bactérien a été observé (Fig. 2d). Le microfaciès B, de plus forte énergie, correspond à des lamines irrégulières litharénitiques (Fig. 2e–h). L’alternance de ces deux microfaciès indique des conditions hydrodynamiques changeantes, avec apports terrigènes épisodiques ;
- – la partie moyenne (échantillons 7112 à 7146) est formée de laminites régulières et homogènes, constituées de micrite pelletoïdale (microfaciès A: Fig. 3a). Des bird eyes planaires dénotent le développement d’un tapis microbien gênant les dégagements gazeux produits par la dégradation de matière organique (Fig. 3b). Localement, on observe des pseudomorphes de cristaux de gypse. Le milieu de dépôt correspond alors à une vasière stable et protégée ;
- – la partie supérieure riche en lamines microbiennes d’allure ondulée montre l’installation d’un tapis stromatolitique.
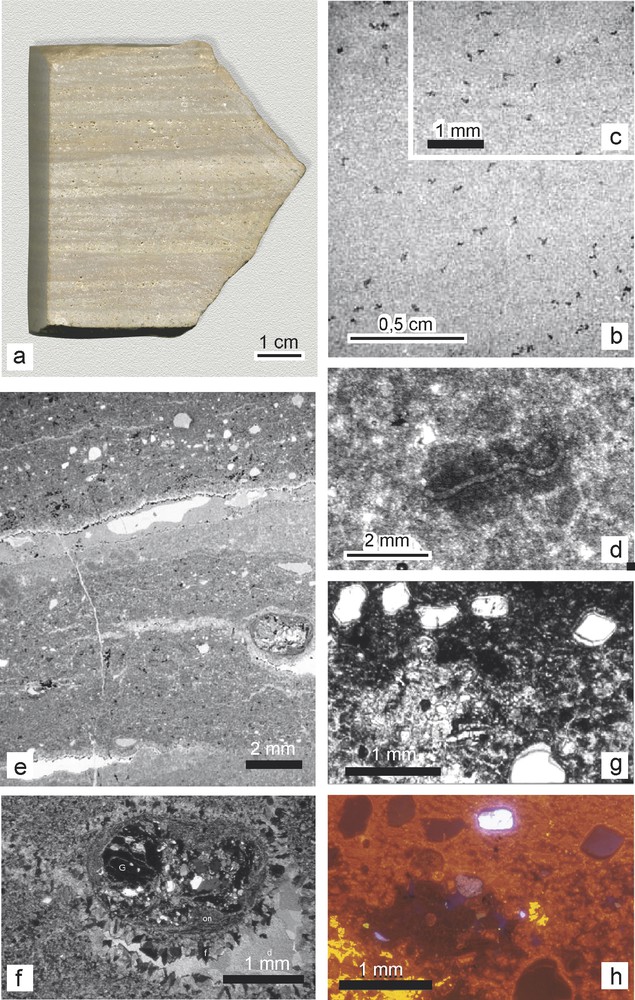
(a) Dolostone sample 7146. (b, c) Details of recrystallized limestone 7150. (d) Pseudomorph of microbial filament within a peloid (dolostone 7109). (e) Sedimentary sequences of dolostone 7109 with litharenitic laminae (microfacies B); microstalactites underline the top of a small cavity. (f) Detail under crossed polars: a small garnet-micaschist pebble with underlying fenestral porosity infilled by fibrous and drusy carbonate cements. (g) Detail of a sandy lamina displaying the fine cement surrounding the grains. (h) Idem under cathodoluminescence.
Fig. 2. (a) Dolomie 7146. (b, c) Détails du calcaire recristallisé 7150. (d) Pseudomorphe de filament microbien dans un pelletoïde de la dolomie 7109. (e) Séquences sédimentaires dans la dolomie 7109 avec lamines litharénitiques (microfaciès B); des microstalactites bordent le plafond d’une petit cavité. (f) Détail en lumière polarisée et analysée d’un microgalet de micaschiste à grenat et de la porosité fenestrale en dessous avec un remplissage de carbonate fibreux et drusiforme. (g) Détail d’une lamine sableuse montrant une fine couche de ciment autour des grains. (h) Idem en cathodoluminescence.
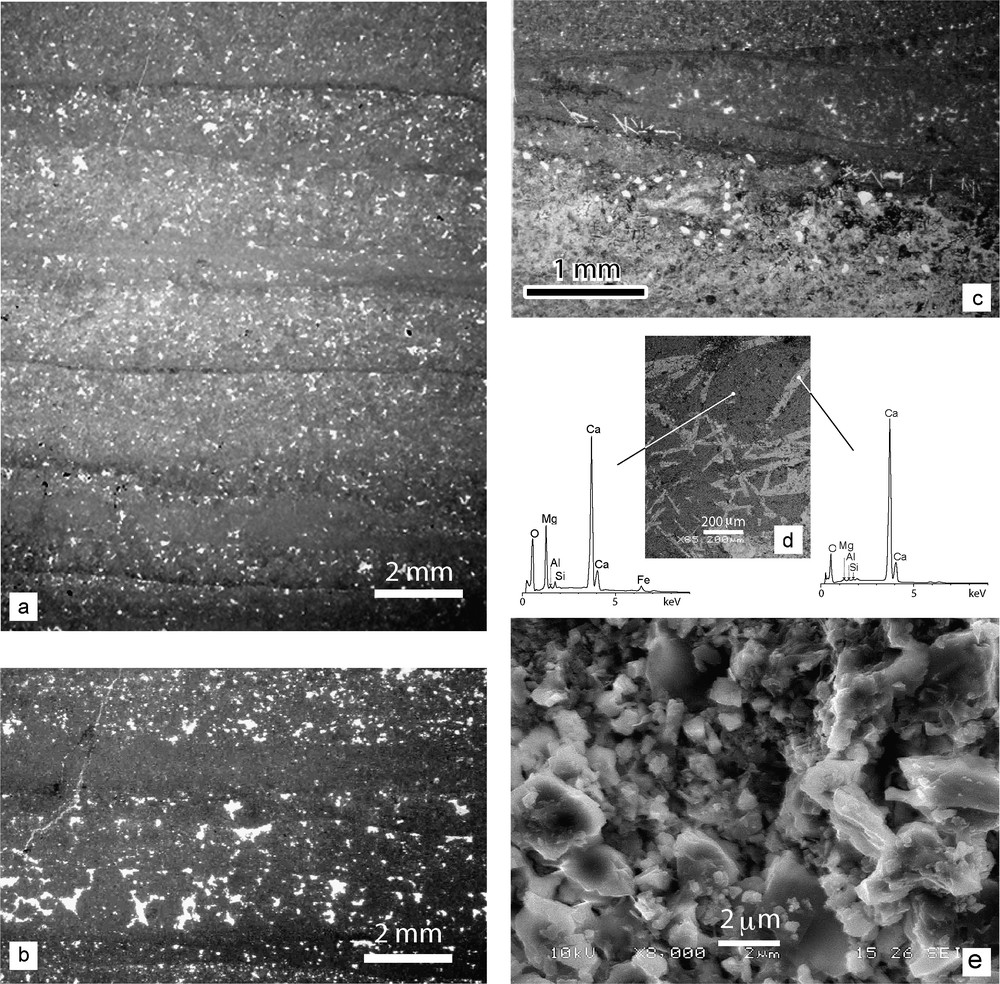
(a) Successive sedimentary sequences in dolostone 7115 (microfacies A). (b) Detail of birdeye or fenestral fabric in dolostone 7146. (c) Peloidal layers topped by subparallel to onlapping microbial mats in dolostone 7122; notice the fibrous evaporitic pseudomorphs. (d) BSE image of evaporitic pseudomorphs in dolostone 7149, with EDS analyses of pseudomorph and dolomicrite. (e) SEM image of dolomicrite (7114).
Fig. 3. (a) Séquences sédimentaires successives dans la dolomie 7115 (microfacies A). (b) Détail de la fabrique fenestrée (avec bird eyes) dans la dolomie 7146. (c) Lamines pelletoïdales surmontées de films microbiens subparallèles ou à angle faible dans la dolomie 7122; on remarque des pseudomorphes évaporitiques fibreux. (d) Image en électrons rétrodiffusés des pseudomorphes évaporitiques de la dolomie 7149, avec analyses EDS. (e) Image MEB de la dolomicrite de l’échantillon 7114.
Ces différents caractères indiquent un environnement péritidal [3] (terme regroupant la zone subtidale temporairement émergée, la zone intertidale et la zone supratidale épisodiquement ennoyée) sous un climat chaud et aride [35].
Chimiostratigraphie
Les compositions chimiques des carbonates de Bwipe sont données dans le Tableau 2. La distribution verticale des éléments majeurs est présentée sur la Fig. 4 et celle des éléments traces sur la Fig. 5. On note la teneur élevée des carbonates en manganèse (Fig. 2h). Les éléments chalcophiles sensibles aux conditions rédox permettent d’estimer le degré d’oxydation lors du dépôt [38]. On constate que les teneurs normalisées à Al dépassent largement les teneurs moyennes des shales. L’enrichissement relatif en As, Cd et Mo à certains niveaux indique des conditions suboxiques. La présence de Cd est un très bon indicateur de sulfato-réduction [7]. Le rapport V/(V + Ni) [13,27,37] indique des conditions oxiques à dysoxiques. Le rapport Ba/Al (Fig. 6b) témoigne d’une productivité primaire élevée [8,9]. Les spectres de terres rares normalisés aux shales australiens post-archéens sont de type eau de mer ([11]; Fig. 7). Ils présentent une anomalie négative en Ce très faible, indiquant des conditions suboxiques [49].
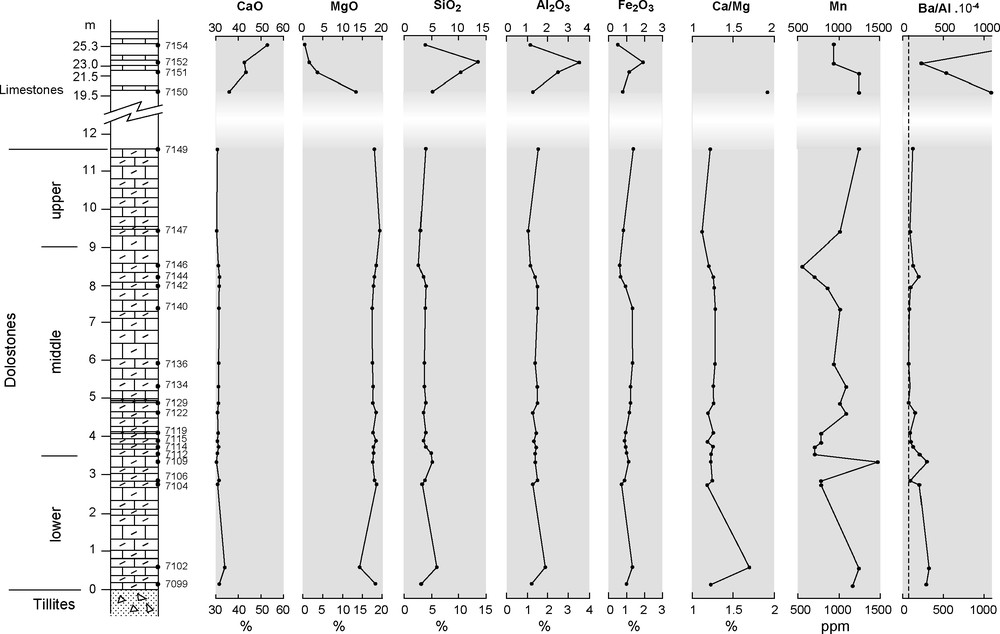
Vertical distribution of major and trace elements; dashed line: Ba/Al content for average shale after [48].
Fig. 4. Distribution verticale des éléments majeurs et traces ; ligne en tiretés : Ba/Al pour un shale de composition moyenne selon [48].
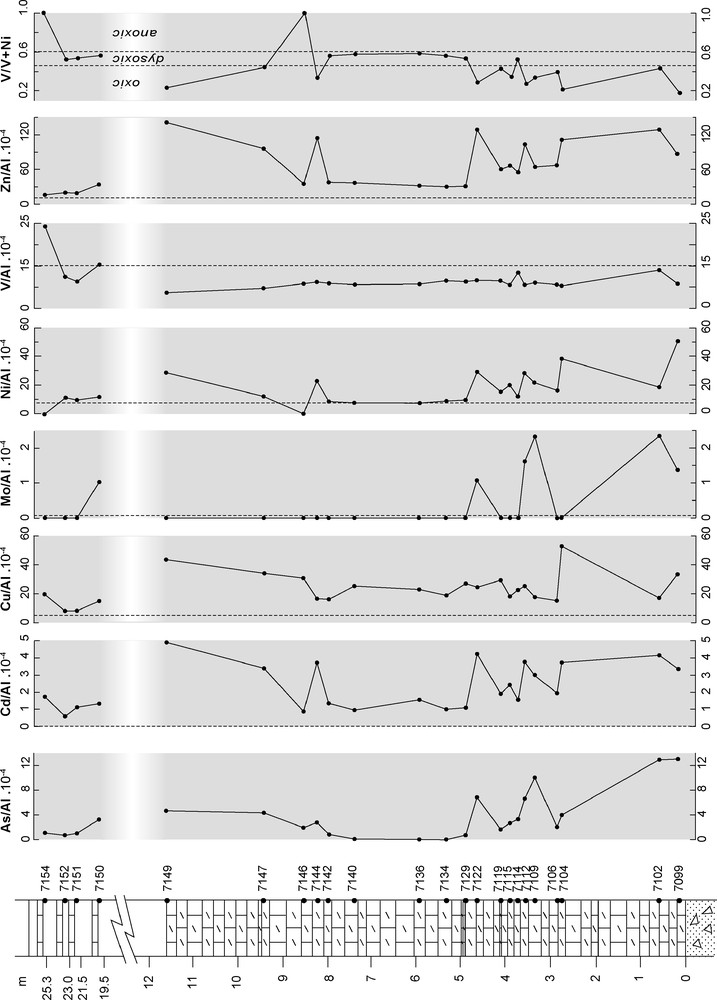
Vertical distribution of Al-normalized redox-sensitive trace elements; dashed lines: Al-normalized contents for average shale after [48]; fields associated to V/(V + Ni) ratios after [37].
Fig. 5. Distribution verticale des éléments traces sensibles aux conditions rédox normalisés à Al ; tiretés : teneurs normalisées pour un shale de composition moyenne selon [48] ; domaines rédox associés aux rapports V/(V + Ni) d’après [37].
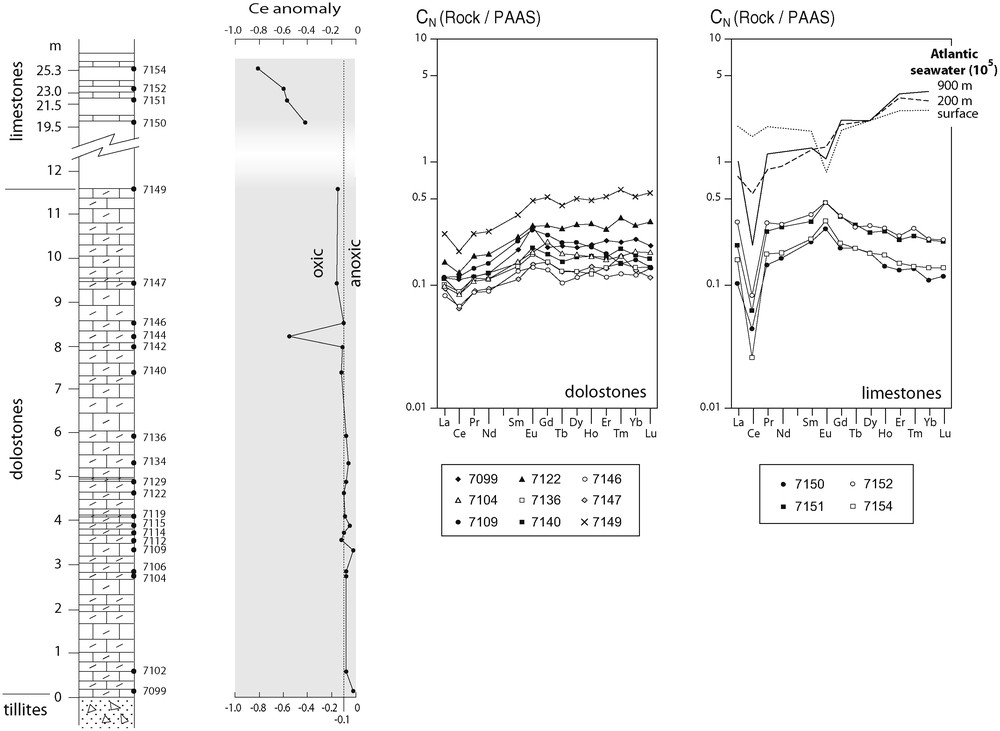
Vertical distribution of Ce anomaly and rare earth element patterns normalised to post-Archaean Australian shales (PAAS); oxic-anoxic fields after [49]; Atlantic seawater patterns (from [11]) for comparison.
Fig. 6. Distribution verticale de l’anomalie en Ce et spectres de terres rares normalisés aux shales australiens post-archéens (PAAS) ; domaines oxique et anoxique d’après [49] ; spectres de l’eau de mer atlantique (d’après [11]) pour comparaison.
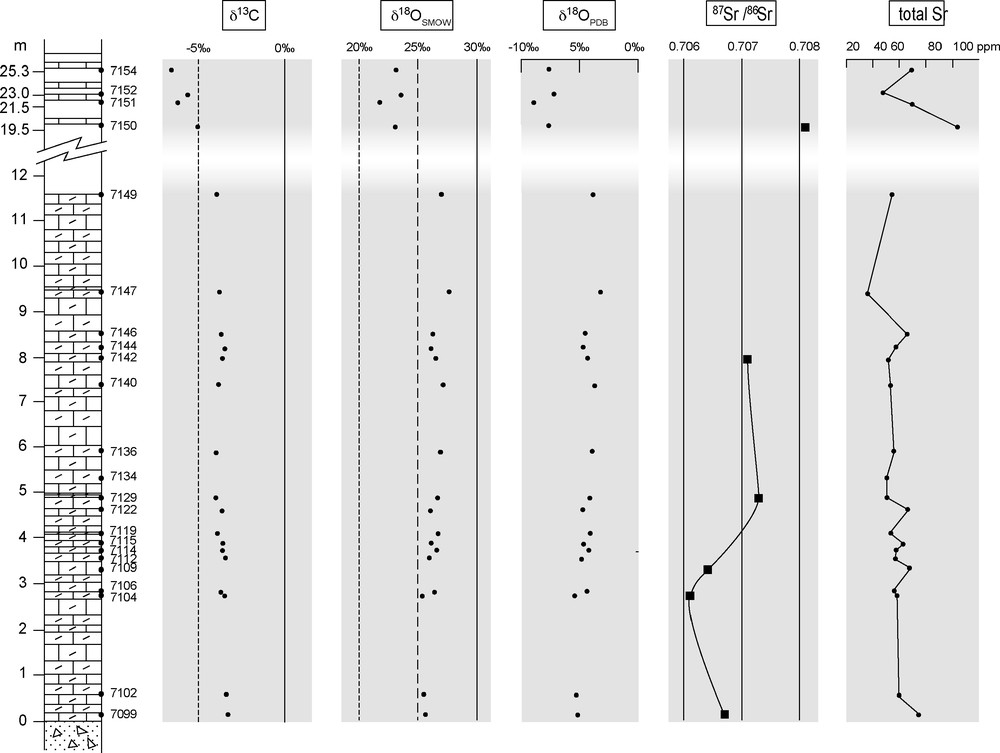
Vertical distribution of isotopic compositions (C, O, Sr).
Fig. 7. Distribution verticale des compositions isotopiques (C, O et Sr).
Les valeurs de δ13C demeurent à peu près constantes et voisines de −3,7‰ (Fig. 8), soit des valeurs légèrement plus faibles, mais comparables à celles obtenues au nord du bassin [34]. On en déduit que ces valeurs ont une signification au moins régionale, sinon globale [15]. Toutefois, seule la signature isotopique des dolomies est prise en considération, mais pas celle des calcaires où les caractères sédimentologiques initiaux n’ont pas été préservés. Les rapports 87Sr/86Sr obtenus après dissolution ménagée dans l’acide acétique (pour éviter la contamination par du Sr radiogénique) correspondent à des valeurs faibles (0,7061–0,7073). Reportées dans la courbe d’évolution isotopique du Sr (Fig. 9; [5,30]), ces valeurs sont compatibles avec un âge post-Marinoen (630 Ma) ou même post-Sturtien (730–680 Ma) pour le dépôt de ces cap carbonates.
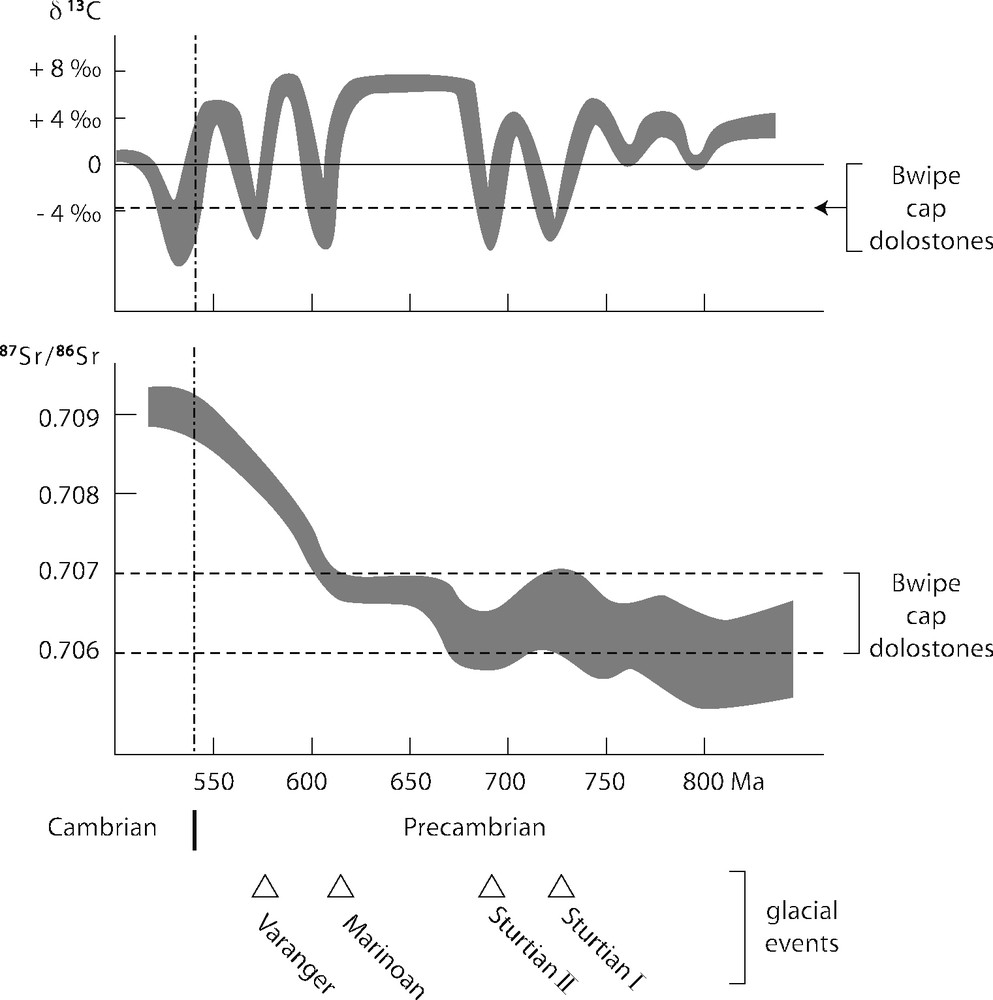
Neoproterozoic seawater evolution curves for C and Sr isotopes modified after [5] and [30]; ages of glacial events after [16] and [23].
Fig. 8. Courbes d’évolution isotopique (C et Sr) de l’eau de mer néoprotérozoïque d’après [5] et [29] ; âges des glaciations d’après [16] et [23].
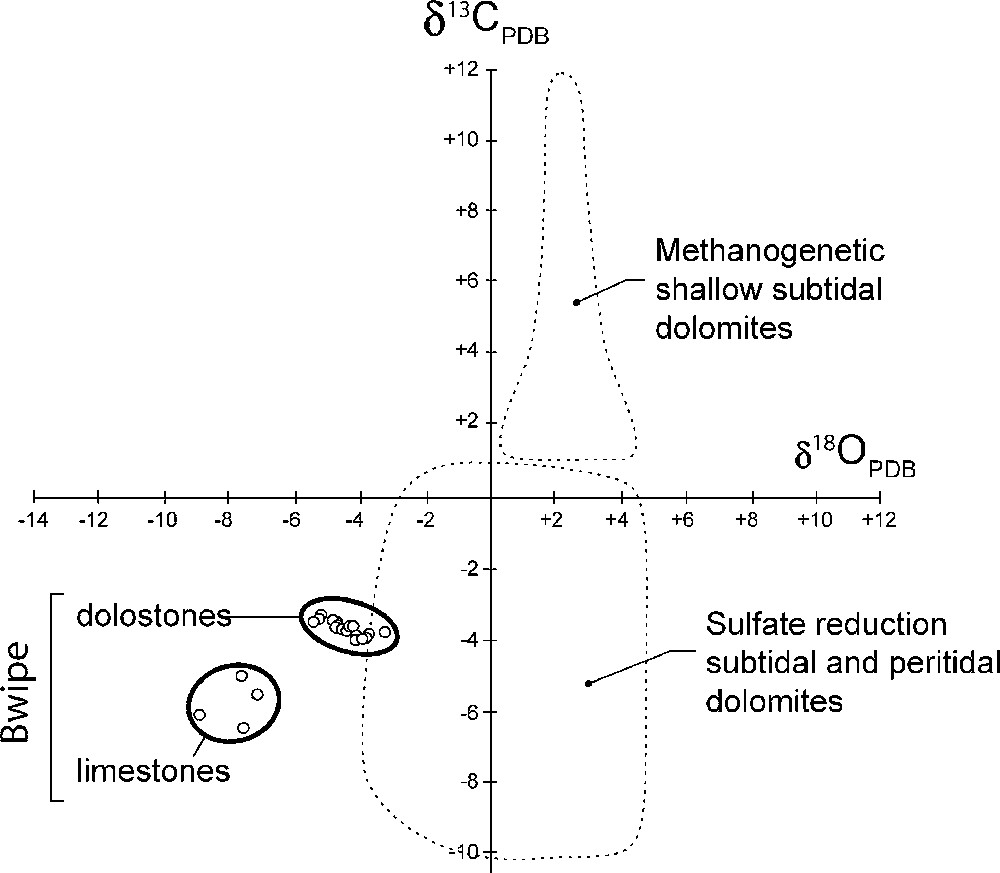
Isotopic C–O diagram with fields of recent shallow marine dolostones after [29].
Fig. 9. Diagramme isotopique C–O avec domaines des dolomies marines récentes de faible profondeur d’après [29].
Interprétation et conclusion : un modèle organogénétique pour la formation des cap dolomies
La précipitation inorganique de la dolomite pose problème, même dans de l’eau de mer sursaturée en carbonates [46]. Toutefois, la dolomite des cap carbonates de Bwipe semble bien précoce, pénécontemporaine du dépôt. Par ailleurs, ces roches montrent des signes d’activité organique importante en conditions suboxiques. Dans ces conditions, la matière organique est dégradée par les bactéries sulfato-réductrices qui produisent des ions bicarbonates enrichis en 12C :
En consommant le sulfate, cette réaction détruit le lien entre magnésium et sulfate, qui constitue un puissant inhibiteur de la formation de dolomite. Celle-ci peut alors précipiter et sa signature isotopique négative en C indique la contribution des bicarbonates formés par la réaction ci-dessus (Fig. 9). Ce processus a été observé dans les conditions récentes et actuelles [29,42] et reproduit en culture [41,47]. Il a pu jouer un rôle primordial dans les zones péritidales protégées lors des déglaciations néoprotérozoïques. En effet, le passage rapide d’un climat froid à un climat chaud a induit la réactivation de la circulation océanique et celle du cycle hydrologique, d’où des apports nutritifs considérables à l’océan, permettant probablement une formidable floraison microbienne [26]. Les possibilités de reminéralisation complète de la matière organique étant alors dépassées, les bactéries sulfato-réductrices entrent en jeu et laissent leur marque dans la signature isotopique caractéristique des cap dolomies.
1 Introduction
Cap carbonates are ubiquitous deposits that formed just after the unusually severe Neoproterozoic ice ages, giving birth to the Snowball-Earth hypothesis [25]. Despite their reduced thickness (usually 5–10 m for the cap dolostones), their very peculiar geochemical features raised a lot of interest, but their conditions of formation are still poorly known. Most published works deal with carbon isotope signatures that are typically negative [15]. Lithological characterization is sometimes provided [21], as well as other stable isotope data (O, Sr, S), but major and trace element contents are rarely analysed. Our aim is to get a complete sedimentological and geochemical characterization of Neoproterozoic post-glacial cap carbonates from the western part of the Volta Basin in Ghana (Fig. 1a). C and O isotope compositions of similar rocks from the northern part of the Volta Basin were already provided by Porter et al. [34]. Our new data set offers the opportunity for basin scale correlation and for discussion of the origin of cap carbonates.
2 Geological setting
The Volta Basin comprises Meso- and Neoproterozoic to Lower Palaeozoic sediments deposited on the Eburnean (2.1 Ga or older) basement of the Man Shield, that have been described in detail by Affaton [1]. Sedimentation was first terrigenous and epicontinental (Bombouaka Supergroup), then marine in the form of a passive margin sequence (Pendjari Supergroup) followed by the molassic foreland deposits of the Tamale Supergroup (Fig. 1b). Conglomerates at the base of the Tamale Supergroup display an angular unconformity with respect to the underlying Pendjari Supergroup, a consequence of the formation of the nearby Dahomeyide belt [2], the southern extension of the Pan-African Trans-Saharan belt in Hoggar (Fig. 1a). The Pan-African orogeny along the eastern border of the West African craton resulted from oceanic closure and continent–continent collision with the poorly known Saharan craton and was recently dated at about 620 Ma [20]. This orogeny was responsible for folds and thrusts in the eastern part of the Bombouaka and Pendjari Supergroups (Fig. 1c), but the sediments in the Volta Basin experienced no metamorphism. A muscovite Ar/Ar age of 608 (± 1) Ma was obtained from the external nappe of the Togo mountains ([4]; Fig. 1b and c). Therefore, an age older than 620 Ma is proposed for the Pendjari Supergroup, consistent with a Marinoan (ca 635 Ma) or Sturtian (ca 700 Ma) age for the glaciogenic deposits.
The base of the Pendjari Supergroup consists of a stratigraphic ‘Triad’ made of tillites, carbonates and bedded cherts (actually silicified shales) in this stratigraphic order (Fig. 1d). The Triad has been recognized along the western part of the Basin in Ghana, as well as further north in northern Togo and southern Burkina Faso, where striated pavements demonstrate the glacial origin of the tillites [34]. Cap carbonates overlying discontinuous outcrops of tillites were sampled in Ghana near Bwipe (Fig. 1b, c), where the carbonate thickness (25 m) is greater than to the north (maximum thickness: 2.40 m in Arli, Burkina Faso). The stratigraphic section at Bwipe is provided in Fig. 1d.
3 Sedimentology
3.1 Microfacies
Tillites are directly overlain by a carbonate formation, whose first 12 metres are made of finely laminated dolostones, which constitute the ‘cap carbonates’ sensu stricto. These rocks are especially well-preserved, fenestral, peloidal and microbial dolostones, with a millimetre-scale lamination, sometimes accompanied by colour changes from yellowish to light pink (Fig. 2a). Up section, the carbonate rocks are limestones, where secondary phenomena have erased any primary sedimentary features (Fig. 2b and c). Therefore, our study is mainly focussed on the better preserved dolostones. Twenty-five carbonate samples have been collected and their position in the section is indicated in Fig. 1d. Microfacies and related structures are presented in Table 1. The cap dolostones can be divided in three parts:
- – The lower part (samples 7099 to 7109) is made of heterogeneous wackestones to packstones with millimetre- to centimetre-thick alternation of two microfacies (A and B), made of clean and litharenitic dolostones respectively. Microfacies A of lower energy is characterized by roughly parallel regular laminations formed by peloidal, sometimes vuggy, dolomicrite. A pseudomorph of microbial filament can be recognized in one peloid (Fig. 2d). Microfacies B of relatively higher energy displays irregular laminations, locally eroded by microchannel infills, and contains exogeneous lithoclasts (e.g., a small pebble of garnet micaschist: Fig. 1e and f), detrital quartz and feldspar, as well as micritic intraclasts. Such alternating microfacies provide evidence for changing hydrodynamic conditions corresponding to episodic terrigenous inputs. Microstalactites formed in some lamina-parallel open spaces or cracks (Fig. 2e), indicating periodic aerial exposures of the wet sediment.
- – The middle part (samples 7112 to 7146) comprises homogeneous, regular laminites (microfacies A). Distinct light-dark (< 1-mm-thick) microlaminae occur, locally defined by thin (50–200 μm) gently curved dolomicritic layers (Fig. 3a). Extraclasts are generally lacking. From bottom to top, the laminae thicken and their boundaries become more diffuse. Fenestrae (Fig. 3b) suggest the temporal development of a microbial mat limiting gas outflow from the sediment. This is supported by the recognition of typical microbial laminae located at the top of the peloidal dolostones (samples 7112, 7122, and 7146). These crinkled microbial mats show parallel, or sometimes low-angle and onlapping, laminae, and generally follow the substrate micromorphology, suggesting that the substrate was temporarily exposed to quiet water conditions. The microbial colonization phases stabilized the sediment. These features are evidence of deposition in a stable, protected mud flat environment. Locally, aggregates of randomly interlocked pseudomorphs after gypsum crystals, fibrous to lozenge-shaped and up to 1 mm long, grown upwards from the bottom of a lamina, are replaced by mosaics of microsparitic calcite (Fig. 3c and d). The crystal habit of the pseudomorphs is common in evaporitic deposits, and is usually interpreted as a result of either early-diagenetic interstitial precipitation from hypersaline pore-fluids or intrasedimentary growth in the phreatic or capillary zones [3].
- – The upper part (sample 7149) is characterized by thinner laminae. Each lamina is limited upwards by a wavy microbial structure of stromatolitic aspect, consistent with the lack of long emersions.
Sedimentary microfacies in the Bwipe cap dolostones
Tableau 1 Microfaciès sédimentaires dans les cap dolomies de Bwipe
| Samples | homogeneity (+) vs heterogeneity (−) | lithoclasts | litharenitic laminae | irregular laminae | (sub)parallel laminae | lamina thickness (mm) | microchannel infills | distinct (+) vs transitional (−) laminae | peloids | planar bird eyes | microstalactites | evaporitic pseudomorph | iron hydroxydes | bacterial filament | macroscopic microbial mat | incipient recrystallization | hydrodynamism |
| 7149 | − | + | 1 to 5 | + | + | + | + + | + | − | ||||||||
| 7146 | + | 3 | + | + | + | − | |||||||||||
| 7142 | + | 4 | + | + | + | − | |||||||||||
| 7136 | + | + | 5 to 7 | − | + | + | − | ||||||||||
| 7134 | + | + | 5 to 7 | − | + | + | − | ||||||||||
| 7132 | + | + | 5 to 7 | − | + | + | − | ||||||||||
| 7129 | + | + | 5 to 7 | − | + | + | − | ||||||||||
| 7122 | + | + | 5 to 7 | − | + | − | |||||||||||
| 7119 | + | + | 3 to 7 | + | + | + | − | ||||||||||
| 7115 | + | + | 5 to 7 | + | + | + | − | ||||||||||
| 7114 | + | + | 1 to 3 | + | + | + | + | − | |||||||||
| 7112 | + | + | 2 to 4 | + | + | − | |||||||||||
| 7109 | − | + | + | + | 3 to 7 | + | + | + | + | + | + | + | + | ||||
| 7106 | + | + | 3 to 5 | − | + | + | − | ||||||||||
| 7104 | − | + | + | 5 to 7 | + | + | + | ||||||||||
| 7102 | − | + | + | + | 3 to 7 | + | + | + | + | + | + | + | |||||
| 7100 | + | + | 5 to 7 | − | + | − |
All these sedimentary features are typical of peritidal environments (i.e. the temporarily emerged subtidal, intertidal and sometimes aerially exposed supratidal zones), analogous to present littoral lagoons or sabkhas formed under warm semi-arid conditions, such as can be observed along the Persian Gulf [35]. The temporal evolution is marked by the development of more protected conditions. The quality of preservation of the microstructures is such that the dolomicrite precipitation must have been penecontemporaneous with sedimentation. Bird eyes and laminoid fenestrae are interpreted as the consequence of release of fluids due to organic decay, mainly microbial in origin, whereas submillimetre-scale vugs represent early-diagenetic dissolution processes.
By contrast, the limestones up section display larger sparitic crystals formed during secondary recrystallization. Primary sedimentary features are hardly recognizable, although variations in crystal size sometimes mimic ghost laminae or microbial mats.
3.2 Mineralogy
In order to determine their mineralogy, a few samples were selected for X-ray analyses and mapping of selected areas was carried out using the electron microprobe. The lower dolostones (7102 and 7109) contain dolomite with silicate minerals and subordinate calcite. Clastic quartz and K-feldspar grains are cemented by or embedded in dolomite, but they display a narrow calcite coverage (5 μm in thickness: Fig. 2g). Kaolinite or illite is sometimes present in the pore space. Irregular fillings (50–200 μm thick) of goethite are detected locally and regarded as late minerals. The intermediate dolostones (7115, 7122, 7146) contain predominantly dolomite, and less than 3% calcite. Silicate minerals are rare (<5%) and mostly consist of kaolinite or illite, 5–10 μm in size, filling interstices. The uppermost limestones (7154) contain only one carbonate mineral, which is calcite.
Cathodoluminescence microscopy of selected thin sections yielded a dominant red luminescence, which is ascribed to a Mn-rich dolomicrite ([36]; Fig. 2h). Carbonate coatings on lithoclasts and microstalactites grown from the top of small cavities in the lower dolostones display the same red luminescence suggesting also Mn-enrichment, hence confirming that they are nearly coeval with the micritic cement. A yellowish luminescence ascribed to a later Mn-poor calcite appears in some microfractures.
Scanning electron microscopy (SEM) images show that the dolomicrite contains crystals in the 1- to 5- μm (mainly 1–3) size range (Fig. 3e). A backscattered electron (BSE) image from the elongate pseudomorphs clearly shows that these crystals are polycrystalline. EDS analyses (Fig. 3d) confirm their purely calcitic composition.
4 Geochemistry
4.1 Analytical procedures
Major and trace elements as well as C and O isotopes were analysed from chemically untreated bulk samples at the SARM–CNRS laboratory in Nancy (analyst: Jean Carignan). Rock samples were ground using agate mortar. Different aliquots were used for elemental and isotopic analyses. The samples were fused with LiBO2 and the resulting glasses were dissolved in HNO3. Major elements were analyzed by ICP–AES with analytical uncertainties generally less than 2%. Trace elements were analysed by ICP–MS, with analytical uncertainties generally less than 10%. Quality of the analyses was checked by comparison with international geostandards.
Carbon and oxygen isotopic compositions of carbonates and carbonate abundances have been measured by classical stable isotope techniques. The proportions of calcite and dolomite in the bedload were manometrically determined, as CO2 released by selective reaction with > 100% H3PO4 [39]. Synthetic and natural standards were used to calibrate the time and the temperature of reaction necessary to separate CO2 produced by the dissolution of calcite and dolomite. More than 99% of the calcite had reacted after 3 h at 25 °C, while dolomite contributed to less than 5% of the produced CO2. The remaining carbonate was then reacted for > 100 h at 50 °C. δ18O (SMOW) and δ13C (PDB) were measured on released CO2, using a modified VG-602 mass spectrometer. Overall reproducibility is ± 0.1‰ for δ18O and δ13C.
Sr isotopes were analysed at LMTG (Toulouse). The samples were first leached with cold suprapure 80% acetic acid during 24 h to remove contaminant strontium related to clay minerals. Then, the samples were partially dissolved in suprapure 80% acetic acid at 90 °C for 24 h. The solution product was evaporated, re-dissolved in HNO3 (2 N), centrifuged and ‘eluted’ in Sr-SPEC columns. Sr isotope ratios were determined by TIMS. Quality of the analyses was checked by comparison with two standards: NBS 987 standard (theoretical value: 0.71025; measured value: 0.710242 ± 0.000014 at 2σ) and CAL-S calcite standard partially dissolved following the above procedure (theoretical value: 0.706924 ± 0.000018 at 2 σ; measured value: 0.706934 ± 0.000013 at 2 σ) standards. To check the validity of the dissolution procedure, two samples were completely dissolved without any previous leaching and analysed for comparison. Their higher Sr ratios (see Table 2) result from contamination by radiogenic 87Sr derived from 87Rb contained in the silicate fraction. By contrast, our partial dissolution procedure yields lower ratios reflecting the actual Sr isotope signatures of the carbonates.
Elemental and isotopic compositions of the Bwipe cap carbonates
Tableau 2 Composition élémentaire et isotopique des cap carbonates de Bwipe
| Dolostones | Limestones | ||||||||||||||||||||||
| Samples | 7099 | 7102 | 7104 | 7106 | 7109 | 7112 | 7114 | 7115 | 7119 | 7122 | 7129 | 7134 | 7136 | 7140 | 7142 | 7144 | 7146 | 7147 | 7149 | 7150 | 7151 | 7152 | 7154 |
| SiO2 (%) | 3.00 | 5.84 | 3.20 | 3.64 | 5.02 | 4.85 | 3.8 | 3.41 | 3.81 | 3.41 | 3.82 | 3.60 | 3.57 | 3.72 | 3.87 | 3.42 | 2.47 | 2.86 | 3.81 | 5.05 | 10.31 | 13.49 | 3.69 |
| Al2O3 | 1.11 | 1.75 | 1.15 | 1.37 | 1.29 | 1.29 | 1.34 | 1.22 | 1.30 | 1.15 | 1.37 | 1.38 | 1.26 | 1.36 | 1.35 | 1.24 | 1.04 | 0.93 | 1.45 | 1.18 | 2.37 | 3.4 | 1.07 |
| Fe2O3a | 1.04 | 1.36 | 0.77 | 0.93 | 1.14 | 1.06 | 0.98 | 0.92 | 1.00 | 1.21 | 1.28 | 1.24 | 1.35 | 1.39 | 1.01 | 0.73 | 0.64 | 0.88 | 1.44 | 0.81 | 1.21 | 1.99 | 0.57 |
| MnO | 0.15 | 0.16 | 0.10 | 0.10 | 0.19 | 0.09 | 0.09 | 0.1 | 0.1 | 0.14 | 0.13 | 0.14 | 0.12 | 0.13 | 0.11 | 0.09 | 0.07 | 0.13 | 0.16 | 0.16 | 0.16 | 0.12 | 0.12 |
| MgO | 18.26 | 14.28 | 18.52 | 18.02 | 17.59 | 17.80 | 17.76 | 18.42 | 17.64 | 18.4 | 17.63 | 17.68 | 17.5 | 17.46 | 17.8 | 17.98 | 18.48 | 19.36 | 17.98 | 13.35 | 3.66 | 1.61 | 0.43 |
| CaO | 31.46 | 33.94 | 30.65 | 31.38 | 30.24 | 30.63 | 31.19 | 30.56 | 31.03 | 30.68 | 31.06 | 31.07 | 31.25 | 31.28 | 31.46 | 31.6 | 31.13 | 30.29 | 30.7 | 35.85 | 43.39 | 42.69 | 52.74 |
| Na2O | 0.05 | < dl | < dl | 0.12 | < dl | < dl | 0.12 | 0.12 | 0.13 | 0.11 | 0.13 | 0.11 | 0.09 | 0.15 | 0.08 | 0.07 | < dl | < dl | 0.09 | < dl | < dl | < dl | < dl |
| K2O | 0.09 | 0.20 | 0.16 | 0.19 | 0.19 | 0.18 | 0.19 | 0.15 | 0.2 | 0.15 | 0.19 | 0.18 | 0.17 | 0.16 | 0.18 | 0.17 | 0.07 | 0.05 | 0.14 | 0.11 | 0.36 | 0.53 | 0.13 |
| TiO2 | < dl | 0.05 | < dl | 0.05 | 0.05 | < dl | 0.05 | 0.05 | 0.05 | < dl | < dl | < dl | < dl | < dl | < dl | < dl | < dl | < dl | 0.07 | < L.D. | 0.08 | 0.09 | < dl |
| P2O5 | 0.08 | 0.07 | < L.D. | 0.1 | < L.D. | 0.09 | 0.05 | 0.06 | 0.06 | 0.08 | 0.07 | 0.1 | 0.08 | 0.09 | 0.06 | 0.07 | 0.1 | 0.1 | 0.07 | 0.07 | < dl | < dl | < dl |
| l.i. | 44.24 | 41.74 | 44.25 | 43.93 | 43.04 | 43.25 | 43.62 | 44.32 | 43.81 | 44.13 | 43.91 | 43.56 | 43.78 | 43.63 | 43.63 | 44.31 | 45.12 | 44.87 | 44.12 | 42.87 | 38.43 | 35.84 | 41.39 |
| Total | 99.48 | 99.39 | 98.8 | 99.83 | 98.75 | 99.24 | 99.19 | 99.33 | 99.13 | 99.46 | 99.59 | 99.06 | 99.17 | 99.37 | 99.55 | 99.67999 | 99.12 | 99.47 | 100.03 | 99.45 | 99.97 | 99.75999 | 100.14 |
| As (ppm) | 7.7 | 12.0 | 2.4 | 1.4 | 6.9 | 4.5 | 2.3 | 1.7 | 1.1 | 4.2 | 0.5 | < dl | < dl | < dl | 0.5 | 1.8 | 1.0 | 2.1 | 3.6 | 2.0 | 1.2 | 1.3 | 0.6 |
| Ba | 168 | 294 | 120 | 65 | 202 | 141 | 87 | 61 | 59 | 93 | 48 | 63 | 46 | 54 | 65 | 128 | 68 | 42 | 92 | 681 | 662 | 404 | 905 |
| Cd | 2.0 | 3.8 | 2.3 | 1.4 | 2.0 | 2.7 | 1.1 | 1.6 | 1.3 | 2.6 | 0.8 | 0.8 | 1.0 | 0.7 | 1.0 | 2.4 | 0.5 | 1.7 | 3.8 | 0.8 | 1.4 | 1.0 | 1.0 |
| Cu | 20 | 16 | 32 | 11 | 12 | 17 | 16 | 12 | 20 | 15 | 19 | 14 | 15 | 18 | 12 | 11 | 17 | 17 | 33 | 9 | 10 | 15 | 11 |
| Mo | 0.8 | 2.2 | < dl | < dl | 1.6 | 1.1 | < dl | < dl | < dl | 0.6 | < dl | < dl | < dl | < dl | < dl | < dl | < dl | < dl | < dl | 0.6 | < dl | < dl | < dl |
| Ni | 30 | 17 | 24 | 12 | 15 | 20 | 9 | 13 | 11 | 18 | 7 | 7 | 5 | 6 | 6 | 15 | < dl | 6 | 22 | 7 | 12 | 21 | < dl |
| Rb | 5 | 8 | 7 | 8 | 7 | 8 | 8 | 7 | 9 | 7 | 9 | 9 | 9 | 8 | 8 | 7 | 6 | 5 | 7 | 7 | 15 | 21 | 8 |
| Sr | 74 | 59 | 58 | 56 | 67 | 57 | 57 | 63 | 53 | 66 | 50 | 50 | 55 | 53 | 51 | 57 | 66 | 36 | 54 | 103 | 69 | 48 | 69 |
| V | 6 | 13 | 6 | 8 | 8 | 7 | 9 | 7 | 8 | 7 | 8 | 8 | 7 | 8 | 8 | 7 | 6 | 5 | 7 | 10 | 14 | 22 | 14 |
| Zn | 51 | 120 | 68 | 49 | 43 | 70 | 39 | 43 | 41 | 79 | 22 | 22 | 21 | 27 | 27 | 75 | 19 | 47 | 108 | 21 | 24 | 37 | 9 |
| La | 4.36 | 6.54 | 3.76 | 4.20 | 4.39 | 5.33 | 4.89 | 3.68 | 4.60 | 5.76 | 3.90 | 3.62 | 3.85 | 4.27 | 4.64 | 4.77 | 3.14 | 3.59 | 10.08 | 3.85 | 7.84 | 12.21 | 6.02 |
| Ce | 8.79 | 11.48 | 6.71 | 7.21 | 9.19 | 8.55 | 8.29 | 6.70 | 7.83 | 9.84 | 6.84 | 6.68 | 6.98 | 6.82 | 7.80 | 8.01 | 5.33 | 5.14 | 14.86 | 9.85 | 18.50 | 20.13 | 12.07 |
| Pr | 1.03 | 1.60 | 0.95 | 0.97 | 1.20 | 1.25 | 1.19 | 0.94 | 1.11 | 1.48 | 0.91 | 0.89 | 1.00 | 1.03 | 1.19 | 1.16 | 0.77 | 0.81 | 2.30 | 1.26 | 2.36 | 2.76 | 1.54 |
| Nd | 4.18 | 6.64 | 3.82 | 4.38 | 5.03 | 4.74 | 5.05 | 3.65 | 4.27 | 5.96 | 3.43 | 3.63 | 3.75 | 4.28 | 4.53 | 4.58 | 3.02 | 3.19 | 9.14 | 5.46 | 9.80 | 10.30 | 6.04 |
| Sm | 1.07 | 1.55 | 0.86 | 0.86 | 1.26 | 0.99 | 1.06 | 0.80 | 0.92 | 1.33 | 0.68 | 0.60 | 0.78 | 0.83 | 1.02 | 0.98 | 0.72 | 0.62 | 2.04 | 1.21 | 1.78 | 2.02 | 1.29 |
| Eu | 0.32 | 0.34 | 0.20 | 0.20 | 0.30 | 0.26 | 0.30 | 0.19 | 0.25 | 0.32 | 0.16 | 0.14 | 0.19 | 0.22 | 0.23 | 0.24 | 0.15 | 0.16 | 0.52 | 0.30 | 0.49 | 0.50 | 0.35 |
| Gd | 0.94 | 1.31 | 1.05 | 0.80 | 1.18 | 1.15 | 1.09 | 0.88 | 0.91 | 1.40 | 0.64 | 0.68 | 0.72 | 0.83 | 0.93 | 1.02 | 0.62 | 0.71 | 2.41 | 0.91 | 1.64 | 1.66 | 1.00 |
| Dy | 0.94 | 1.17 | 0.83 | 0.75 | 1.04 | 1.22 | 1.03 | 0.72 | 0.94 | 1.43 | 0.70 | 0.52 | 0.60 | 0.78 | 0.82 | 0.96 | 0.54 | 0.60 | 2.33 | 0.84 | 1.22 | 1.39 | 0.83 |
| Ho | 0.21 | 0.24 | 0.17 | 0.18 | 0.20 | 0.21 | 0.21 | 0.13 | 0.18 | 0.31 | 0.12 | 0.09 | 0.12 | 0.17 | 0.18 | 0.24 | 0.13 | 0.14 | 0.48 | 0.14 | 0.27 | 0.28 | 0.17 |
| Er | 0.65 | 0.60 | 0.46 | 0.41 | 0.51 | 0.75 | 0.53 | 0.34 | 0.52 | 0.80 | 0.34 | 0.29 | 0.39 | 0.48 | 0.51 | 0.66 | 0.33 | 0.39 | 1.48 | 0.37 | 0.65 | 0.70 | 0.42 |
| Tm | 0.09 | 0.11 | 0.07 | 0.07 | 0.06 | 0.09 | 0.08 | 0.05 | 0.08 | 0.14 | 0.06 | 0.05 | 0.06 | 0.08 | 0.07 | 0.10 | 0.05 | 0.07 | 0.24 | 0.05 | 0.10 | 0.12 | 0.06 |
| Yb | 0.66 | 0.60 | 0.53 | 0.41 | 0.45 | 0.73 | 0.49 | 0.36 | 0.54 | 0.85 | 0.34 | 0.39 | 0.39 | 0.49 | 0.56 | 0.74 | 0.34 | 0.37 | 1.47 | 0.30 | 0.64 | 0.65 | 0.38 |
| Lu | 0.09 | 0.10 | 0.08 | 0.07 | 0.06 | 0.11 | 0.08 | 0.04 | 0.08 | 0.14 | 0.06 | 0.05 | 0.06 | 0.07 | 0.09 | 0.11 | 0.06 | 0.05 | 0.24 | 0.05 | 0.10 | 0.10 | 0.06 |
| Eu/Eua | 1.50 | 1.12 | 0.99 | 1.14 | 1.16 | 1.15 | 1.31 | 1.07 | 1.29 | 1.10 | 1.14 | 1.03 | 1.19 | 1.25 | 1.11 | 1.13 | 1.06 | 1.14 | 1.10 | 1.36 | 1.36 | 1.28 | 1.46 |
| Ce anomaly after[10] | −0.02 | −0.08 | −0.08 | −0.08 | −0.02 | −0.12 | −0.10 | −0.05 | −0.09 | −0.10 | −0.08 | −0.06 | −0.08 | −0.12 | −0.11 | −0.55 | −0.10 | 0.16 | −0.15 | −0.42 | −0.57 | −0.60 | −0.81 |
| δ13CPDB (‰) | −3.34 | −3.43 | −3.52 | −3.75 | −3.48 | −3.64 | −3.62 | −3.92 | −3.68 | −4.02 | −4.01 | −3.86 | −3.65 | −3.52 | −3.72 | −3.81 | −3.97 | −5.05 | −6.15 | −5. 58 | −6. 51 | ||
| δ18OSMOW (‰) | 25.57 | 25.47 | 25.30 | 26.37 | 25.92 | 26.55 | 26.05 | 26.66 | 26.00 | 26.62 | 26.85 | 27.06 | 26.45 | 26.06 | 26.21 | 27.57 | 26.95 | 23.04 | 21.70 | 23.53 | 23.09 | ||
| δ18OPDB (‰) | −5.18 | −5.27 | −5.44 | −4.40 | −4.83 | −4.22 | −4.71 | −4.12 | −4.76 | −4.16 | −3.94 | −3.74 | −4.32 | −4.70 | −4.55 | −3.24 | −3.83 | −7.63 | −8.93 | −7.58 | −7.58 | ||
| 87Sr/86Sr | 0.706704 | 0.706054 | 0.706406 | 0.707290 | 0.707129 | 0.708086 | |||||||||||||||||
| ( 87 Sr/ 86 Sr) b | (0.711159) | (0.714348) |
a Fe2O3 total iron as Fe2O3; l.i.: loss on ignition; dl: detection limit.
b No leaching and complete dissolution (for comparison).
Major and trace element contents and isotopic data are presented in Table 2.
4.2 Major elements
The vertical evolution of major element contents is presented in Fig. 4. Whole-rock MgO contents (14–19%) and CaO contents (30–34%) confirm that the dolostones are mainly made of dolomite or Ca-dolomite. Other constituents correspond to the previously recognized siliciclastic fragments, as confirmed by the parallel trends of SiO2, Al2O3, and Fe2O3. The upper carbonates are more variable in compositions, with MgO contents ranging from 13.35 to 0.43%, pointing to their variably dolomitized nature. Some limestones contain up to 20% clay minerals as evidenced by their high SiO2 and Al2O3 contents (e.g., 7150).
4.3 Trace elements
Trace elements are especially important to assess palaeoenvironmental conditions and possible diagenetic effects. Their vertical evolution is presented in Figs. 4 and 5
Mn contents range from 542 to 1472 ppm in the dolostones and from 930 to 1239 ppm in the limestones. High Mn contents together with Mn/Sr > 2 are often regarded as tracers of diagenetic alteration in calcitic limestones [19], as non-marine diagenetic fluids are commonly enriched in Mn. Diagenetic alteration cannot be excluded in the Bwipe limestones, where there is evidence of secondary modifications. However, we consider the high Mn contents of the dolostones to be primary, as they roughly parallel the variations of other redox-sensitive elements. Incorporation of Mn in dolomite requires that this element is in a reduced divalent state. Yoshioka et al. [44] also interpret high Mn/Sr ratios as witnessing a peculiar seawater composition rather than diagenetic alteration.
Redox-sensitive chalcophile elements such as As, Cd, Mo, Ni, V and Zn can be used to infer the redox conditions in the sediment pore water [38]. In Fig. 5, all elements are normalized to Al × 10−4 and compared to the corresponding average shale ratios [48] to check for a terrigenous contribution. Most values are higher than average shale ratios at specific levels in the dolostone section (especially near the base), suggesting suboxic to anoxic conditions in the sediment during these periods of time. Excess (over detrital) concentrations are either associated with organic compounds or may be derived from seawater. Cadmium is a good indicator of sulphide production from sulphate reduction [7], even at low production level. Here, its enrichment factor with respect to average shales is 40–300, suggesting that sulphate reduction was active in the sediment. V or Ni can be preferentially enriched in an organic-rich sediment column, depending on Eh, pH and sulfide activity. Thus, the V/(V + Ni) ratio, or so-called vanadium-nickel fraction, is used to precise the redox conditions in the sediment [13,27,37]. In most Bwipe dolostones, the values correspond to oxic or dysoxic conditions.
Barite formation is associated with decomposition of organic matter in pelagic sediments and Ba may even be regarded as a productivity indicator [8,9]. In nearshore areas, the relationship is not simple, but the (Ba/Al) × 10−4 ratio is used qualitatively in order to check excess (over detrital fraction) Ba and to look for some vertical variation (Fig. 4). The highest ratios correspond to the upper limestones. The lowermost dolomites are also characterized by relatively high Ba/Al ratios.
Total rare-earth element (REE) contents are in the typical range of marine carbonates. Moreover, the REE distribution patterns normalised to the post-Archaean Australian shales (PAAS) often resemble the oceanic seawater distribution patterns provided by Elderfield and Greaves [11] (Fig. 6), despite a noticeable positive Eu anomaly in the Bwipe carbonates. The Ce negative anomaly of the dolostones (calculated after [10]) is small (−0.02 to −0.16), except for one sample (7144). The oxic-anoxic condition limit is at −0.1 after Wright et al. [49]. Therefore, the cap dolostones characterized by a Ce anomaly between −0.1 and −0.02 reflect anoxic or, rather, suboxic conditions in agreement with the trace metal distributions. Strongly anoxic (euxinic) conditions would yield no negative anomaly or a positive one, like in the present-day anoxic Cariaco Trench or in the Black Sea [17]. The Ce anomaly ranges from −0.42 to −0.81 in the upper limestones. In the modern ocean, values less than −0.45 are not encountered. Therefore, strongly negative values question the validity of the interpretation of the Ce anomaly as a palaeoredox proxy. Indeed, Ce depletion can also results from post-depositional alteration [40], a likely explanation in the case of the Bwipe limestones.
Trace-element contents suggest both high organic productivity and suboxic conditions in the sediment, implying that a significant number of sulphate-reducing bacteria were likely operating at the time of sediment deposition. Nevertheless, pyrite formation did not occur, possibly because the amount of available iron was very low.
4.4 Isotopes
In the northern part of the Volta Basin, Porter et al. [34] measured δ13C (‰ PDB) at −2 to −3 dropping to −8‰ up section. The Bwipe carbonates display a similar evolution from an average value of −3.7‰ in the dolostones to more negative values (−5 to −6.5‰) in the upper limestones (Fig. 7). Moreover, the dolostones have remarkably consistent δ13C values throughout the section. These values are in the range of other Neoproterozoic cap dolostones worldwide ([15] and references therein). They are regarded as a primary basin-scale signature.
δ18OSMOW and δ18OPDB are also presented in Fig. 7. The δ18OPDB is around −6‰ in the dolostones and falls to more negative values (−9‰) in the limestones. Although the discrepancy between δ13C and δ18O values from the dolostones and limestones are in the expected range depending upon their respective lithology [43], only the dolostone values are regarded as significant, because of their well-preserved primary sedimentological features.
Strontium contents range from 35 to 75 ppm in the dolostones and from 48 to 104 ppm in the upper limestones. 87Sr/86Sr ratios of a few samples are presented in Fig. 7. They are in the 0.7061-to-0.7073 range for the dolostones and increase in the limestones (0.7081). We consider the 0.7061–0.7073 values in the dolomites as reflecting the seawater signature at deposition time, as these rocks were formed in peritidal conditions and preserved primary sedimentary features. The higher Sr ratios of the limestones are regarded as non-significant, because these rocks were secondarily modified.
5 Discussion
5.1 Isotopic correlations
C and Sr isotopes are temptatively used for temporal correlations, despite many uncertainties regarding the Neoproterozoic reference curves, as well as the ages of the glaciations [5,30]. Only the cap dolostones values are plotted, because they are the most significant values. The C isotope signature alone is not sufficient to identify any Neoproterozoic glaciation in particular (Fig. 8). The low 87Sr/86Sr ratios exclude the possibility that the cap carbonates from the Volta Basin may be related to the 580-Ma-old Gaskiers (or Varangian) glaciation that followed the Pan-African Orogeny, but field relationships already permitted to reach this conclusion. Unfortunately, it is still impossible to decide between a post-Sturtian (730–680 Ma) or a post-Marinoan (630 Ma) deposition age. Using the values of the lowermost dolostones, a post-Sturtian age would be preferred. These low values are significant, as they imply either that the seawater signature was dominated by oceanic hydrothermal processes, hence mantle-like values, or that the continental detrital input was dominated by weathering of young and/or mantle-derived material.
5.1.1 A microbially-mediated model for the formation of the cap dolostones
Dolomite is well-known for being impossible to precipitate inorganically at normal surface conditions, even from supersaturated seawater, hence the so-called ‘dolomite problem’ [46]. In the Bwipe cap dolostones, sedimentological features point to the early formation of dolomite and provide strong indications of microbial life at the time of deposition of the sediments. Trace element data are consistent with suboxic conditions developing below the sediment–water interface. Under these conditions, organic matter is degraded by sulphate-reducing bacteria yielding light-carbon-enriched bicarbonate by the reaction:
In the absence of free iron that could induce pyrite formation, H2S is either lost in the aqueous medium or consumed by sulphur-oxidizing bacteria, often associated with sulphate-reducing bacteria in a microbial consortium [6,32]. It can also be responsible for the spontaneous reduction of manganese [33], yielding free Mn2+ ions easily incorporated in the precipitated carbonates. In addition, sulphate-reducing bacteria destroy the magnesium-sulphate ion pair, yielding free Mg2+ available for the precipitation of dolomite. Bacterially induced dolomite precipitation in anoxic conditions presently occurs in hypersaline lagoons, such as the Lagoa Vermelha (Rio de Janeiro, Brazil [42]), and has been reproduced in culture experiments [41,47]. Bicarbonate ions consumed for the precipitation of dolomite are partly derived from organic matter; hence the negative C isotope signatures of this sulphate-reduction-induced carbonate (Fig. 9). Such organogenic dolomites are not really extensive today, but they can have been more so in the shallow seas resulting from the worldwide transgression due to ice thaw in the snowball earth aftermath.
The negative C isotope signatures of cap carbonates worldwide received various explanations. The suggestion that it reflected mantle-like values due to organic productivity collapse during a Snowball ice age [14] is challenged by the undisputable ability of microbial life to survive in the most extreme environments [45]. Rather, a huge bloom of microorganic productivity is expected during the Snowball aftermath, due to warm temperatures and large inputs of nutrients provided by the reactivation of oceanic circulations and enhancement of the hydrological cycle [26]. Then, in protected environments, organic matter has been accumulating, surpassing the capacities of complete re-oxidation of the environment. In these conditions and as long as sulphate ions are available, sulphate-reducing bacteria are the dominant microbe species [28]. Despite the recognition that negative C isotope signatures witness the mediation of sulphate reducers in modern dolomites [29,42], this interpretation has not been favoured for Neoproterozoic dolomites so far. Nevertheless, intense bacterial sulphate reduction has been suggested to explain recent S isotopes data from cap carbonates elsewhere in the world [12,18]. By contrast, a lot of interest has arisen from local strongly negative C signatures regarded as the consequence of methane degassing ([22,24]). Indeed, dolomite can be formed in the methane oxidation zone, at the boundary between the sulphate reduction zone and the methanogenesis zone [31]. In this case, highly variable, negative to strongly negative carbon isotope signatures are expected, but the relevant carbonates are local and volumetrically minor. However, sulphate-reduction and methanogenesis are generally mutually exclusive [29]. Methane-producing bacteria are strict anaerobes and can only use small organic metabolites produced by fermenters [33]. They strongly fractionate light carbon in methane, indirectly yielding 13C-enriched bicarbonate, hence the positive C isotope signatures of dolomites produced in the methanogenetic zone (Fig. 9). Such a positive signature is generally not observed in the cap carbonates directly overlying glaciogenic rocks worldwide. Hence, we favour the hypothesis of dolomite formation in the sulphate-reduction zone.
6 Conclusions
The Volta cap dolostones display primary sedimentary features, consistent with early precipitation of their dolomicrite constituent. They were deposited just after a sharp turnover from glacial to peritidal, arid conditions in an environment dominated by microbial activity, as indicated by the abundance of microbial mats, the preservation of relict microbial filaments and geochemical proxies for high organic productivity. Redox-sensitive trace element contents imply suboxic conditions in the sediment, suggesting that organic matter was degraded by sulphate-reducing bacteria. Precipitation of dolomite with negative C isotope signatures is regarded as the consequence of this microbial activity, which destroyed the magnesium–sulphate ionic pairs and produced organic-derived 12C-enriched bicarbonate. Such a microbially-mediated process was recently observed in present-day field analogues and in culture experiments. It is proposed that bacterial sulphate reduction is responsible for the specific characters of cap dolostones worldwide in the aftermath of the Neoproterozoic Snowball Earth.
Acknowledgments
Fieldwork and analytical costs were supported by the CNRS–ECLIPSE program. Technical assistance by A.C. Abraham, T. Aigouy, C. Cavaré-Hester, J.-F. Mena and F. de Parceval is acknowledged. J.-L. Bouchez (Toulouse) and M. Pagel (Orsay) are warmly thanked for the cathodoluminescence image, and O. Pokrovsky (Toulouse) for some mineral determination and many stimulating discussions. Reviews by G. Halverson, G. Shields and N. Tribovillard helped to improve the manuscript.