

1 Introduction
In the densely populated coastal region of southern India where thousands of borewells are the sole source of supply, approximately 750 km of coast were inundated following the 26 December 2004 tsunami event [1,10–13]. Groundwater supplies were either disrupted or destroyed. Potential salinization of groundwater due to a brief period of inundation and consequent damage to long-term regional groundwater resources were not quantified before this tsunami event.
We analyzed data from 21 km of Bay of Bengal coast between Marakanam and Pondicherry (Tamil Nadu, India). This region contains 25 villages and has more than 1300 wells that supply 1.7 million m3 of water annually from the Dune aquifer. The shallow sandy Dune aquifer provides 40–60% of groundwater supplies, which go to coconut plantations for irrigation and ≈ 20,000 villagers for domestic use. Unlike other areas of India that employ open dug-wells, in this region the aquifer is unconsolidated and small-diameter, perforated cased borewells are primarily used [3]. In December, before the tsunami, mild salinity increases were recorded over time in the Dune aquifer. These increases were due to subsurface seawater intrusion as a consequence of uncontrolled pumping coupled with below-average recharge due to low monsoon precipitation during 2001–2003. However, salinity remained low enough that groundwater was fit for domestic and agricultural use.
Our original data and simulation results suggest that the Indonesian tsunami caused groundwater salinity to increase following the event, making the groundwater unusable for domestic and agricultural purposes. Quantitative analysis involved simulation of soil moisture to test whether a brief episode of inundation was responsible for the observed salinity increase in the shallow Dune aquifer and to estimate the time frame for tsunami water to infiltrate to the water table. In addition, aquifer simulations were used to predict the likely time frame for the aquifer to be flushed of saline water. Our results have implications for this and other regions that are susceptible to inundation of coastal aquifers. We provide useful guidelines for water management organizations to avoid repeating the problem of groundwater salinization due to coastal inundation.
2 Methods
2.1 Groundwater salinity
Salinity was measured using a WTW-Multi 340i portable electrical conductivity (EC) meter. Two sets of units are shown for convenience of the reader: the EC was measured in the field and the classical conversion factor of 0.67 was applied to convert EC to TDS. These measurements were done on water samples extracted using each well's sealed hand pump after pumping approximately 250 L. One well was open and a grab sample was taken following the above procedure. The instrument was cleaned with distilled water between measurements and the cell constants were determined using a 0.01 mol/L KCl control standard. Monthly measurements between December 2004 and August 2006 (except in February 2005 and in August 2005) were taken from 16 wells in 2004, declining to seven wells that remained in 2006 (Figs. 1 and 2). Those wells were previously part of a water quality monitoring network for the sand Dune aquifer. After the tsunami, many wells were abandoned because salinity increased or residents relocated. At these abandoned monitoring wells, hand pumps were removed and the holes filled, thereby preventing us from making further measurements.
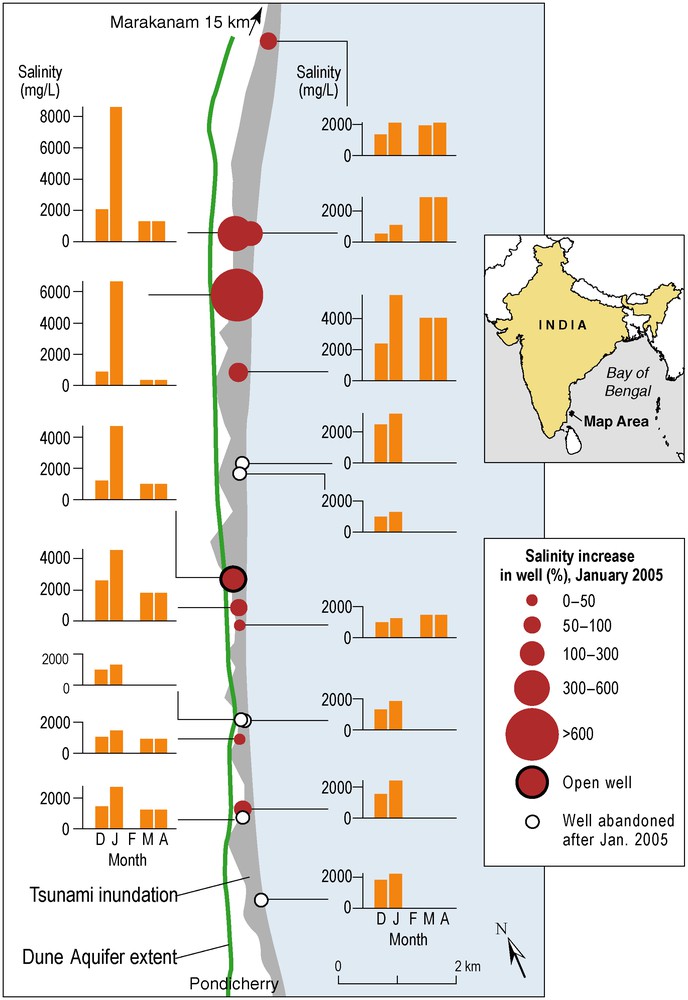
Percent salinity increase in groundwater from wells in the Dune aquifer of southeastern India between 20 December 2004 (before the tsunami) and subsequent surveys in January, March, and April 2005. Also shown are the inland extent of the tsunami and the extent of the Dune aquifer. Bar graphs show concentration history data from the 10 remaining wells for the four surveys. D. 20 December 2004. J. 10–25 January 2005. M. 23 March 2005. A. 12–17 April 2005. Six wells were abandoned after the second survey and are displayed as noted in the key. As indicated, one of the wells is an open well; the remainder are small-diameter sealed tube wells. Masquer
Percent salinity increase in groundwater from wells in the Dune aquifer of southeastern India between 20 December 2004 (before the tsunami) and subsequent surveys in January, March, and April 2005. Also shown are the inland extent of the tsunami and ... Lire la suite
Fig. 1. Pourcentage d’augmentation de la salinité des eaux souterraines de l’aquifère des dunes du Sud-Est de l’Inde entre le 20 décembre 2004 (avant le tsunami) et les campagnes qui ont suivi en janvier, mars et avril 2005. Sont aussi représentées, l’extension à l’intérieur des terres du tsunami, ainsi que l’extension de l’aquifère des dunes. Les histogrammes montrent l’historique des données recueillies sur les dix forages au cours des quatre campagnes de mesures. D. 20 décembre 2004. J. 10–25 janvier 2005. M. 23 mars 2005. A. 12–17 avril 2005. Six forages ont été abandonnés après la seconde campagne de mesures et sont mentionnés dans la légende. Comme indiqué, l’un des forages est un puits ouvert en gros diamètre alors que les autres sont des puits tubés en petit diamètre munis d’une pompe à main. Masquer
Fig. 1. Pourcentage d’augmentation de la salinité des eaux souterraines de l’aquifère des dunes du Sud-Est de l’Inde entre le 20 décembre 2004 (avant le tsunami) et les campagnes qui ont suivi en janvier, mars et avril 2005. Sont aussi ... Lire la suite
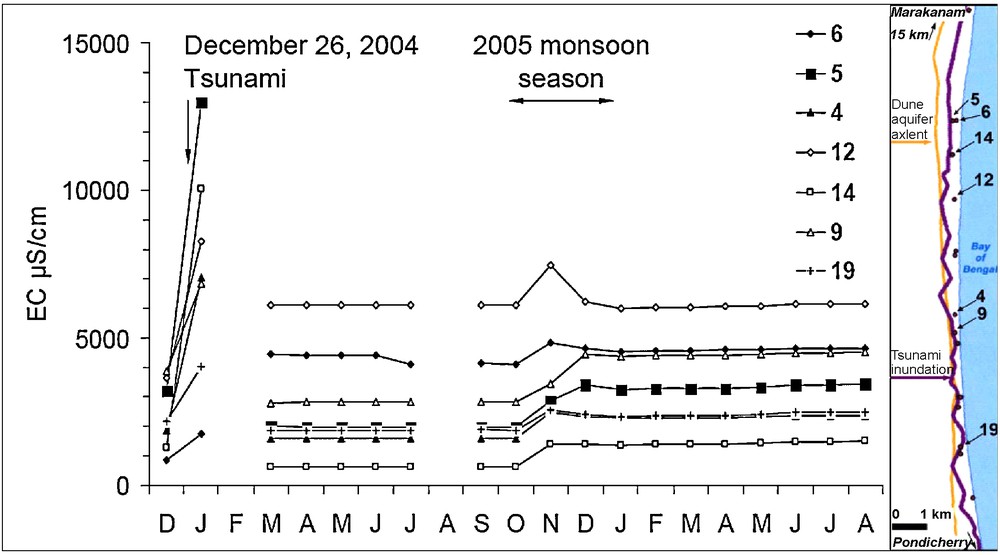
Electrical conductivity (EC) time evolution in groundwater from seven wells in the Dune aquifer of southeastern India between 20 December 2004 (before the tsunami) and subsequent monthly surveys till August 2006. On the right inset shown are the inland extent of the tsunami, the extent of the Dune aquifer and the borewell locations.
Fig. 2. Évolution temporelle de la conductivité électrique des eaux souterraines issues de sept forages de l’aquifère des dunes du Sud-Est de l’Inde entre le 20 décembre 2004 (avant le tsunami) et août 2006. Dans l’encadré situé à droite, sont représentées l’extension du tsunami, l’extension de l’aquifère des dunes et la position des forages.
2.2 Tsunami depth and extent
After the tsunami, the inundated extent was mapped based on a field survey of 107 GPS-georeferenced (GARMIN, model E-Trex) locations along 37 km of coastline. Evidence of inundation included physical damage and disruption that delineated the high-water mark, such as sedimentation, staining, and dead vegetation. The average distance between any two points (of the previous 107 GPS-georeferenced locations) was 300 m except for two of them, which were 2 km apart. The coastline was mapped using satellite imagery (Landsat, 28 October 2000). At a few GPS-georeferenced locations, the apparent height of the tsunami was carefully measured by identifying remnant effects such as watermarks on buildings. All georeferenced data were compiled in a GIS database from which the distance of each well relative to the inland extent of the tsunami was determined.
2.3 Unsaturated zone modeling
Unsaturated flow simulations were conducted to estimate the time frame for ponded seawater from tsunami inundation to recharge to a water table depth of 3.5 m (median depth: 3.5 m; mean: 3.9 ± 1.0 m). The median depth was determined from a post-tsunami survey of 19 wells that neighbored the 16 wells where groundwater was monitored for EC. The original 16 wells were sealed by hand pumps thereby preventing water-level measurements. We employed the Hydrus-1D code, which solves the finite-element form of the Richards’ equation [17], to model variably-saturated flow. Hydraulic parameters used were for sand with residual soil water content of 0.053, saturated soil water content of 0.375, and saturated hydraulic conductivity of 7.44 × 10⁻⁵ m/s. These parameter values were based on those in the literature [20] and correspond to an unconfined sandy aquifer. The unsaturated hydraulic conductivity function was described by the van Genuchten–Mualem model [21] with empirical hydraulic function shape parameter values α = 0.353 × 10⁻³ m–1 (related to the inverse of the air entry value), n = 3.18 (a pore size distribution index), and l = 0.5 (pore-connectivity) [15]. The vertical 3.5 m profile was discretized into 101 equal cells. The initial and maximum time steps were 0.32 and 30 s, respectively. Boundary conditions were variable pressure/flux at the ground surface (declining shallow pond levels followed by no flux) and free drainage at the bottom. Based on simulation of soil drainage during the dry period preceding the tsunami, an average initial pressure head of −1.55 m was applied to the unsaturated sand.
2.4 Saturated flow simulation
A field survey conducted in 2003 of 1316 wells in the Dune aquifer provided data to develop a simplified groundwater flow model. A synthetic West-East cross section is provided in Fig. 3. Wells were located and georeferenced using GPS (GARMIN, model E-Trex). The extent of the Dune aquifer was based on geologic maps of this area [5]. Unfortunately, no aquifer pumping tests were available for the Dune aquifer. A hydraulic conductivity value of 5 × 10⁻⁵ m/s and effective porosity of 0.30 were used based on similar dune sands [20]. Recharge to the aquifer was taken as the long-term average of 200 mm/year. The average rainfall during 1911–2003 was 1217 mm according to regional weather station data provided by the local public works department's groundwater unit. Field studies have estimated that recharge is 15.5 to 18% of average rainfall (i.e., 189 to 219 mm/year) or 204 mm/year [2,19].
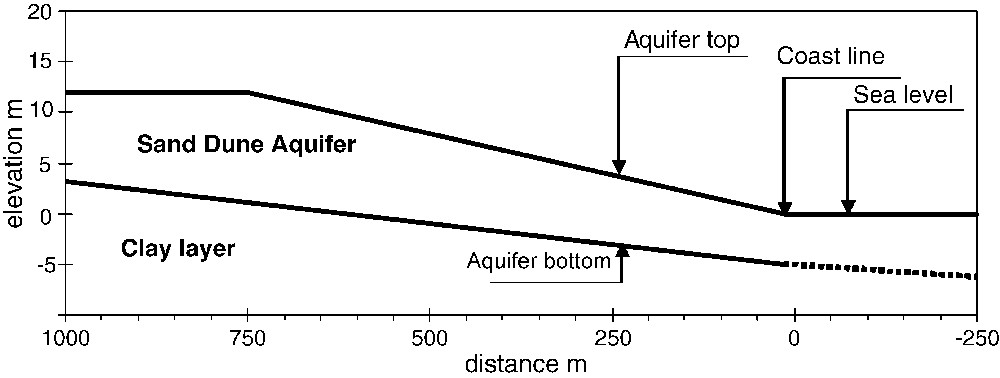
Synthetic West-East cross section of the sand Dune aquifer.
Fig. 3. Coupe synthétique Ouest-Est de l’aquifère des sables dunaires.
Based on the 1316-well georeferenced database, the unconfined Dune aquifer system was conceptualized as a 1 km-wide strip extending seaward as a vertically increasing wedge. Lithologic data suggest that the underlying impervious thin clay layer slopes toward the sea and the average sand dune formation thickness is 12.5 ± 4.1 m. Simulation involved solution of the 2D steady-state saturated flow equation to obtain the hydraulic-head distribution. The finite-difference code MODFLOW [7,8] without density-dependent flow was employed using a graphical interface. Boundary conditions were zero-gradient to the west where no flow occurs because the aquifer pinches out, and a constant head corresponding to sea level along the coast. Estimated flow lines on the north and south served as no-flow boundaries. The aquifer thickness was reduced to 1 m along the coast to account for the presence of the subsurface saltwater interface. Particle tracking using MODPATH [16] was used to estimate advective travel times. The plan–view model domain consisted of 50 × 50 cells discretized into 20-m cells. Simulations involved parametric variation of hydraulic conductivity and recharge to bracket the likely range of travel times. The range of hydraulic conductivity was 3 × 10⁻⁵ to 7 × 10⁻⁵ m/s and the range of recharge was 100 to 300 mm/year.
3 Results
3.1 Field measurements and data analysis
Along the 21 km of Bay of Bengal coast between Marakanam and Pondicherry, the tsunami reached a maximum distance of 500 m inland (Fig. 1), inundating the Dune aquifer [3]. We measured seawater heights of 2 m at 35 m from the coastline, 0.30 m at 200 m, and nominal inundation 500 m from the coastline. According to witnesses, inundation lasted less than 5 min, although some depressions remained filled with seawater for 2–3 days. Consequently, the Dune aquifer was subjected to direct infiltration of seawater.
Baseline data collected in December, before the tsunami, from 16 wells showed average salinity of 2230 ± 930 μS/cm (1490 ± 620 mg/L) and a range of 860 to 3860 μS/cm (580 to 2590 mg/L). A monitoring survey conducted during 10–25 January 2005, for the same 16 wells showed an average salinity value of 4780 ± 3350 μS/cm (3200 ± 2240 mg/L) and a range of 1720 to 13,000 μS/cm (1150 to 8710 mg/L, Fig. 1). Given this ≈ 125% average increase in salinity, the water was no longer suitable for domestic or agricultural use. Pre-tsunami groundwater in the upper 5 m of the aquifer mixed with 5% seawater is sufficient to explain the salinity increase. Assuming that posttsunami groundwater was obtained from a typical borehole penetrating the first 5 m below the water table (5 m into the saturated sand dune) we calculate that ≈ 7.5 cm (0.075 m) of seawater recharge would, on average, result in the observed salinity increase. Unsaturated flow modeling was used to determine if this quantity of recharge could occur due to direct inundation and slow infiltration from temporarily ponded seawater.
After the initial monitored increase in salinity in January, approximately 1 month after the tsunami, we conducted two additional surveys on 23 March and 12–17 April, 2005. Because of the initial salinization of groundwater, six of the original 16 borewells were abandoned, and additional measurements at these wells were prevented. Of the ten remaining monitored wells, 86 days after the tsunami event, four of them remain highly saline, and two of those four showed an increase in salinity. The remaining six wells, lying inland, showed recovery. Only one open well (Fig. 1) exists, and it has shown rapid recovery from an initially high salinity level. This recovery is likely a consequence of continuous pumping aimed at drawing in fresh groundwater from the west.
Spatial analysis of the data indicates that the distance of a well from the coast relative to the run-up extent of the tsunami is an important indicator of whether natural recovery is likely to rapidly occur. Those wells lying halfway from the coast relative to the tsunami run-up distance remained contaminated. Wells situated to the west, beyond the halfway tsunami run-up distance, have been naturally remediated in less than 3 months (Fig. 1). Rapid remediation of the inland wells is likely the result of two effects:
- • the inundation and seawater ponding depth diminished to the west;
- • horizontal groundwater flow toward the coast has displaced the saline water.
It is noteworthy that little change in salinity occurred between March and April. During this period, recharge was minimal given the high potential evapotranspiration rate of 500 mm versus only 93.3 mm of rainfall in this same period (Harvest station). The historical intermonsoonal dry season continued until July when the southwest monsoon brought sporadic low rainfall. Aquifer recharge is more likely to occur from October to December during the southeast monsoon. Monsoonal recharge would leach and dilute stored subsurface brine and force the downward migration of any accumulation of this brine. Our data support the occurrence of this mechanism. A second saline pulse was recorded between November and December 2005 in the seven borewells that remained. Three of the remaining borewells were abandoned because they were saline and residents left the area. Data collected in October 2005, before the monsoon season, from seven wells showed an increase: average salinity of 2730 ± 1710 μS/cm (1830 ± 1150 mg/L) and a range of 610 to 6110 μS/cm (410 to 4090 mg/L). A monitoring survey conducted during November 2005, after the monsoons began, for the same seven wells, showed an average salinity value of 3580 ± 1880 μS/cm (2400 ± 1260 mg/L) and a range of 1390 to 7460 μS/cm (930 to 5000 mg/L, Fig. 2). Pre-monsoon groundwater in the upper 5 m of the aquifer mixed with 1.5% residual seawater residing in the unsaturated zone would be sufficient to explain the new salinity peak. We suspected that a pulse of residual saline soil water from the tsunami was stored in the unsaturated zone and was leached to the water table during the post-tsunami monsoon.
3.2 Unsaturated zone modeling
Our data analysis suggests that tsunami flooding and post-tsunami infiltration through depressions temporarily filled with seawater are responsible for the observed salinity increase. Antecedent soil moisture conditions were dry because the northeast monsoon season occurred one month early in 2004 (September to November, instead of October to December). There was very little rainfall for the 1 month period preceding the tsunami (9.4 mm, Harvest station). Numerical simulation [17] of vertical seawater infiltration indicates that 5 min of 10 cm tsunami inundation results in initial recharge to the water table after 13 days. Only 0.3 cm of seawater recharge to the 3.5 m deep water table occurred within 15 days and recharge of 2.6 cm occurred after 30 days. Under the average conditions considered, these simulation results suggest that infiltration of the tsunami wave alone was only partially responsible for the observed salinization. Infiltration of seawater occurs through small local depressions that remained filled with seawater for 12 min after the retreat of the tsunami. This is considered an average ponding period over the area where some places had no depressions and others had standing water for days. Simulated ponds, whose depths decreased steadily with time, were assumed to drain totally (complete infiltration) 17 min after the tsunami hit. Under these conditions, recharge of 7.5 cm of seawater occurred within 13 days. Simulation results suggest that 10.5 cm of seawater recharged after 30 days. It appears that a large portion of the tsunami water infiltrated over a short time period and resulted in about 105 mm of recharge. This is striking when compared to rainfall of which only 18% of average rainfall [2,19] (200 mm/year) becomes recharge. Two possible mechanisms contribute to enhanced recharge of tsunami floodwaters. First, the tsunami was a surface flooding and ponding event, so one would expect significant infiltration through the surficial sands. Second, because the tsunami destroyed much of the coastal vegetation, we suspect that the rate of transpiration of infiltrated tsunami seawater was significantly lower than of typical pre-tsunami rainfall. In addition, it is likely that the estimated 18% value commonly used for regional recharge from rainfall is too low and not representative of recharge in the outcrop area of the sand dune aquifer. Estimated infiltration through unsealed wells is inconsequential (< 0.2 cm). Sensitivity analysis on boundary condition types at the bottom of the unsaturated zone did not produce any significant difference in our result. The analysis suggests that inundation and infiltration processes left significant salt in the unsaturated zone. Our sampling data and unsaturated flow modeling suggest that seawater stored in porous media above the water table was driven to the water table during the next monsoonal season beginning in October 2005.
3.3 Saturated flow modeling
To simply estimate a time frame for rainwater recharge to displace the existing infiltrated saline tsunami pulse by lateral flow, we constructed a numerical flow model of the 1 km-wide Dune aquifer [6] using hydraulic property values of similar dune sands [20]. Average annual monsoonal recharge of 200 mm/year, which is 15.5 to 18% of average rainfall [2,19] feeds the aquifer. In the model, discharge occurs naturally at the coast, and pumping is halted. We used groundwater advective travel times to estimate the period required to flush the aquifer, considering two starting points: the maximum inland extent of the tsunami, 500 m, and half that distance. These travel times are 7 and 3 years, respectively. Delimiting calculations indicate that the travel times to the coast starting at 500 m and at 250 m inland range from 6–10 years and 2–4 years, respectively. We recognize that a 2D model has serious limitations, but our intent merely was to provide an estimate of the range of travel times. It is recommended that future works involving design and management of the Dune aquifer employ a 3D model that accounts for fluid density changes.
4 Conclusions
Our data and analyses suggest that the impact of tsunami inundation on groundwater salinity in the unconfined coastal aquifer, such as portions of the Dune aquifer along southeastern India, not only increased acutely right after the period of inundation but is likely to persist over years. This can be detrimental to subsistence communities that depend on groundwater for domestic and agricultural supplies. Our analyses suggest that: first, pre-tsunami groundwater in the upper 5 m of the aquifer mixed with 5% rapidly recharged tsunami seawater was sufficient to explain the observed salinity increase that occurred within 1 month of the tsunami; second, corresponding to this 5% value, average recharge of seawater of ≈ 7.5 cm is consistent with the observed salinity increase; third, both infiltration of tsunami seawater and post-tsunami infiltration through temporarily filled depressions were responsible for the observed salinity increase; fourth, climatologic conditions related to monsoonal precipitation influence the rate of salinity change, which slowed during the dry season; fifth, an additional 1.5% of saline water from the tsunami was retained in the unsaturated zone and then driven to the water table during the next monsoon season (November to December 2005); the aquifer might not be flushed by natural monsoonal recharge for 3 to 7 years.
Inundation of highly permeable coastal aquifers can result in loss of valuable groundwater resources. Therefore, we recommend that: firstly, Indian legislation should evaluate inundation risks and where coastal aquifers are in potential jeopardy, settlements relying on well water should not occupy the region within 500 m of the coast; secondly, alternative, long-term solutions to provide fresh water to coastal inhabitants should be identified—this may be as “simple” as relocating wells further inland. Our findings are consistent with other studies showing that tsunami-induced soil and groundwater salinization have occurred in other coastal aquifers in Sri Lanka [9,14], South Andaman [18] and Tamil Nadu [4].
Acknowledgments
This work was supported by HELP UNESCO Program. We gratefully acknowledge the Auroville Tsunami Relief Committee. Data were collected under the supervision of G. Boulicot, director of the Auroville Water Harvest. Data and simulation analyses were conducted by S. Violette and S.M. Gorelick during S. Violette's visiting scientist position at Stanford University between January to July 2005. S.M. Gorelick's participation has been supported by US National Science Foundation grant EAR-0634709 to Stanford University. Any opinions, findings, and conclusions or recommendations expressed in this material are those of the authors and do not necessarily reflect the views of the National Science Foundation. We thank Leonard F. Konikow and Scott Tyler for their insightful comments.
Vous devez vous connecter pour continuer.
S'authentifier