

1 Introduction
Hydrological processes within catchment areas in mountain environments are often complex due to the rugged topography and basement deformation that result in heterogeneous near-surface deposits. Even though one can use hydrogeological conceptual models based on fitting the water balance, a more complete description of actual underground water processes is necessary to improve the accuracy and relevance of the models. For instance, so-called ‘physically based’ hydrogeological models such as TOPMODEL are constrained by the topography alone, but they also need additional boundary conditions and dynamic parameters [6,7,16,29]. More ‘physical’ models based upon fluid flow equations can integrate the spatial variations of hydrogeological parameters [21,43] and hence the necessity to consider a large set of input parameters [14]. These hydrogeological parameters can be obtained by borehole measurements when available, but they are representative of only a small volume in the vicinity of the hole. At a larger scale, one can extract information on these parameters from noninvasive techniques such as geophysical imaging.
During the last few decades, geophysical techniques have been progressively improved to enhance hydrogeological information ([17,24,35] and references therein).
Since 2004, our team has undertaken several hydrogeophysical surveys at the test site of La Soutte, a 6-hectare glade in the main catchment area of the Ehn river (itself an affluent of the Rhine river) located in the Vosges Mountains about 35 km south-west of the city of Strasbourg, France, at an elevation of 950 m.
The present article only aims at showing the methods used to investigate the water content of the catchment area at different spatial scales, from hundreds of meters to decimeters. Results from dedicated experiments run in this natural laboratory to study methodological aspects of hydrogeophysics such as electrical Streaming Potential [4], ground temperature measurements [5], and time-lapse DC resistivity and slug tests (Behaegel et al., submitted to Water Res. Research) are presented elsewhere.
2 Hydrogeological settings
The site of “La Soutte” constitutes the upper catchment area of the Ehn river, an affluent of the Rhine, in Northeast France. It is located about 35 km south-west of Strasbourg (Fig. 1) in the area of the Champ-du-Feu Mountains, at 48°19′30″ latitude and 7°19′30″ longitude, 950 m above sea level. The total surface of the study area is about 1 km2. The climate is subhumid to temperate, with a mean annual precipitation of 1540 mm yr−1 distributed during the spring–summer (36.8% May to September) and through autumn–winter (63.2% October to April) [8]; air temperature ranges between −10 °C in winter and +30 °C in summer.
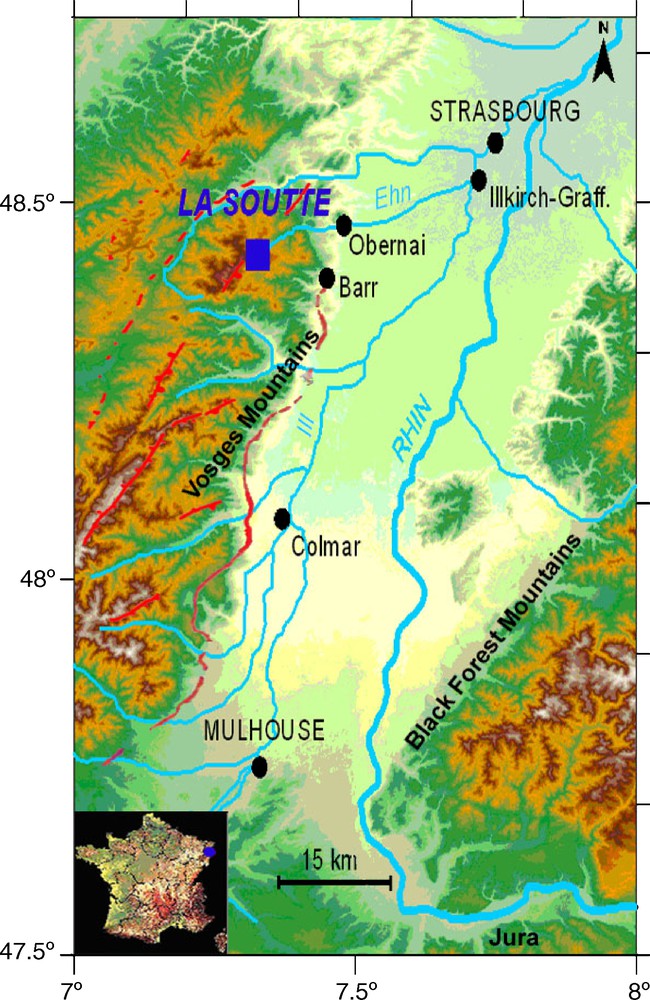
Location map of La Soutte at 950 m altitude in the Vosges Mountains (North-East France). It is in the main catchment area of the Ehn river (an affluent of the Rhine river) underlain by volcanic and crystalline rocks. These rocks form NE–SW trending geotectonic units (see the main limits indicated by red lines) of mid-European Variscides (or Hercynian) emerged from the Late Devonian to the Late Palaeozoic, about 250 My ago.
Carte de localisation de La Soutte à 950 m d’altitude dans les Vosges (Nord-Est de la France). C’est la zone principale du bassin versant de l’Ehn (un affluent du Rhin) sur des roches volcaniques et cristallines. Ces roches font parties d’unités géotectoniques orientées NE–SW (voir les principales limites indiquées par des lignes rouges) datant de l’Hercynien et émergées entre la fin du Devonien et la fin du Paléozoique, il y a environ 250 Ma.
2.1 Tectonics and petrology
We briefly introduce the complex tectonics and petrology of the study site, which is linked to the evolution of the Variscan belt from the Lower and Upper Carboniferous times [36]. It is located south of the Rhenohercynian zone and within the Saxothuringian unit, northern sector of the Lalaye–Lubine dislocation [41], a north-east-striking fractured and faulted zone, that separates the Saxothuringian and Moldanubian belts, i.e. the very low grade and the high grade metamorphic rocks units respectively [1,15].
La Soutte is located in the western part of the Upper Rhenish massif of the northern Vosges, France [13,22]. The northern Vosges area consists of three different petrological units, from south to north: the Villé unit contains low-grade metamorphic rocks (schists and quartzites) from Cambrian to Ordovician times; the Steige unit from Ordovician to Silurian times contains low-grade metamorphic rocks (metapelites schists); and lastly the Bruche unit, from the Middle Devonian to Early Carboniferous ages, contains cal-alkaline volcanoclastic rocks (basalts, andesites, dacites, rhyolites, tuffs) [33,34]. The latter includes the Median band of Champ-du-Feu, where the site is located. This consists of Paleozoic intrusions characterized by a series of high-K, calc-alkaline I-type plutonic rocks of granodioritic to granitic composition, causing contact metamorphism [1].
Based on the intrusion relationships, the mineralogical and chemical characteristics, and bibliographic analysis, Altherr et al. [1] distinguish five series in the Upper Rhine Graben sector: (1) the oldest, consisting of intrusions from the Early Carboniferous, are mafic magmas of diorites in more or less continuous bands to the south (e.g. Neuntelstein diorite) and isolated plugs to the north (Muckenbach unit); (2) the southern Suite of granodioritic units, south of the Median band, including the granodiorites of Hohwald South, Hohwald North and Champ-du-Feu South; (3) the northern Suite, made up of I-type granitic intrusions of Champ-de-Feu North and Fouday-Grendelbruch; (4) the younger or second I-type granitic generation [22] of Andlau, Natzwiller and Senones, intrusively emplaced into the older plutonic rocks and/or into the schists of Steige; (5) lastly, both igneous rocks of older generations and their contact aureoles are cross-cut by S-type granitic of the Late Variscan granitoids or Kagenfels granite [22], causing a second contact metamorphism.
In some places, the end of a compression regime involved the formation of crustal-derived granite porphyry and rhyolite dikes. In other places, the extension regime emplaced mantle-derived rocks like lamprophyres and tachylites, as dykes and/or veins.
Since the Vosges mountains were isolated as a crust emerging from the Mesozoic and Cenozoic, the orogenic evolution was dominated by a late-stage high-temperature overprint, erasing most of the information from the prograde history and causing the formation of high-grade metamorphic sequences intruded by numerous granitoid plutons.
During the Quaternary, glacial-interglacial climate cycles, cryogenic processes, fluvial and aeolian activity sculptured the “la Soutte” landscape; the widespread occurrence of fractured rocks in the boreholes as well as on outcrops and other features indicative of intensive frost weathering have been found such as block fields and frostheaved bedrocks. Moreover, above the fractured rocks, thick friable weathered plutonic and volcanic rocks (saprolites) are overlain by gravelly-sandy-silty solifluction deposits on which a paleosoil profile, no more than 3 m thick, has developed.
2.2 Underground water
Water analyses of samples taken at different places on the site (surface streams and boreholes down to 80 m) show chemical parameters characteristic of very shallow aquifers: surface streams have a pH in the range of 6–7 and electrical conductivity in the range of 25–60 μS/cm; water from the boreholes have a pH in the range of 6–9 (pH > 8 at depth > 30 m) and electrical conductivity in the range of 50–100 μS/cm. Note that other water analyses were made, providing the low concentration values of the monosilicic acid content (H4SiO4) in the range of 0.11–0.20 mmol/l; it is used as an index of the natural weathering of rocks and the transit time of water in weathered rocks [8]. We consider that the low conductivity values of the groundwater illustrate its origin, mainly from infiltration and a relatively short transit time in the ground. This is coherent with the site location, just a few meters below the level of the Vosgian ridges (altitudes of 950 m at the source of the Ehn, compared to 961 m at the ridge located 200 m north-west, and 971 m at the Nientelstein summit located 600 m south). As observed by logging, and also illustrated by the monosilicic acid content measured on water from boreholes, the groundwater is mainly located in the most weathered rocks, where plutonic rocks have been transformed into a granular medium similar to sand.
3 Hydrogeophysical imaging
3.1 Resistivity model: shallow and deep waters
Let us first consider one of the most classical rock parameters used in hydrogeophysical imaging [20,30,35]. The electrical resistivity (ρ, in Ω m) or the electrical conductivity (σ = 1/ρ, in S m−1) is the subsurface property with the highest dependence on lithology, water saturation, and ionic content of the water. Compared to other subsurface properties, it has the widest range of values, from 10−2 Ω m in massif sulfides to 105 Ω m in non-weathered igneous and metamorphic rocks; it is 20–200 Ω m in fresh water aquifers.
Before discussing the application to La Soutte, it is worth recalling the basic relation of electrical resistivity to hydrogeology properties. Due to the great differences between the electrical resistivity of the solid fraction of rocks and that of the air and/or water in the porous area, one classically considers that the rock resistivity (“bulk” resistivity ρ) obeys the following power law relation due to Archie [2]:
Our application to La Soutte is focused on complementary scales reached by two different geoelectromagnetic techniques, namely Audiomagnetotelluric (AMT) and Electrical Resistivity Imaging (ERI). The first method for great depth investigation is the Audiomagnetotelluric method (AMT). The Audiomagnetotelluric method is a frequency domain electromagnetic induction method (AMT) based on the simultaneous recording of the horizontal electric and magnetic field variations on the earth surface. AMT principles are extensively presented in [38,42,44]. The AMT system employed in this study is the StrataGem EH4 from Geometrics recording in the frequency range of 10 to 92 kHz [11–31]. The second method is the well-known DC resistivity method, which is based upon measurements of electric potential differences between two electrodes made while injecting electric current at two other electrodes [3,10]. Different electrode spacing is used to change the resolution and investigation depths (1–20 m in our study).
The 3D electrical resistivity model was obtained with the AMT following a trial-and-error forward modeling process. The model responses were computed with the algorithm of Mackie and Madden [28] at 13 frequencies between 10 Hz and 92 kHz. The final model fits the determinant of the impedance tensor with a RMS of 2.3 using an error floor of 5% in the impedance components. Fig. 2 shows the final 3D models: in the near surface a low resistivity structure can be observed (zone 1), below, there is a more resistive zone (zone 2), followed by a low resistivity structure (100 m depth, zone 3); the deeper structures show high resistive values (zone 4). Zone 1, from the surface to 15–30 m, shows the most conductive zones which range from 50 Ω m. Shallow position and resistivity values indicate the development of weathered soil and fractured rock areas containing clays and fluids. Although low resistivity values dominate on the shallow surface, higher values also exist (up to 180 Ω m). Zone 3, mostly defines weathered/fractures areas of high porosity and high water content (saturated or nearly saturated). On the other hand, the high resistivity values of zones 2 and 4 can be associated with non-fractured areas of low porosity and water content, especially in the deeper parts (> 100 m) of the model.
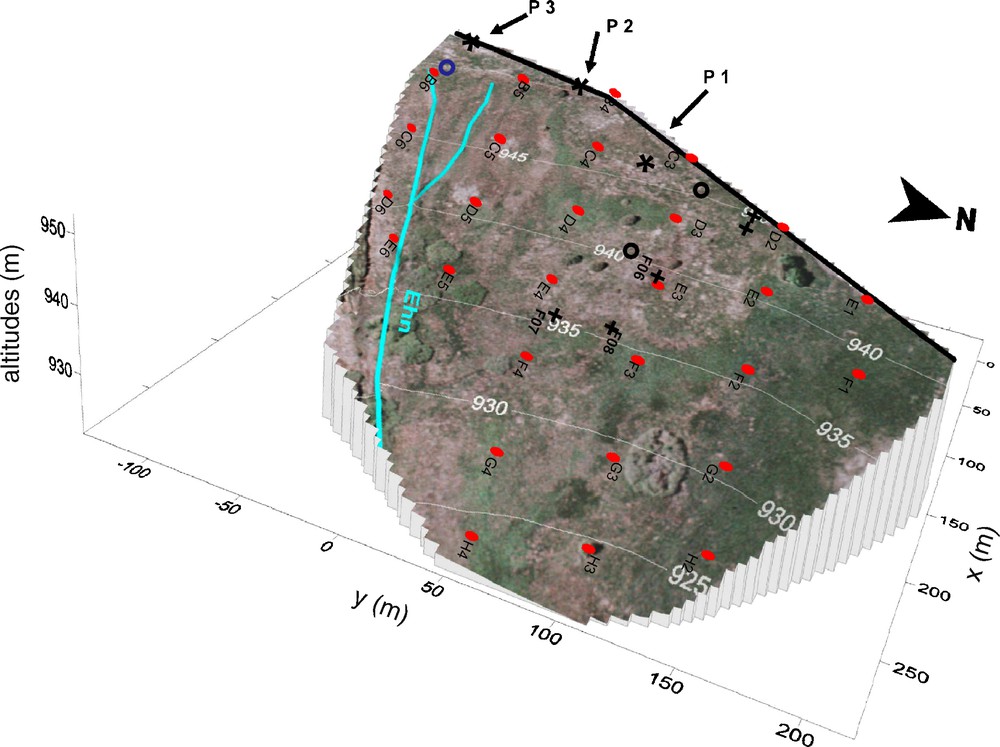
Ground surface 3D map of La Soutte, made by mapping airborne photos (from Coopération pour l’information géographique en Alsace [CIGAL]) combined with DGPS data acquired on the ground. Note that the site is a glade where a few trees grow (marked by their shadows on the image). We have marked the main water path of the Ehn river (blue line with blue circle at the main source); red points show location points of AMT soundings; other marks in black (crosses, circles and stars labeled P1, P2, P3) show well/piezometer locations. Masquer
Ground surface 3D map of La Soutte, made by mapping airborne photos (from Coopération pour l’information géographique en Alsace [CIGAL]) combined with DGPS data acquired on the ground. Note that the site is a glade where a few trees ... Lire la suite
Carte topographique 3D de La Soutte, construite par photographies aériennes (issues de la base Coopération pour l’information géographique en Alsace [CIGAL]), combinées avec des données DGPS acquises au sol. On notera que le site est une clairière comportant quelques arbres (marqués par leur ombre sur l’image). On a tracé le principal lit de l’Ehn (ligne bleue avec un cercle concentrique bleu à la source principale) ; les points rouges montrent le lieu des sondages AMT ; les autres marques noires (croix, cercles et étoiles labellisées P1, P2, P3) montrent le lieu des puits et piézomètres. Masquer
Carte topographique 3D de La Soutte, construite par photographies aériennes (issues de la base Coopération pour l’information géographique en Alsace [CIGAL]), combinées avec des données DGPS acquises au sol. On notera que le site est une clairière comportant quelques arbres ... Lire la suite
The electrical resistivity model obtained by DC (Fig. 3) also highlights contrasting geoelectrical structures with ρ = 1000 Ω m as the limit between conductive and resistive media. DC resistivity maps shallow boundaries in more detail than the AMT (Fig. 4): for example, the horizontal slice at 20 m depth clearly shows the contour of the volcanic intrusion in the north-south direction (high resistivity, in dark blue). This intrusion acts as an impermeable wall which, combined with the topography, makes near-surface streams flow in the south-westward direction (to the main stream of the river Ehn shown in Fig. 5).

Electrical resistivity model of La Soutte at large scale (depth of about 20–400 m) based upon AMT data at 32 stations (black dots, which correspond to red marks in Fig. 2): this can be used to distinguish between low resistivity and high resistivity domains imaging weathered/fractured areas (zones 1 and 2) of high porosity and high water content (saturated or nearly saturated) and basement (zones 3 and 4) of low porosity and low water content, respectively.
Modèle de résistivité électrique de La Soutte à large échelle (profondeur de 20–400 m), basé sur des données AMT de 32 stations (points noirs, qui correspondent aux marques rouges de la Fig. 2) : celui-ci permet de distinguer des domaines de faibles et fortes résistivités imageant, d’une part, des zones d’altération et/ou fracturation (zones 1 et 2) à forte porosité et fort contenu en eau (saturé ou proche de la saturation) et, d’autre part, l’encaissant (zones 3 et 4) à faible porosité et faible contenu en eau. Masquer
Modèle de résistivité électrique de La Soutte à large échelle (profondeur de 20–400 m), basé sur des données AMT de 32 stations (points noirs, qui correspondent aux marques rouges de la Fig. 2) : celui-ci permet de distinguer des domaines de ... Lire la suite

Comparison of electrical sections based upon AMT and DC data: (a): typical plot of the apparent resistivity versus frequency or array length; the AMT apparent resistivity is defined as the resistivity of a homogeneous ground that would produce similar EM coupling as the one observed at a given frequency; the DC apparent resistivity is defined for a homogeneous ground producing similar data and depends on the dipole length and positions (in the Wenner-α array it depends only on the length of the injection dipole AB). Investigation depth decreases with frequency (AMT) or increases with array length (DC); (b): pseudo-sections along the profile B4–H4, with frequency in the vertical axis (bottom: AMT, and top: DC); with different resolution and investigation depths, DC and AMT pseudo-sections are complementary, and there is a superposition at intermediate frequencies in the range of 104–105 Hz, both showing decreasing resistivity to the ENE. Masquer
Comparison of electrical sections based upon AMT and DC data: (a): typical plot of the apparent resistivity versus frequency or array length; the AMT apparent resistivity is defined as the resistivity of a homogeneous ground that would produce similar EM ... Lire la suite
Comparaison de sections électriques basées sur des données AMT et DC : (a) : graphe typique de résistivité apparente en fonction de la fréquence ou de la longueur du dispositif ; la résistivité apparente est définie comme la résistivité d’un milieu homogène qui produirait un couplage EM similaire à celui observé à une fréquence donnée ; la résistivité apparente DC est définie comme la résistivité d’un milieu homogène qui produirait des données similaires et dépend de la longueur du dipôle utilisé et de ses positions (dans la configuration Wenner-α, ceci ne dépend que de la longueur du dipôle d’injection AB). La profondeur d’investigation décroît avec la fréquence (AMT) ou croît avec la longueur des configurations (DC) ; (b) : pseudo-sections le long du profil B4–H4, avec les fréquences en ordonnées (bas : AMT, et haut : DC) ; ayant des résolutions et profondeur d’investigation différentes, les pseudo-sections DC et AMT sont complémentaires, et il y a superposition aux fréquences intermédiaires à 104–105 Hz, les deux montrant une décroissance de la résistivité vers l’ENE. Masquer
Comparaison de sections électriques basées sur des données AMT et DC : (a) : graphe typique de résistivité apparente en fonction de la fréquence ou de la longueur du dispositif ; la résistivité apparente est définie comme la résistivité d’un milieu homogène qui ... Lire la suite

Electrical resistivity model of La Soutte at small scale (depth of 2–20 m) based upon DC resistivity measurements along a series of profiles using a Wenner-Schlumberger array: shallow (2 m) and deeper (20 m) horizontal slices, with a zoom near the main source area. For association to images obtained from other methods, we show AMT stations (black dots), and at location of main wells in the area (black stars and circles); the small polygon on the left hand side shows the area of MRS maps (Figs. 7 and 8). Masquer
Electrical resistivity model of La Soutte at small scale (depth of 2–20 m) based upon DC resistivity measurements along a series of profiles using a Wenner-Schlumberger array: shallow (2 m) and deeper (20 m) horizontal slices, with a zoom near the main source ... Lire la suite
Modèle de résistivité électrique de La Soutte à petite échelle (profondeur de 2 à 20 m), basé sur des mesures de résistivité DC le long d’une séries de profils en configuration Wenner-Schlumberger : coupes horizontales superficielle (2 m) et profonde (20 m), avec un zoom à proximité de la zone de la source principale. Pour l’association des images obtenues à partir d’autres méthodes, nous montrons les stations AMT (points noirs), et la position des principaux puits dans la zone (étoiles et cercles noirs) ; le petit polygone sur la gauche montre la surface couverte par la carte MRS (Fig. 7 et 8). Masquer
Modèle de résistivité électrique de La Soutte à petite échelle (profondeur de 2 à 20 m), basé sur des mesures de résistivité DC le long d’une séries de profils en configuration Wenner-Schlumberger : coupes horizontales superficielle (2 m) et profonde (20 m), avec un ... Lire la suite
3.2 Magnetic Resonance Sounding: recharge and shallow water
In our previous experiments with a weathered/fractured basement, we observed that the fractured zone, even when it is the site of important water flow, is characterized by a very low volumetric water content as compared to sedimentary rocks. This is due to a low matrix porosity of less than 1% which is not sufficient to make the MRS sensitive to the water contained in the fractured zone [26].
Nevertheless, MRS can detect the saturated weathered zone because the volumetric water content can reach 5–8%. Considering field conditions (space available, spatial resolution needed for the study, electromagnetic noise level due to urban activities), we used a square 25 m side “eight-shaped” loop, with 2 turns of cable.
Two field surveys were carried out in November 2004 and July 2007. Despite a low level of signal (mean maximum amplitude: 50 nV), the mean S/N (signal to noise ratio) is approximately 2. This is not caused by electromagnetic noise since the noise level is very low, reaching the instrumental noise limit: after stacking, the ratio EN/IN is about 1 (external noise/internal noise). The data quality is illustrated by a sample of sounding (Fig. 6).
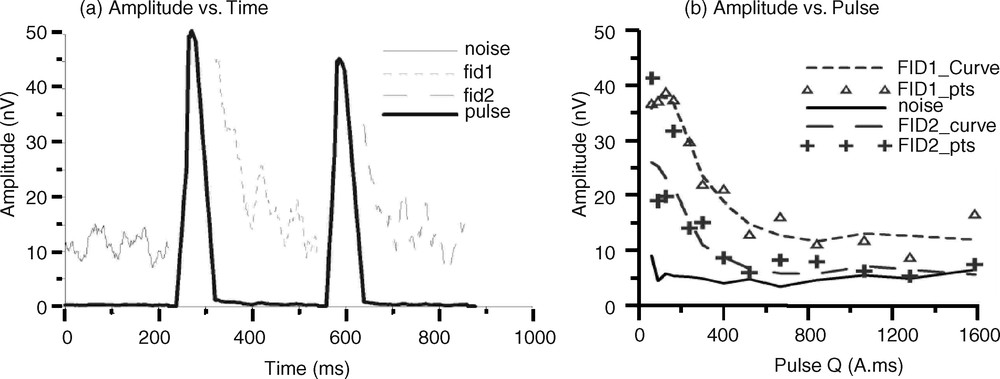
Typical MRS sample sounding curves: (a): plot of the amplitude versus time shows the noise level before any impulse source (continuous line) and two exponential decay curves (dashed lines) following pulses; (b): plot of the amplitude versus pulse for the exponential decay curves (same style of line as in a).
Courbes d’un sondage MRS typique : (a) : graphe de l’amplitude en fonction du temps, qui montre le niveau de bruit précédant la première source impulsionnelle (trait continu) et deux courbes de décroissance exponentielle (trait pointillé) suivant les pulses ; (b) : graphe de l’amplitude en fonction du pulse, avec une décroissance exponentielle (même style de trait qu’en a).
The amplitude of the MRS signal is linked to the water content in the saturated zone (including the water table and capillary fringe), and decay time is linked to the mean pore size [19]. MRS results show shallow water (Fig. 7) coherent with the water level observed in the boreholes: the uncertainty of the MRS top (about 50 cm) is greater than the height of the capillary rise of water in a tube calculated with a porosity of 0.36 (see section 3.3) and mean grain diameter of 0.6 mm [27] (about 15 cm). We call MRS top, one of the estimates resulting from the inversion of the whole set of MRS data with a 1-layer block model simply controlled by 3 parameters: depth to top of saturated layer, thickness and water content of this layer (Fig. 7). Such a model is useful when we lack constraints on the variability in the first meters of weathering [26]. In La Soutte, the map of the MRS top (Fig. 7) can be compared to the DC electrical imaging in the first 20 m (Fig. 3): our interpretation is that the shallowest aquifer is detected by the MRS and lies in weathered rocks with low electrical resistivity (along the line marked by B4–B6) and the deeper aquifer with low water content is not detected by MRS and lies in fractured volcanic rocks (along the line marked by C3–C5).
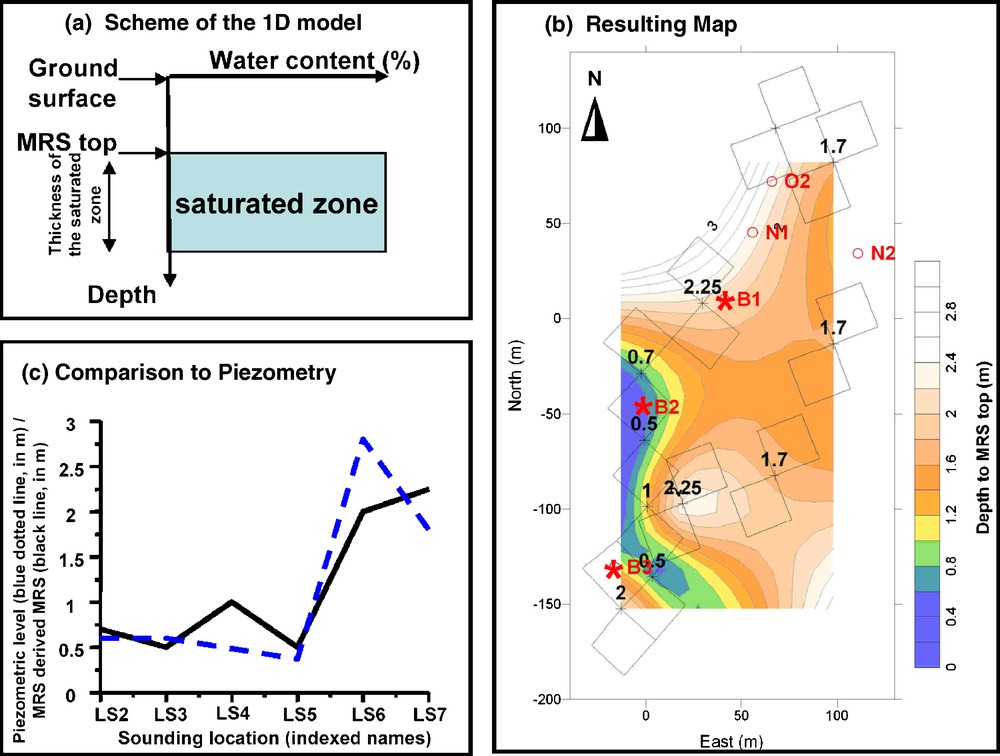
MRS at La Soutte: for the inversion of each MRS sounding (Fig. 6), we consider the 1D block model with a single layer of constant water content for the saturated zone (a); it gives the possibility to constrain 3 parameters, the water content, the depth to the top and the thickness of the saturated zone. Results for the MRS top obtained from the interpretation of 10 soundings of La Soutte have been interpolated to provide a map (b) that can be used as an estimate of the piezometric depth since it is in good agreement with nearby piezometric depths measured in wells (c); it shows a very shallow water level, and actual sources are located near MRS locations with a depth of 0.5 m to top of blocks. Black symbols (stars with labels P1, P2, P3, and the circle) mark piezometer locations. Masquer
MRS at La Soutte: for the inversion of each MRS sounding (Fig. 6), we consider the 1D block model with a single layer of constant water content for the saturated zone (a); it gives the possibility to constrain 3 ... Lire la suite
MRS à La Soutte : pour l’inversion de chaque sondage MRS (Fig. 6), nous considérons un modèle de bloc 1D composé d’une seule couche dont le contenu en eau est constant dans la zone saturée (a) ; ceci donne la possibilité de contraindre 3 paramètres, la teneur en eau, la profondeur du toit et l’épaisseur de la zone saturée. Les résultats obtenus pour le toit MRS issu de l’interprétation de 10 sondages à La Soutte ont été interpolés pour fournir une carte (b) qui peut être utilisée comme une estimation de la profondeur piézométrique, puisqu’elle est en accord avec des mesures piézométriques dans des puits voisins (c) ; ceci montre un niveau d’eau très superficiel, et il y a des sources réelles à proximité de sondages dont le toit MRS est à 0,5 m. Les symboles noirs (étoiles labellisées P1, P2, P3, et les cercles) montrent la position des piézomètres. Masquer
MRS à La Soutte : pour l’inversion de chaque sondage MRS (Fig. 6), nous considérons un modèle de bloc 1D composé d’une seule couche dont le contenu en eau est constant dans la zone saturée (a) ; ceci donne la possibilité ... Lire la suite
Mapping MRS thickness shows locations of saturated altered rocks (Fig. 8). An additional indicator is the total amount of water per surface unit (m3/m2) mixing the thickness and water content. This integral parameter is known to be better constrained than the MRS thickness or MRS porosity [25,26]; it clearly maps the area of resurgences in La Soutte. It is noteworthy that significant water content is observed by MRS above 10 m, i.e. in the shallowest part of the weathered zone; this is coherent with the most conductive zone shown on the 2 m horizontal slice of the DC electric resistivity model (see Figs. 3 and 7). No large aquifer is observed in the next 30 m; this is coherent with the upper resistive part (zone 3) shown on the 3D block of the AMT electric resistivity model (dark green and blue patches in Fig. 2). The next conductive zone which may characterize another weathered layer is observed at depths around 100 m, deeper than the penetration of MRS soundings.
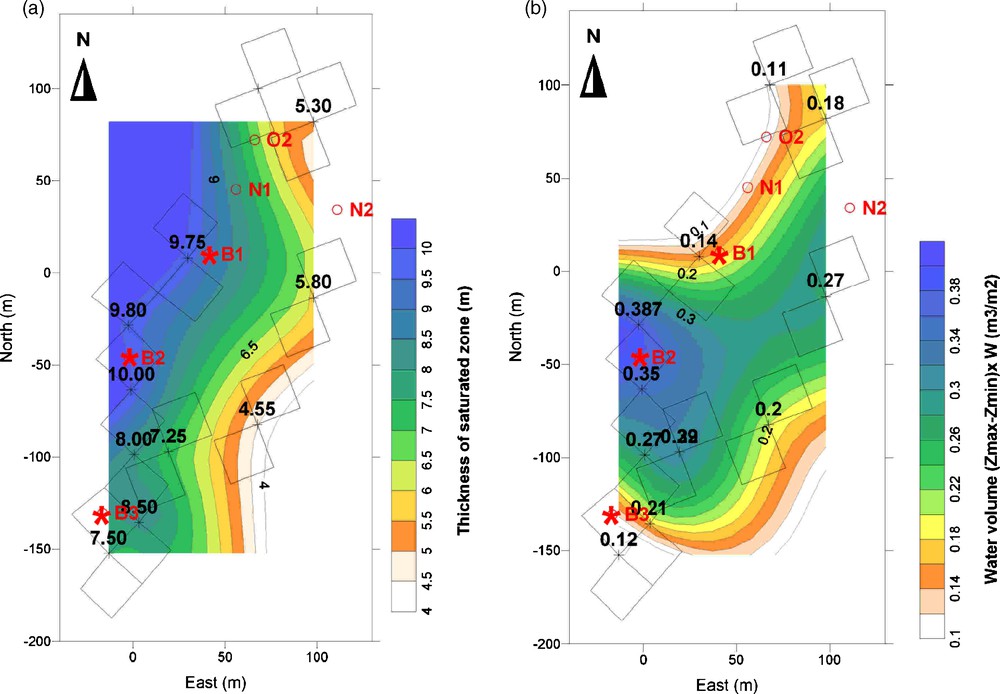
Other MRS images of La Soutte: using the simple 1D block model inversion for the saturated zone (Fig. 6), we also obtained the thickness of the saturated zone (a) and the total water volume by unit surface (b). Mapping MRS thickness highlights locations of saturated altered rocks. Also, the total water volume by unit surface clearly maps the area of resurgence. Red symbols (stars with labels P1, P2, P3, and the circle) mark piezometer locations. Black rectangles show MRS loop locations. Note that the interpolated map for the thickness and the top of the saturated zone avoids uncertain values estimated by MRS soundings located on top of very low water content (e.g. at the north end, with estimated water volume per surface area of 0.11 m3/m2). Masquer
Other MRS images of La Soutte: using the simple 1D block model inversion for the saturated zone (Fig. 6), we also obtained the thickness of the saturated zone (a) and the total water volume by unit surface (b). Mapping ... Lire la suite
Autres images MRS de La Soutte : à partir du simple modèle de bloc 1D d’inversion pour la caractérisation de la zone saturée (Fig. 6), nous avons aussi obtenu l’épaisseur de la zone saturée (a) et le volume total d’eau par unité de surface (b). La cartographie de l’épaisseur MRS met en lumière les positions des roches saturées altérées. De plus, le volume d’eau par unité de surface cartographie clairement les zones de résurgence. Les symboles rouges (étoiles labellisées P1, P2, P3, et les cercles) donnent les positions des piézomètres. Les rectangles noirs montrent la position des boucles MRS. On précise que les cartes interpolées des valeurs d’épaisseur et du toit de la zone saturée ne tiennent pas compte des sondages MRS imprécis, positionnés au-dessus d’endroits à très faible contenu en eau (ex. à l’extrémité nord, dont l’estimation du volume d’eau par unité de surface est de 0,11 m3/m2). Masquer
Autres images MRS de La Soutte : à partir du simple modèle de bloc 1D d’inversion pour la caractérisation de la zone saturée (Fig. 6), nous avons aussi obtenu l’épaisseur de la zone saturée (a) et le volume total d’eau ... Lire la suite
3.3 GPR: vadose zone water content
The electrical imaging and MRS methods discussed above mainly characterize the underground at depth greater than a few meters. Since the depth of the vadose zone in La Soutte is between 0 and 3 m (the depth of the shallowest aquifer is between 0 and 3 m), the previous methods do not provide an appropriate vertical resolution. However, the electromagnetic techniques, especially at high frequencies in the 50–750 MHz band used in Ground Penetrating Radar (GPR) can provide a better resolution. At these frequencies, electromagnetic fields are propagating waves at a velocity v = c/√ɛr (in m/ns) where c is the speed of light in free space and ɛr is the relative permittivity (dimensionless) of the material; the resolution is in relation to the wavelength or bandwidth of the wavelet [23], typically 1/4 to 1/2 of the wavelength (between 25 and 50 cm at 100 MHz and for a velocity of 0.1 m/ns). Because of the huge difference of permittivity between air (ɛr = 1) or minerals (ɛr = 3–6) and water (ɛr = 81 at 100 MHz), the GPR velocity is highly dependent on the water content [17,27,39].
For conciseness, let us consider GPR data at only three locations near the top of the site, at altitudes greater or nearly equal to that of the main source (950 ± 5 m). Based upon piezometric measurements, but also on MRS soundings (Fig. 7), it is expected that the shallowest layer is unsaturated at P1 and P3, but fully saturated at P2. At the latter point we observe water on the ground surface. The GPR velocity of this upper layer was estimated using the common midpoint (CMP) data obtained with 100 MHz GPR antennas. Fig. 9 shows normalized amplitudes (a constant gain was applied) of the GPR waves as a function of offset (distance between the source and receiver) and time delay (after arrival of the direct wave travelling at the speed of light in the air). The blue lines in the middle plot (located at piezometer P2) show the ground direct wave (straight line) and two reflected waves (hyperbolic events with v1 = 0.055 m/ns and v2 = 0.08 m/ns, respectively). The slope of the direct wave is the slowness in the ground that provides the velocity v1 = 0.055 m/ns (inverse of the slowness); the first reflected wave provides the same velocity and also a time delay that corresponds to its depth; the second reflection provides a greater apparent velocity of v2 = 0.08 m/ns, showing that the second layer has lower water content. At the two other locations P1 and P3, the ground direct wave provides the velocities v1 = 0.060 m/ns and v1 = 0.065 m/ns, respectively; compared to the first layer at P2, they show lower water content. Quantitatively, let us use the Topp model [39]; we get the following estimates for water content in the first layer: θ = 0.33, θ = 0.36 and θ = 0.30, at P1, P2, and P3, respectively. Since the ground is nearly saturated at P2 (S = 1), the water content is equal to the porosity ϕ = θS = 0.36 (θ = ϕS). This porosity is an effective porosity that corresponds to an average GPR velocity estimated from CMPs with maximum offset of 8 m: thus the horizontal resolution is a few meters. We consider that this porosity is constant in the top soil, and we deduce the saturation S at P1 and P3: 0.92 and 0.83 respectively.
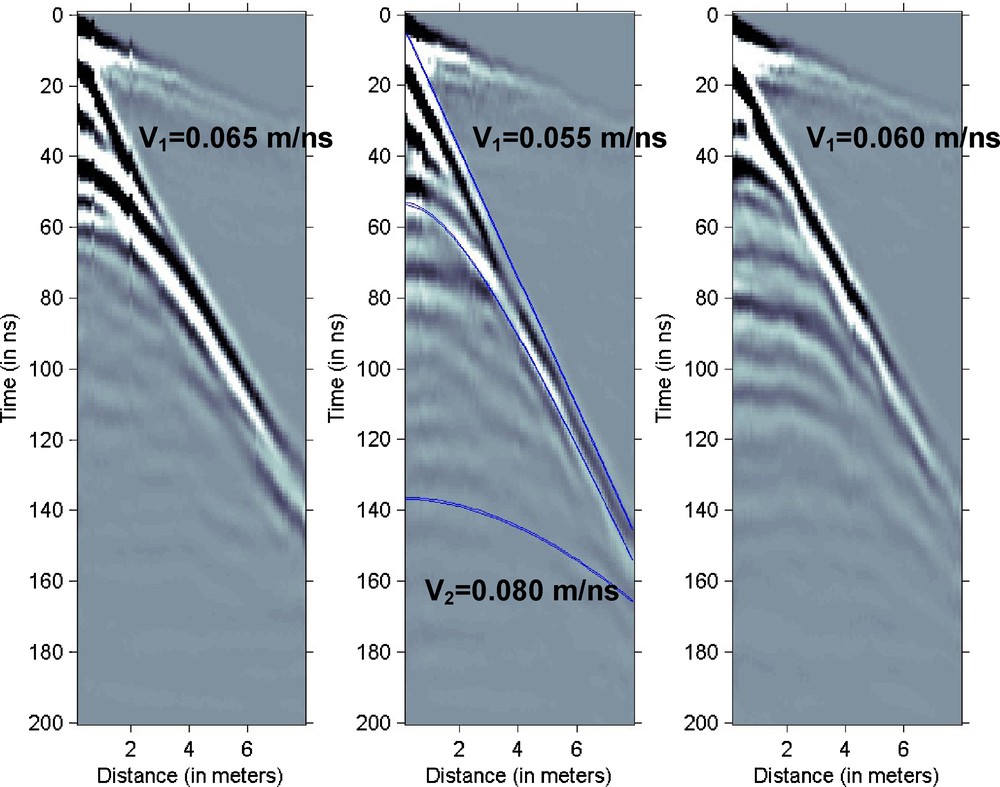
GPR images of La Soutte at 100 MHz: common mid-point (CMP) near the three piezometers previously illustrated as red stars, showing normalized amplitudes of the radar waves as a function of offset distance (between source and receiver) and time delay (after arrival of the direct wave travelling at speed of light in the air). Blue lines in the middle plot (located at piezometer P2) show the picking of the ground direct wave (v1 = 0.055 m/ns) and two reflected waves (v1 = 0.055 m/ns and v2 = 0.08 m/ns). By comparing several plots corresponding to different locations, one notices that the direct wave has different slope values (or slowness) showing velocity variations in the range of 0.055 m/ns to 0.065 m/ns; this characterizes lateral changes of the water content in the top layer (average velocity within a typical thickness of 30 cm). Masquer
GPR images of La Soutte at 100 MHz: common mid-point (CMP) near the three piezometers previously illustrated as red stars, showing normalized amplitudes of the radar waves as a function of offset distance (between source and receiver) and time delay (after ... Lire la suite
Images GPR de La Soutte à 100 MHz : configuration point commun multiple (CMP) à proximité des trois piézomètres précédemment illustrés par des étoiles rouges, montrant des amplitudes normalisées de l’onde radar en fonction de la distance d’« offset » (entre la source et le récepteur) et le délai temporel (après l’arrivée de l’onde directe voyageant dans l’air à la vitesse de la lumière). Les lignes bleues au milieu du graphe (piézomètre P2) montrent le pointé de l’onde directe dans le sol (v1 = 0,055 m/ns) et deux ondes réfléchies (v1 = 0,055 m/ns et v2 = 0,08 m/ns). En comparant plusieurs graphes correspondant à différentes positions, on notera que l’onde directe a différentes valeurs de pente (ou lenteur) montrant des variations de vitesse entre 0,055 m/ns et 0,065 m/ns ; ceci caractérise les variations latérales du contenu en eau dans la couche superficielle (vitesse moyenne sur une épaisseur typique de 30 cm). Masquer
Images GPR de La Soutte à 100 MHz : configuration point commun multiple (CMP) à proximité des trois piézomètres précédemment illustrés par des étoiles rouges, montrant des amplitudes normalisées de l’onde radar en fonction de la distance d’« offset » (entre la source et ... Lire la suite
Note that soil water content estimates based upon measurements of the dielectric constant are classically made using capacitive or time domain reflectivity probes that provide more local values (horizontal resolution of a few centimetres or less). In case of mapping with this kind of probes in the field, the maximum sampling interval has to be tens of centimetres; the larger horizontal resolution of estimates based upon GPR CMPs (with offsets from 0.5 to 8 m) would simplify upscaling and allow mapping over a regular grid with larger sampling intervals (e.g. several metres). A precise statistical and scaling analysis has not been made yet at La Soutte and will be the subject of future papers. Here we just mention that a preliminary study has been done using a ThetaProbe ML2x (manufactured by Delta-T Devices Ltd., UK); it is a local probe whose geometry is similar to that of a TDR but working with a sinusoidal source at 100 MHz: measurements in the neighbourhood of P1, P2, and P3, gave values in the same range as GPR-based water content estimates.
4 Conclusion and perspectives
The experimental site of La Soutte presents a real case hydrogeology in a catchment area with complex geology showing contrasting volcanic rocks with different degrees of fracture and weathering. It is mainly dedicated to testing noninvasive methods in real case conditions.
To infer hydrogeology of the underground at La Soutte, we have considered different noninvasive methods essentially sensitive to the water content, and with different penetration depths and resolutions. Let us resume these as follows:
- • AMT at La Soutte provides information at the larger scale (10–200 m); it makes it possible to delineate zones of electrical resistivity below 1000 Ω m correlated with weathered/fractured areas of high porosity and high water content at shallow depth (shallow aquifer). It also suggests another possible reservoir at greater depth, in the range of 90–100 m;
- • DC resistivity and MRS provide information at the intermediate scale (0.5–20 m), resolving the limits of the shallow aquifer, especially in the north–south direction, perpendicular to the main topography. They also allow mapping of the depth to the water table and the water content;
- • GPR provides information at the smaller scale (0.1–3 m); it may help to delimit in detail the shallow aquifer. Using the ground direct wave velocity in CMP, it allows mapping of the water content of the vadose zone.
All together, these hydrogeophysical methods provide a multiscale approach to the water content that can be similarly used in other catchment areas. Future work on La Soutte concerns interpretations where the model parameter is the water content and the data to be considered depend on the scales: joint inversion of DC and GPR data at scales in the range of 0.5–3 m, joint inversion of DC and MRS data at scales in the range of 0.5–20 m. We expect that this would result in a more accurate mapping of the water content than the ones obtained by estimation using Archie's or Topp's formulas alone.
Other methods are also under development at La Soutte and will be discussed in future papers; these concern the broadband of hydrogeophysical methods, including thermal properties, magnetics, electrokinetics, seismics, and their use in water flow modelling.
Acknowledgements
This study benefited from financial support from INSU-CNRS ECCO-PNRH “WATERSCAN” and Région Alsace “REALISE” programs. Mickael Behaegel wishes to acknowledge financial support from a joint CNRS–Région Alsace doctoral fellowship. José Ortega-Ramírez wishes to acknowledge financial support from Strasbourg University for his visiting position at EOST. The authors also thank all colleagues and students who contributed to field work and instrumentation at La Soutte. The test site is courteously lent to EOST and Université de Strasbourg by Syndicat Forestier d’Obernai-Bernardswiller and Office National des Forêts. The authors would like to thank one anonymous reviewer and Michel Chouteau, as well as Editor Roger Guérin, whose comments helped to greatly improve this manuscript.