

1 Introduction
In the absence of run-off, the water balance on the land's surface is comprised of rainfall, real evapotranspiration (RET) and infiltration. Although rainfall can be measured directly, the direct determination of RET is impossible due to the adaptability of the vegetation cover. Only its upper bound can be restricted by the potential evapotranspiration (PET). It is very important to determine the level of infiltration, and, better still, net infiltration [10] that corresponds to the net gain in underground water [1,6] and will be equated to the recharge in the present study. However, the choice of spatial and time scales, as well as that of the measurement technique, can pose serious problems. Water, which penetrates into the first centimetres, or even metres, of the ground may be taken up by plant roots, without contributing to any increase in the underground storage. Although piezometer measurements indicate the water table depth, they do not provide any information concerning the amount of water stored in the unsaturated zone.
A rather large panel of geophysical methods can be used to assess the amount of water stored in the ground. Some of them, such as the gravity method, have a strongly integral (damped) effect [7,13], whereas others are more locally sensitive [5]. Even those capable of directly determining the liquid water content (MRS, Magnetic Resonance Sounding) are not sensitive to water seepage. However, at least one method, based on temperature distribution, is sensitive to the water flow rate, i.e. Darcy's velocity, and can be used to determine it by a very simple principle: a certain quantity of convective heat transfer can be associated with a measured volume of fluid seepage, such that analysis of the temperature distribution (temporal variations at different depths) can be used to evaluate the flow rate. This principle is well understood and has been applied for several decades [11,12,14,15].
The theoretical temperature variation with depth in a layered 1D ground from which water is exiting by vertical seepage has already been described [3]. Its behaviour is governed by the following equation:
| (1) |
| (2) |
It is thus possible by fitting a theoretical solution to the experimental frequency variations of the temperature at different depths to determine Γi, υi, the volume water content θ and Darcy's velocity [14]. However, two difficulties, arising from the fact that conduction is the dominant mode of heat transfer, must be overcome:
2 Inversion method from temperature profile to water flux
One must first define where, at which depth, with which sampling step, and when, temperature should be measured. If the sensors are placed beyond the root zone, this option is quite difficult to implement and will prevent the monitoring of rapid variations. Positioning of the sensors within the first metre is more straightforward; it allows both short time and long time variations to be recorded, and when the results are integrated over one or more annual cycles the vegetation uptake is cancelled.
Ground temperature measurements are recorded by meteorological stations at several depths, and over periods of several decades. It thus makes sense to consider the relevance of these data, even if more sensitive and more closely spaced measurements need to be made later. We thus chose to make initial recharge determinations over the entire hydrographic basin of the Seine River, using the data collected by meteorological stations.
There are 15 stations which have similar measuring conditions: they are situated on a horizontal surface (absence of run-off), have a grassy cover, provide daily samples taken at depths of 0.1, 0.2, 0.5 and 1 m, and have a temperature sensitivity of 0.1 K, resulting from the Least Significant Bit (LSB), the sensor noise being lower. The 0.1 m data were not used, to avoid spectral aliasing. In order to compensate for the lack of sensitivity and the limited quantity of data, we analysed records dating back 18 years, from all 15 stations. The temperature records and the correspondent sine annual variation are presented in Fig. 1 for the [1999–2001] period at Vélizy-Villacoublay (Yvelines, France).
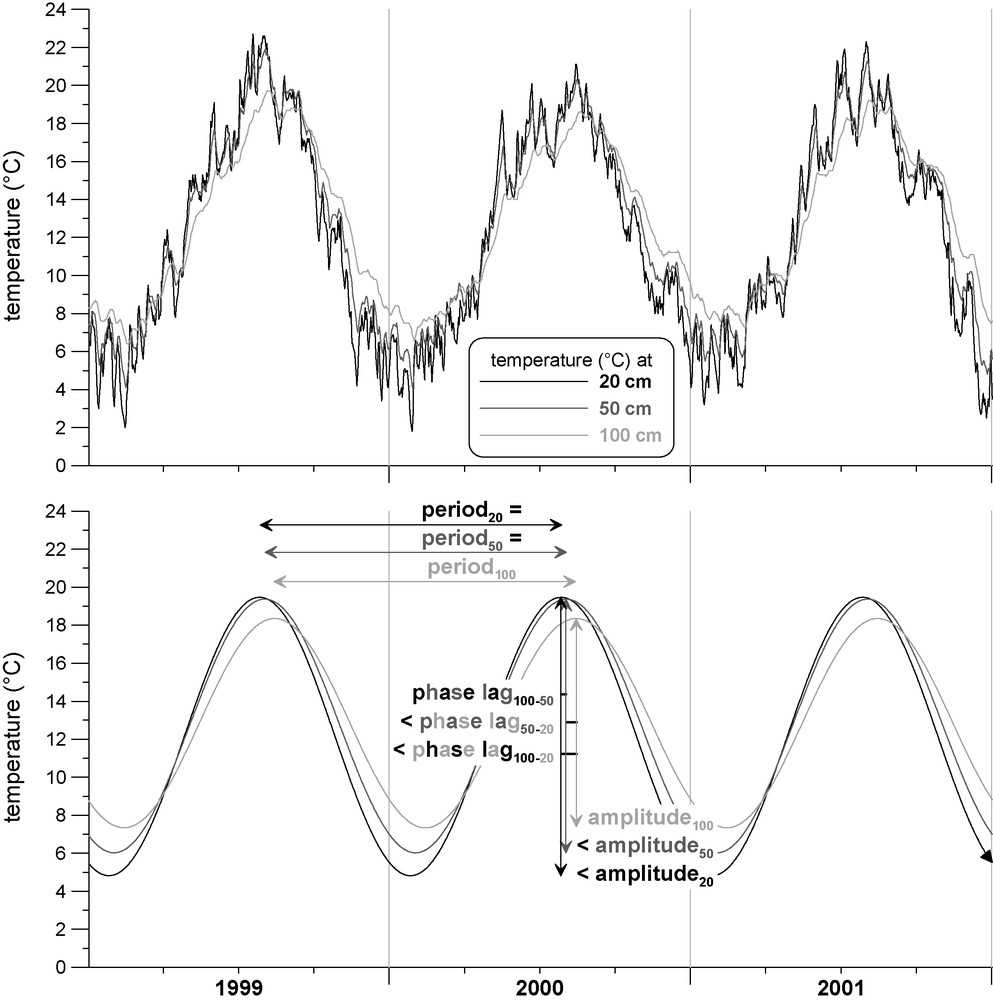
Temperature record at 0.2, 0.5 and 1 m, Vélizy-Villacoublay station (Yvelines, France) for the [1999–2001] period and corresponding sine annual variations.
Température à 0,2, 0,5 et 1 m, station de Vélizy-Villacoublay (Yvelines, France) pour la période [1999–2001] et variations sinusoïdales correspondantes.
At each station, electrical soundings were made [3] at the exact location of the temperature sensors, in order to identify the vertical position of the ground structure interfaces (Table 1 shows the interpretation of the electrical sounding at the Vélizy-Villacoublay station). The results were then interpreted using a three-layer model, which has a sufficient number of interfaces to fit any variation of the soil properties as a function of depth. The thermal properties of each of the three layers depend on several parameters: time, volume water content, θ, and time–independent variables i.e. porosity, n, and thermal conductivity of the solid fraction, ksi. To simplify the model, we assumed the porosity to be uniform and equal to 0.45, and assumed the volume water content to be independent of depth (because long periods are considered). Consequently, only the solid fraction conductivity varies with depth, and thermal properties can be determined using the following equations [4]:
| (3) |
| (4) |
Structure du terrain, station de Vélizy-Villacoublay (Yvelines, France).
| Resistivity (Ω m) | Thickness (m) | Thermal conductivity of the solid fraction ks (W K−1 m−1) | Thermal conductivity k (W K−1 m−1) | |
| 1st layer | 260 | 0.22 | 2.38 | 1.28 |
| 2nd layer | 73 | 0.49 | 3.27 | 1.63 |
| Substratum | 16 | 2.07 | 1.16 |
In order to determine the four unknowns ks1, ks2, ks3 and θ, one proceeds in two steps:
- 1) The full set of recordings is divided into N equal periods: in the present case, the 18 years recording was divided into six three-year periods. For each period and for each depth, a least squares regression was used to fit a sinusoidal function to the data, using the expression:
where ω is the angular frequency corresponding to the annual cycle, and A, B and D depend on the considered depth.(5) - 2) For each pair of depths, (0.2, 0.5) and (0.5, 1.0), the values of B and D are used to calculate two apparent thermal diffusivities: Γph is derived from the phase lag, and Γamp is derived from the amplitude ratio [3,14]. The apparent diffusivities are defined as the diffusivities of a homogeneous stretch of ground which, for the same pairs of depths, would lead to the same values of phase lag and amplitude ratio: if one has B1 and D1 at depth z1 and B2 and D2 at depth z2, one would have:
and(6) (7)
In the absence of seepage in homogeneous ground, these quantities are equal. As Γph is practically independent of seepage, its values are used to determine the thermal properties of the layers, from two independent pairs of depths and N periods. This leads to 2N relationships that need to be solved for four unknowns.
Once the thermal properties have been determined, a period is chosen for which the value of u is needed. The two values of Γamp corresponding to this period are then computed, and used to calculate the best fit for the value of u.
3 Groundwater recharge interpretation of Seine catchment
From this data, we first determined Darcy's velocity, which is equivalent to the recharge, for the whole period. The numerical results are presented in Table 2 together with rainfall, potential evapotranspiration, potential excess precipitation (P-PET), and real excess precipitation (P-RET) calculated monthly using Thornthwaite's simplified algorithm [8,16] and then averaged over the 18 years. The potential excess precipitation constitutes a lower bound for the recharge and the real excess precipitation normally constitutes an upper bound (it takes into account the run-off). However, the determination of this second term is very sensitive to the time interval over which it is calculated: for long intervals (in the present case the month) it is underestimated. We then considered, Table 3, the recharge differences, for the [1996–1998] and [1999–2001] three-year periods, which correspond to periods during which the average rainfall increased significantly.
Pluie, ETP, pluie-ETP, pluie-ETR calculée par l’algorithme de Thornwaite et recharge sur la période [1984–2001]. Le X correspond à une absence de données.
| Station | Rainfall | PET | P-PET | P-RET (Thornthwaite) | Recharge |
| Abbeville | 794.0 | 684.5 | 109.5 | 245.1 | 151.3 |
| Auxerre | 723.1 | 767.6 | −44.5 | 160.9 | 163.4 |
| Beauvais | 695.3 | 733.6 | −38.4 | 166.6 | 225.2 |
| Bonneuil (Le Bourget) | 646.3 | 771.1 | −124.8 | 108.4 | 52.0 |
| Boos (Rouen) | 857.1 | 696.3 | 160.8 | 281.3 | X |
| Brétigny | 629.3 | 633.7 | −4.4 | 301.8 | 36.3 |
| Bricy (Orléans) | 637.5 | 802.2 | −164.7 | 119.3 | −32.5 |
| Chartres | 599.4 | 730.3 | −130.9 | 104.3 | 36.9 |
| Courcy (Reims) | 635.8 | 725.9 | −90.2 | 105.3 | 197.7 |
| Fontaine (St Quentin) | 707.2 | 697.0 | 10.2 | 171.0 | 142.2 |
| Huest (Evreux) | 607.8 | 722.4 | −114.6 | 106.5 | 179.0 |
| Nevers | 787.0 | 725.4 | 61.7 | 218.5 | −46.8 |
| Paris-Montsouris | 656.5 | 794.0 | −137.5 | 100.2 | 103.3 |
| Troyes | 648.6 | 743.6 | −95.0 | 124.2 | 193.0 |
| Vélizy-Villlacoublay | 694.4 | 782.5 | −88.1 | 143.7 | 16.0 |
Augmentation en millimètre par an entre [1996–1998] et [1999–2001] de la pluie, de l’évapotranspiration potentielle, et de la recharge. Les X correspondent à une absence de convergence du processus d’inversion.
| Increase between the [1996–1998] and [1999–2001] periods | |||
| Station | Rainfall intensity | PET | Recharge |
| Abbeville | 348.0 | 3.8 | 188 |
| Auxerre | 179.6 | −24.3 | X |
| Beauvais | 289.2 | −3.1 | 223 |
| Bonneuil (Le Bourget) | 277.3 | −12.2 | 339 |
| Boos (Rouen) | 284.4 | −3.3 | 117 |
| Brétigny | 211.5 | −40.9 | X |
| Bricy (Orléans) | 282.5 | −27.6 | X |
| Chartres | 209.3 | 6.6 | X |
| Courcy (Reims) | 162.7 | 30.4 | 160 |
| Fontaine (St Quentin) | 196.0 | 25.6 | 330 |
| Huest (Evreux) | 221.7 | −3.5 | 377 |
| Nevers | 117.9 | −6.7 | 318 |
| Paris-Montsouris | 231.4 | −0.7 | X |
| Troyes | 207.0 | 3.9 | X |
| Vélizy-Villlacoublay | 277.7 | −33.9 | 310 |
The recharge map is shown in Fig. 2. The values are interpolated by kriging using a spherical variogram model. The rainfall was the highest towards the north-west (near the sea) and the south-east (higher altitude), with an average value of 691 mm yr−1 over the catchment. The recharge variations are higher in the north than in the south, with an average value of 94 mm yr−1 and a standard deviation around 10 mm yr−1 as established in [3] for each station. These values are not far from the simple means of 101 for recharge and 676 mm yr−1 for rain and can be compared to Thiessen's polygons surface weighted results (presented in Fig. 3), which, respectively, deliver 111 and 676 mm yr−1. One must also note that the application of Thiessen's polygons to the Thornthwaite's excess (P-RET) leads to 112 mm yr−1 for the basin.

Map of the average recharge for the [1984–2001] period.
Carte de la recharge entre 1984 et 2001.
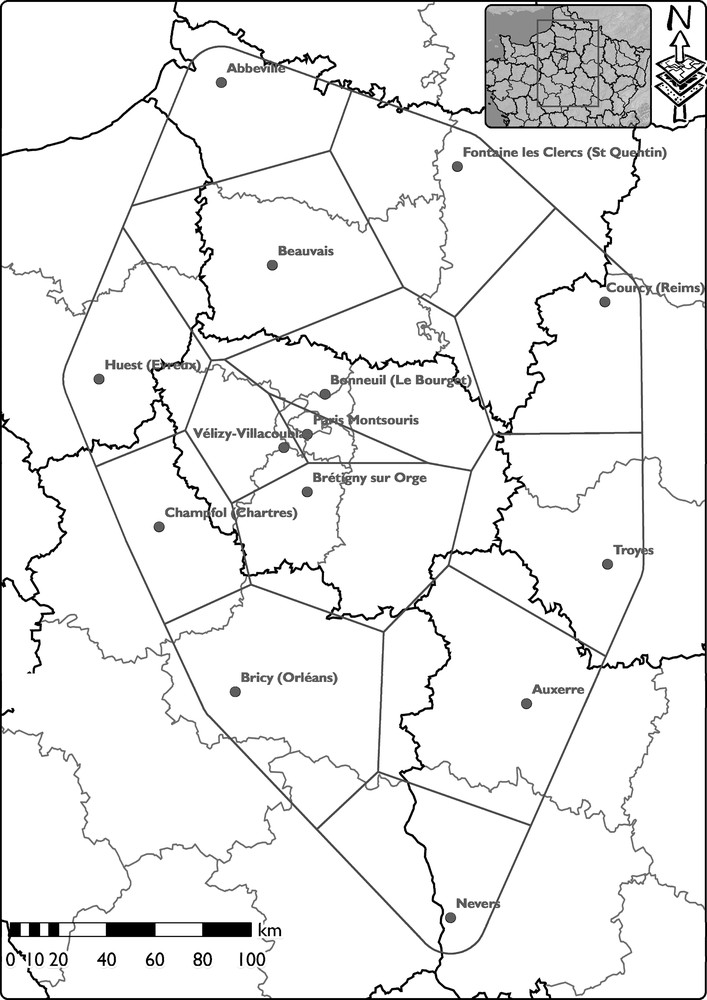
Influence of each station determined by Thiessen's polygons areas.
Aire d’influence de chaque station, déterminée par la méthode des polygones de Thiessen.
Although such a recharge value is plausible, it merits comparison with other sources of data. The river flow rate at the mouth of the Seine (Caudebec en Caux gauge station) is 586.6 m3 s−1, which corresponds to 252 mm yr−1 for an upstream catchment area of 73 300 km2. The difference between these two recharge rates is significant (by a factor of 2.7), but could be attributed to run-off that feeds the river. In order to assess the likelihood of this result, one can consider the lowest (summer) water level, which corresponds to a lower bound for the recharge. Although the lowest flow rate at the river mouth is around 200 m3 s−1 [9], corresponding to 86 mm yr−1, this term includes the water delivered to the river by the lakes, which is estimated to represent 40% of the total flow. The lowest bound for the recharge would thus be 52 mm yr−1. It is likely that the average value over the full period of 18 yearly cycles is 1.8 times greater.
The rainfall intensity increased significantly during the [1996–1998] and the [1999–2001] three-year periods, with an average value of 226 mm yr−1. It was even higher in the north-western part of the basin where the Somme River flood occurred during the spring of 2001. The calculation of the difference in recharge can be achieved at only nine of the 15 stations (Table 3). The average difference in recharge rate is 262 mm yr−1, which is slightly higher than that of the rain. Two explanations can be proposed for the significant increase in recharge rate: wetter soils have a greater hydraulic conductivity, and rainy weather leads to a reduction in RET. Between the two three-year periods, the flow at the Seine mouth increased from 453 to 821 m3 s−1, corresponding to an annual difference of 158 mm yr−1, which suggests that underground water storage increased during the second three-year period.
4 Conclusion
The calculation of recharge rates using existing values of ground temperature is difficult to implement, due to the large time intervals in the recorded data at meteorological stations, and to the low sensitivity of the measurements. Nevertheless, by using data recorded over long periods of time, it is possible to obtain plausible results that can be combined with other types of hydrological data to characterise the long-term water balance.
The possibilities offered by modern technology, to significantly enhance both the time step (a quarter of an hour can easily be achieved) and the sensitivity (0.001 K is possible) of recordings open up very wide perspectives for the assessment of infiltration and recharge rates, over a large range of spatial and temporal scales.
Acknowledgements
The work presented here would not have been possible without the kind cooperation of the French ‘Météorologie nationale’, who provided the authors with invaluable meteorological data. The authors are also grateful to the ‘Armée de l’Air’ (French National Airforce) for its assistance in facilitating measurements at various stations.
Funding was provided by the ECCO/PNRH programme (year 2001), and by the PIREN-Seine Programme (phase IV).