

1 Introduction
Erosion of clay-shale sediments (e.g. Callovo-Oxfordian black marls), which cover a large area in Southeast France, results in dam fillings all along the Durance River down to the “Etang de Berre” on the Mediterranean Coast. In the high-energy landscapes of this area, slope failures may occur and contribute to the sediment transport from the hillslopes to the rivers [2,3].
The objective of this work is to analyze the hydrological processes on a badland slope characterized by reworked and weathered soil material. The infiltration process has been studied on a slope instrumented with several hydrological devices (soil water content sensors, tensiometers, suction lysimeters and piezometers) and geophysical methods during a large-scale infiltration experiment. A method for characterizing soil moisture distribution and the water flow pattern within the hillslope is proposed by combining several geophysical parameters with the Fuzzy Set theory.
Non-intrusive and indirect geophysical methods (such as seismic refraction and electrical resistivity imaging) are well adapted for analysing the characteristics of clay-shale hillslopes [17,24]. The joint interpretation of acoustic P-wave velocity (Vp), S-wave velocity (Vs) and electrical resistivity (ρ) can reveal hydrological and geomechanical properties. According to previous studies [7,19] a multi-method approach is proposed to deepen the level of information, assuming that:
- • Vp and Vs are more particularly sensitive to the geomechanical characteristics and the fissure density of the soil [8];
- • ρ is strongly dependent on water content of the porous media [23].
Grandjean et al. [12] have studied the correlation between Vp and ρ on the Super-Sauze mudslide, developed in the same lithology. This work showed that a cross-plot Vp-ρ reveals several possible hydro-geomechanical behaviours. These authors noticed the increase of Vp and ρ values in relation to a decrease in fissure density, and an increase of soil water saturation respectively. These results were used to propose a new objective method using the Fuzzy Set theory to combine the different geophysical parameters [13]. This method is applied in this work in order to determine possible water flow pathways, the timing of water infiltration and the pattern of soil water content in the soil.
The experimental hillslope (Fig. 1) is located in the Laval catchment, one of the tributary of the Bouinenc and Bléone rivers, near Draix (Alpes-de-Haute-Provence, France). This catchment has a characteristic badland type morphology with multiple V-shape gullies (Fig. 1a). The Laval catchment is instrumented by Cemagref for monitoring and studying erosion and sediment transport in black marl landscapes since 1984 [25]. The instrumented hillslope corresponds to a shallow slide triggered in December 1999 [7]. The elevation ranges from 850 m to 975 m, for an average slope of around 58%, and a surface of 0.04 km2. The slide has a characteristic morphology associating a main scarp with plane rupture plans and an accumulation zone composed of reworked marls and blocks of heterogeneous sizes. The lithology is made of a heterogeneous clay-rich clastic matrix possibly highly saturated in water during the wet season [1]. This accumulation zone is both a water reservoir which can supply a baseflow to the main channel for some days after intense or prolonged rain events [3], and can strongly contribute to the high sediment yield observed in these catchments [25]. A more quantitative understanding of the hydrological processes observed in these hillslopes is of paramount importance to forecast water discharge and sediment transport in these landscapes [16].
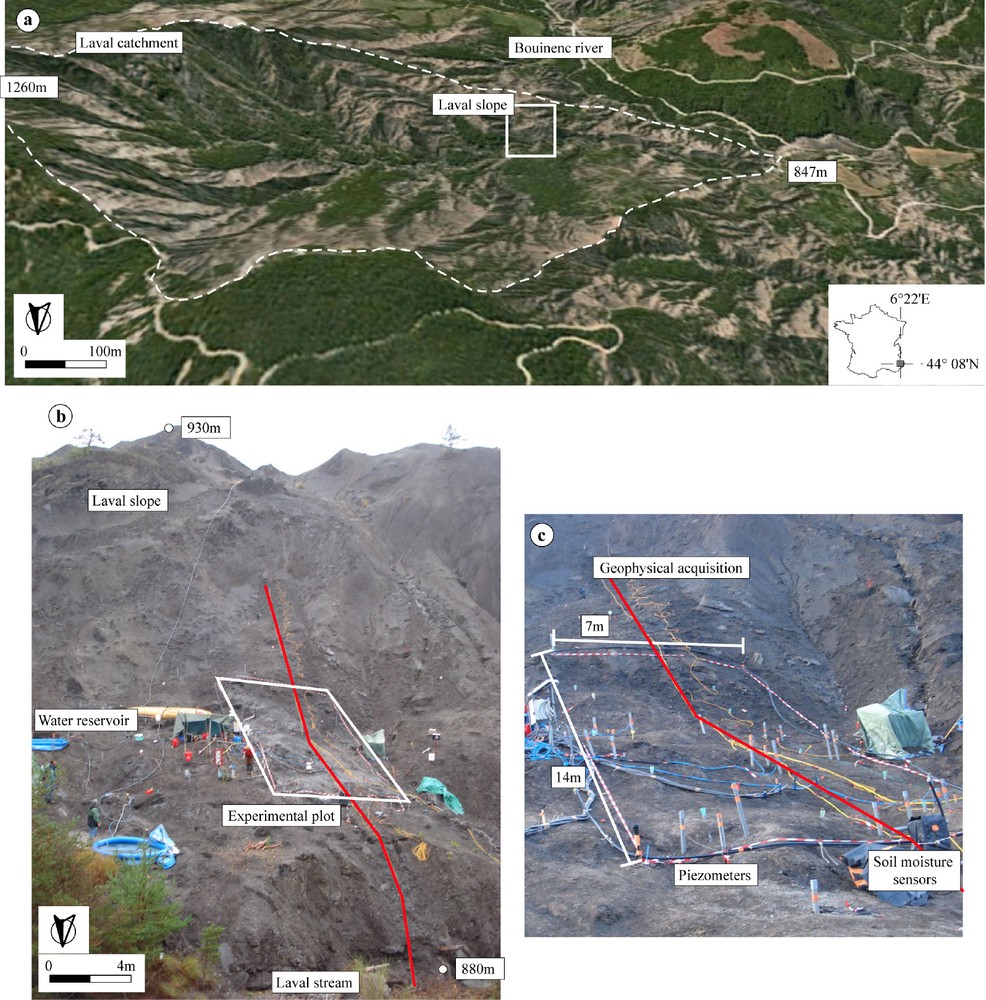
Main geomorphological features of the instrumented hillslope. a: location of the instrumented slope in the Laval catchment at Draix (Alpes-de-Haute-Provence); b: photograph of the Laval slope and location of the experimental plot (the geophysical profile is indicated in red); c: photograph of the experimental plot with the location of the piezometer array and the soil moisture sensors.
Caractéristiques géomorphologiques du versant étudié. a : localisation du versant instrumenté dans le bassin-versant du Laval à Draix (Alpes-de-Haute-Provence) ; b : photographie du versant du Laval et localisation de la parcelle d’infiltration (le profil géophysique est indiqué en rouge) ; c : photographie de la zone d’infiltration et localisation du réseau de piézomètres et de capteurs de teneurs en eau.
2 Geophysical investigations
The geophysical investigations have been carried out using high resolution seismic and electrical instruments spread along a 48 m long profile located in the central part of a rainfall experiment plot of about 100 m2 (7 × 14 m; Fig. 1b; Fig. 1c). Water enriched in bromide and chloride has been used during the experiment. A rainfall amount of 680 mm has been applied during 67 h, corresponding to a rainfall intensity of around 10 mm.h−1. The soil profile was unsaturated at the start of the experiment (t0).
During the rain experiment, geophysical measurements were performed with a time resolution of 3 h, according to Fressard et al. [7]. Then, time series of geophysical tomograms representing 2D-sections of Vp, Vs and ρ values were calculated. The reliability of the inverted parameters was estimated by means of likelihood functions computed from a posteriori errors. The acquisition device, the inversion method and the method to estimate the likelihood functions are described in the following sections.
2.1 Seismic P-wave tomography
The acquisition system involved 48 channels seismic equipment featured by 40 Hz geophones and a handy-hammer source. Seismic shots were fired at each geophone, every meter. Data processing and inversion of the first arrival travel time were undertaken using the JaTS seismic tomography software [9,11]. Inverted Vp along the profile shows a three layer structure varying from 300 to 1800 m.s−1 (Fig. 2a): on top, a low-velocity layer with velocities ranging from 300 to 600 m.s−1, in intermediate position, a thinner layer with velocities ranging from 600 to 1200 m.s−1, and at depth a layer with high velocities, ranging from 1200 to 1800 m.s−1. According to the geotechnical investigation carried out by Fressard et al. [7], the two first layers correspond to the reworked and accumulated material, and the third layer correspond to the marly bedrock [19,20]. In order to focus the interpretation on well-resolved zones of the mudslide, the likelihood LVp, equivalent to a correlation function, has been estimated (Fig. 2b). It corresponds here to the sum of elementary Fresnel weights featuring each source-receiver pair weighted by the normalized RMS value obtained at the final iteration of the inversion process [13]. After processing seismic data for all time steps, no travel-time difference induced by the increasing saturation of the soil was observed on the time-varying tomograms, indicating that seismic wave propagation should not be used alone to monitor water flow in the mudslide.
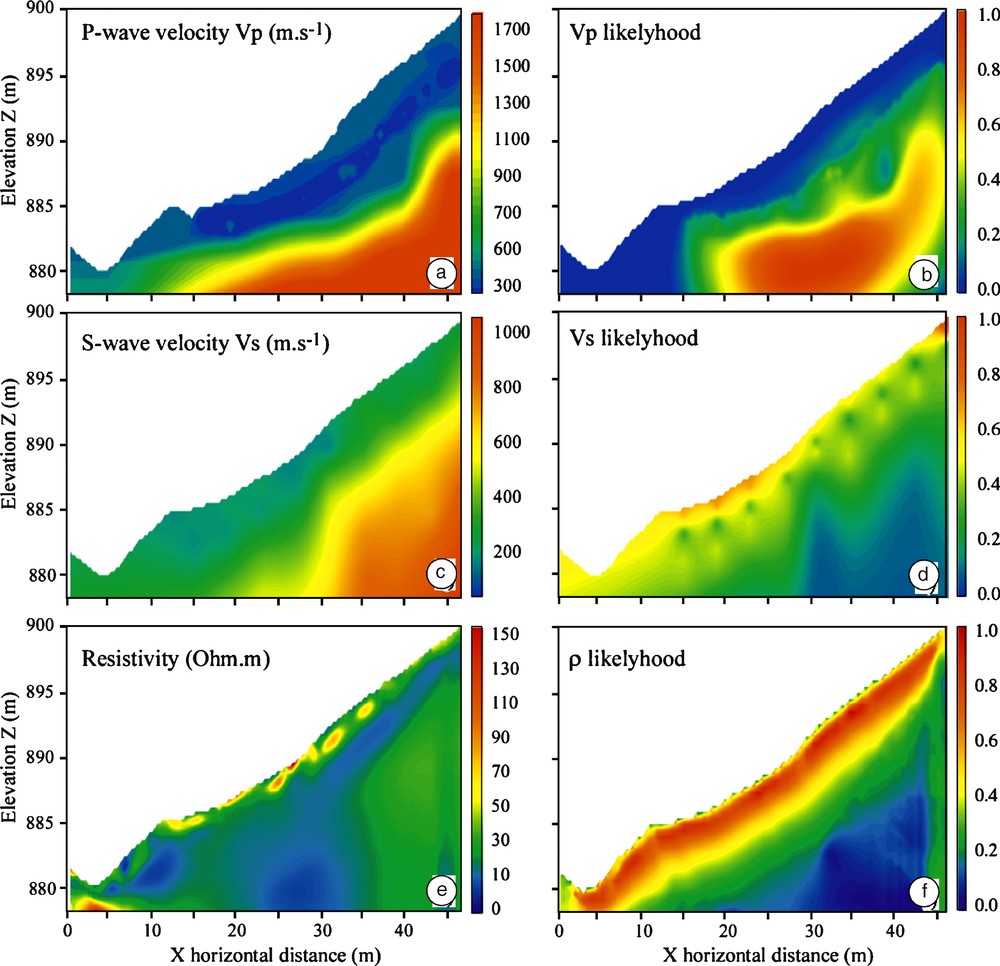
Inverted geophysical tomograms. a: P-waves velocity tomography (Vp) inverted from the seismic first arrivals; b: Vp likelihood function (LVp) indicating the places where the inverted velocities are reliable; c: S-wave velocity tomography (Vs) inverted from SASW; d: Vs likelihood function (LVs) indicating the places where the inverted velocity values are reliable; e: Electrical tomography (ρ) inverted from apparent resistivity values; f: ρ likelihood function (LVρ) indicating the places where the inverted resistivity values are reliable.
Tomogrammes géophysiques inversés. a : tomographie de Vp inversée à partir des premiers temps d’arrivée sismiques ; b : fonction de vraisemblance pour Vp (LVp) indiquant les lieux où l’inversion est contrainte; c: Tomographie de Vs inversée par SASW ; d : fonction de vraisemblance pour Vs (LVs) indiquant les lieux où l’inversion est contrainte ; e : tomographie de ρ inversée à partir des valeurs de résistivité apparente ; f : fonction de vraisemblance ρ (LVρ) indiquant les lieux où l’inversion est contrainte.
2.2 Spectral analysis of surface waves (SASW)
SASW is of increasing interest in the geophysical community [29] because it is a non-invasive method to evaluate soil stiffness with depth in terms of Vs soundings [22]. This method can be easily implemented along linear profiles to obtain two-dimensional Vs sections of shallow layers [21]. Before the inversion step, each seismic record needs to be transformed into a dispersion image from which the frequency-phase velocity curve (e.g. dispersion curve) is estimated. In laterally contrasted media, dispersion images need to be computed in a more local manner with respect to the 1D assumption required by the inversion method proposed by Herrmann [15]. To overcome this problem, the 2M-SASW (Multifold Multichannel SASW) technique [10] has been performed on the same seismic data used previously for the P-waves tomography. S-waves soundings, computed for each local dispersion curve, were finally interpolated along the seismic profile by using kriging algorithms (Fig. 2c). Likelihood values LVs related to inverted Vs soundings were directly estimated from the diagonal values of the correlation matrix defined in the inverse problem [15] and interpolated (as for the Vs soundings) to be represented on 2D sections (Fig. 2d).
2.3 Electrical resistivity tomography
The electrical apparent resistivity profile was performed along the same profile, using a Wenner-Schlumberger array. The profile was also 48 m long, and electrodes were 1 m apart. Data processing and inversion steps were carried out according to Loke [18] by implementing a damped least-squared Gauss-Newton algorithm. The inverted tomograms show a very low resistivity and few contrasted values of resistivity, ranging from 10 Ω.m in the central part of the profile to 150 Ω.m at the surface. Lateral variations are also observed, with a resistivity going from 20 Ω.m to 150 Ω.m in the topsoil (Fig. 2e). The reliability of the resistivity tomogram Lρ has been computed from Loke's software outputs by considering the error ɛ on the inverted resistivity [13]. The image of Fig. 2f allows one to distinguish between high-reliability zones from those poorly constrained; the high reliability is mainly restricted to the superficial part of the tomogram. The comparison of the tomograms observed at different time steps shows nevertheless some changes with time of the electrical resistivity.
2.4 Direct analysis of the geophysical parameters
In order to understand how the geophysical parameters are correlated, an analysis of Vp versus depth and ρ versus Vp has been carried out. For this purpose, data were extracted from the tomograms to compute virtual depth-soundings. Analysis of Fig. 3a and b indicates that:
- • the Vp increases with depth (Fig. 3a), and this increase is probably linked to a decrease of fissure density with depth due to the development of tensile zones in the material [19,20];
- • the more the virtual sounding is close to the upslope part of the experimental plot (e.g. increasing ‘x’ values), the higher the electrical resistivity (Fig. 3b). This observation could indicate that the upslope part of the cross-section is more unsaturated than the downslope part where water may accumulate.

Changes in geophysical parameters. a: P-wave velocity variations with depth for several distances along the profile; b: P-wave velocity versus electrical resistivity for several vertical slices in the tomogram models.
Variations des paramètres géophysiques. a : variation de la vitesse des ondes P en fonction de la profondeur pour différentes distances le long du profil ; b : variation de la vitesse des ondes P en fonction de la résistivité pour différentes distances le long du profil.
In addition, many authors demonstrated that seismic velocities could be linked to soil porosity changes. Wyllie et al. [28] established the so-called time average relationship which is an empirical function defined by 1/V = A + BΦ (with Φ, the porosity; A, B, some constant coefficients depending on lithology and pressure). This relationship is empirical but can be considered as valid when the effective pressure is high and the rock is saturated, as observed in this experiment. The A & B coefficients were not determined for black marls and no differential pressure measurements were taken during the experiment. Nevertheless, Dvorkin et al. [6] showed that a Vs–Vp cross-plot for marly rocks made from well-log data fits correctly experimental cross-plots originally designed for calcite. In addition, Domenico [4] demonstrated that in calcite-rich rocks, the difference (Δ = 1/Vs − 1/Vp) is sensitive to porosity changes: the higher this difference, the more the medium is supposed to be porous. These considerations led us to work with a new quantity defined as the slowness difference of velocities that should represent the variation of porosity within the slope (Fig. 4). Areas with high ΔV values should highlight soil parts wherein the porosity is higher and consequently, portion of the terrain more able to conduct water.

Slowness difference plot (1/Vs − 1/Vp).
Image de la différence des lenteurs sismiques (1/Vs − 1/Vp).
These statements are used hereafter to define hypotheses for the fusion of the geophysical data.
3 Fuzzy theory and proposed modelling strategy
One of the specificity of geophysical data comes from their uncertainty and inaccuracy when they are interpreted for geomorphological and geotechnical applications. Fortunately, different mathematical tools allow considering this specificity by modelling the data in terms of probability, evidence or possibility theories. In the following, probability theory is supposed to be known, and only the basics of the possibility theory are exposed as a new approach to handle the uncertainties related to topic-oriented interpretation. A more complete demonstration on this issue is detailed in Grandjean et al. [13].
The possibility theory has been introduced by Zadeh [30] and fully presented by Dubois and Prade [5] and Zimmermann [31]. The possibility theory considers a reference space S defined in Rn, and a subset X of S defined by a belonging function π (Eq. (1)):
| (1) |
If we attribute to the subset X the realization of a given hypothesis, the belonging function reveals the possibility that this hypothesis is realized depending on the values of x. Furthermore, the fuzzy theory states that intersection and union of two fuzzy sets can be defined by the minimum (min) and maximum (max) of the belonging function π1 and π2:
| (2) |
A possibility distribution is a function π defining the belonging of each element of S to the realisation of the hypothesis: according to Eq. (1) and Eq. (2), π(x) is equal to 1 or 0 depending if the hypothesis is realized or not, respectively. This assumption leads mathematically to Eq. (3):
| (3) |
Another interesting contribution of this approach is the formalism allowing the functions to be combined by the mean of appropriate operators. According to Eq. (2), the combination of two possibility distributions is given by Eq. (4):
| (4) |
where ∧ is the intersection operator.
Coming back to our geophysical dataset, the problem consists in applying fusion theory to increase the amount of information from each geophysical tomogram without overestimating the quality and reliability of the results. Therefore, the datasets, hypotheses and meta-hypotheses are defined as follows:
- • the datasets refer to the seismic velocities and the resistivity tomograms (Fig. 2a, c, e) featured by their likelihood spatial distributions;
- • the hypotheses refer to several interpretations derived from the geophysical data. They are qualitative and define the possibility functions π. For example, if some fissures exist in the slope when the Vp values are lower than the limit VpL, the hypothesis “the soil is fissured” represented by π will be equal to 1 if the Vp value is lower than VpL ;
- • the meta-hypotheses result from a fusion of the elementary hypotheses and define the belonging of each spatial element to different hydrological interpretations.
By comparing field observations and the inverted geophysical tomograms, it is possible to construct hypotheses on the terrain properties by affecting Vp, Vs or ρ values to observed material behaviours. For example, the bedrock identified from geotechnical soundings characterized on the Vp tomogram by the condition Vp > 1500 m.s−1. This was used to identify thresholds values defining the possibility functions expressed by Eq. (1) and represented in Fig. 5:
- • hypothesis h1 defines the possibility π1 that the soil is affected by fissures due to the deformation. The density of fissures is correlated to the variation of Vp observed at the subsurface. Geomorphological observations indicate that the soil may be considered respectively as fissured and not fissured if the Vp is lower than 300 m.s−1 and greater than 1500 m.s−1. The possibility function is assumed to vary linearly between these two values (Fig. 5a);
- • hypothesis h2 defines the possibility π2 of the soil to be saturated with water according to the observed value of electrical resistivity. From in situ soil moisture measurements available in the topsoil, the soil is considered respectively as saturated and unsaturated if the electrical resistivity is lower than 10 Ω.m and greater than 100 Ω.m. The possibility is assumed to vary linearly between these two values (Fig. 5b);
- • hypothesis h3 defines the possibility π3 of the soil to have a relatively higher porosity than the supposed average porosity of the reworked soil. According to the slowness model, the soil should have respectively a relative low porosity and high porosity for slowness differences of 0.00055 s.m−1 and 0.0022 s.m−1. The possibility is assumed to vary linearly between these two values (Fig. 5c).

Belonging functions describing the possibility distributions π1, π2 and π3 corresponding to the three tested hypotheses. a: h1 – “possibility of fissures”; b: h2 – “possibility of water saturation”; c: h3 – “possibility of high soil porosity”.
Fonctions d’appartenance décrivant les lois de possibilité pour les trois hypothèses testées : a : h1 – « possibilité pour le sol d’être fissuré » ; b : h2 – « possibilité pour le sol d’être saturé en eau »; c : h3 – « possibilité de sol à forte porosité ».
The relevance of the strategy, based on the three above-cited hypotheses, is controlled by the definition of the belonging functions [13]. The thresholds in the values defining the belonging functions were checked with field observations when available, petrophysics values and charts otherwise [14,26].
The last information that needs to be integrated concerns the likelihood functions. In our approach, the fusion of a possibility and a likelihood function is expressed by Eq. (5):
| (5) |
where ∨ is the union operator, π (x) refers to the possibility functions defined in (Eq. (3)), L(x) refers to the distribution of the likelihood values computed for each inversion processes, and x is the spatial reference of tomograms. We can note that for likelihood values set to zero, π* drops to a value of 0.5 indicating that this hypothesis has an equi-possibility to be realized in case of no reliable data.
4 Application to the experimental plot on the Laval hillslope
4.1 Interpretation before the start of the rain experiment
The methodology has first been applied to identify the areas within the slope where the soil characteristics may favour infiltration. Two fusion models were computed: the first model combines ρ and Vp; the second model combines Vp, ρ and the slowness differences Δ in order to highlight the possible location of saturated zones. In a first step, hypotheses h1, h2 and h3 were implemented using (Eq. 5). The implementation is defined by (Eq. (6)):
| (6) |
where (x,z) refers to the spatial coordinates of the tomograms. These quantities were then combined by applying (Eq. (4)) in order to define meta-hypotheses H*, e.g. a combination of the elementary hypotheses h1, h2 or h3. These new quantities can be considered as arbitrary but may represent a connection between the quantitative approach of geophysics and the necessity for engineering geologists to obtain an integrated diagnosis. The meta-hypotheses H*1 and H*2 are explained hereafter:
- • Meta-hypothesis H*1 defines the possibility for the soil to be saturated in water (e.g. low resistivity values) and to be highly affected by fissures (e.g. low Vp values). In terms of possibility theory, the meta-hypothesis H*1 may be expressed by a function Π1:
(7) Fig. 6a shows the result when (Eq. (7)) is solved. It indicates a superficial layer with a possibility value comprised between 0.8 and 1.0 overlying soil strata with lower possibility values ranging from 0.4 to 0.6. The shallow layer has a heterogeneous thickness going from 0.1 m at the toe of the slope to ca. 10 m at a distance of 35 m from the toe. As a consequence, a large amount of water should be able to flow within this top layer. The lower layer can be interpreted as the bedrock of the landslide from a geotechnical point of view.
- • Meta-Hypothesis H*2 defines the possibility for the soil to be saturated by water, to be highly affected by fissures and to have a relatively high porosity. In terms of possibility theory, the meta-hypothesis H*2 may be expressed by the function Π2:
(8)
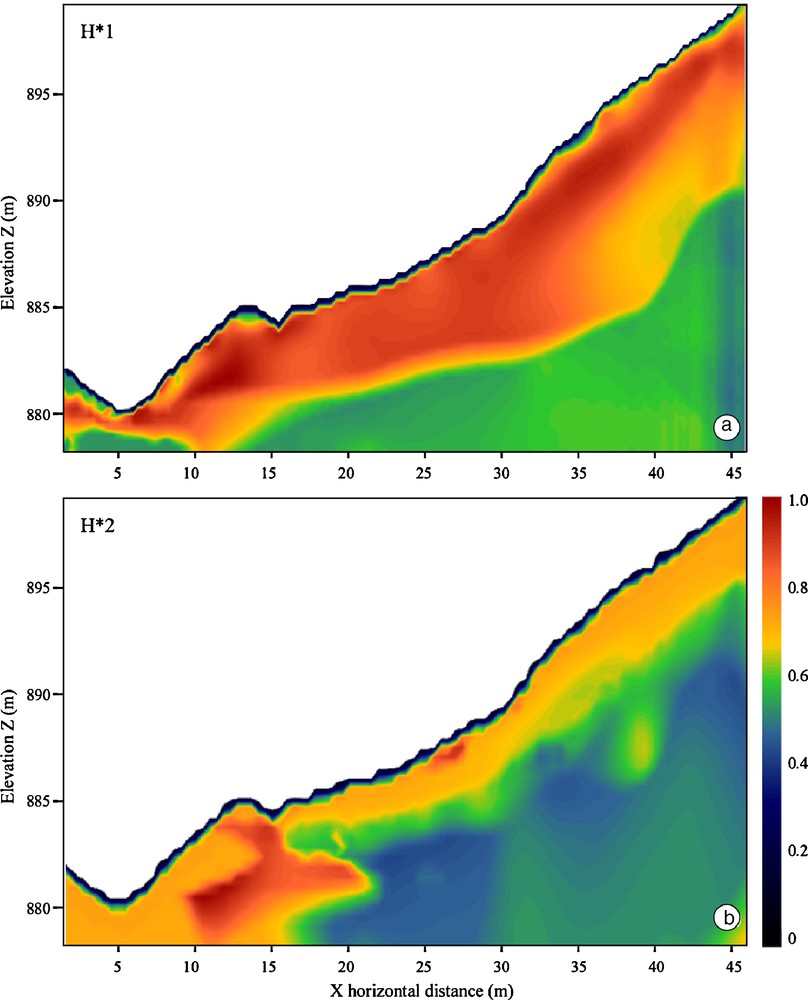
Distribution of possibility values indicating where the meta-hypotheses are realized. a: Meta-hypothesis H*1; b: Meta-hypothesis H*2. H*1 was computed with Vp and ρ parameters using π1 and π2 elementary hypotheses; H*2 was computed with Vp, ρ and Δ parameters, using π1, π2 and π3 elementary hypotheses.
Distribution des valeurs de possibilités pour la réalisation des méta-hypothèses. a : méta-hypothèse H*1 ; b : méta-hypothèse H*2. H*1 a été calculée avec Vp et ρ, en utilisant les hypothèses π1 et π2; H*2 a été calculée avec Vp, ρ et Δ, en utilisant les hypothèses π1, π2 et π3.
The section computed from (Eq. (8)) and displayed on Fig. 6b is more constrained than the section on Fig. 6a. Indeed, the Vp is correlated to the presence of fissures but is relatively unaffected by the degree of water saturation. Consequently, the model presented on Fig. 6b discriminates well-saturated and highly fissured zones from unsaturated and highly fissured zones. The introduction of the slowness difference in the fusion model has refined the location of the possible saturated zones in the topsoil. Relevant information can be extracted from this image: between distance 17 and 46 m, the possibly saturated layer is 1 to 3 m thick and seems to have the same geometry than the topography; between 10 and 20 m, an area with a high possibility of saturated zone is identified. This zone, because of its probable high soil porosity, could act as a preferential water pathway, as it will be demonstrated in the next section.
4.2 Interpretation during the rain experiment
The methodology has then been applied on the geophysical profiles observed at different times during the rain infiltration experiment. For unconsolidated sediments such as the black marls soils, the Vs values vary generally slightly with an increase in water saturation [26,27]. The Vs tomograms were not included in the fusion process, and consequently the interpretation is only based on the H*1 hypothesis. The relative differences in the function H*1 have been computed for several time steps between times 1 (t0) and 3 (12 h), 3 and 5 (24 h), 5 and 7 (36 h), 7 and 9 (48 h) and finally 9 and 11 (60 h). On Fig. 7, the water pathways during the rain infiltration are clearly identified. The variations of the possibility function on the right and left borders of the model are probably due to some artefacts associated with the electrical data inversion. Fig. 7a shows a superficial infiltration 12 h after the start of the experiment with a progressive saturation of the topsoil. In the next 12 h (time 5, Fig. 7b), the water continues to infiltrate more or less vertically into the top layer of the slope but the variations in soil saturation are still limited to the experimental plot where water is infiltrated at the surface. In the next 12 h (time 7, Fig. 7c), the value of possibility stops to increase at the vertical of the infiltration plot, but starts to increase at the downhill edge of this plot. This may be interpreted as the onset of lateral water flow to the toe of the slope. In the next 12 h (time 9, Fig. 7d), the water continues to flow downhill in the subsurface but is guided by a drain to the base of the Laval stream. Finally, Fig. 7e shows no relevant changes with low variations in the possibility values. At time 11, the addition of water does not result in any variations in soil saturation, probably because the soil is fully saturated or because water infiltration is very limited and consequently the rain water is circulating by runoff at the surface. Fig. 7 also confirms two points:
- • the base layer in the model (e.g. the blue-black contact in the figure) is certainly the impermeable marly bedrock since no variation is observed in this layer (this limit corresponds to the one identified in Fig. 6a when the possibility of the meta-hypothesis H*1 is 0.65);
- • the structure identified on Fig. 6b for a possibility value higher than 0.8 for the meta-hypothesis H*2 is a drain (e.g. fissured area or less compacted area) as is clearly visible in Fig. 7d.

Variations with time of the possibility distribution of meta-hypothesis H*2. a: variation between t0 + 12 h and t0 at the start of the infiltration experiment; b: variation between t0 + 24 h and t0 + 12 h; c: variation between t0 + 36 h and t0 + 24 h; d: variation between t0 + 48 and t0 + 36 h; e: variation between t0 + 60 and t0 + 48 h at the end of the infiltration experiment.
Variations dans le temps de la fonction de possibilité H*2. a : entre les temps t0 + 6 h et t0 au début de l’expérience d’infiltration; b : Entre les temps t0 + 12 h et t0 + 6 h; c : Entre les temps t0 + 18 h et t0 + 12 h; d : Entre les temps t0 + 24 et t0 + 18 h; e : Entre les temps t0 + 30 h et t0 + 24 h à la fin de l’expérience d’infiltration.
5 Conclusion
A combined geophysical approach based on seismic and electrical measurements has been conducted on a clay-shale slope in order to determine the internal structure, to identify some possible preferential water pathways and to monitor the water flow or changes in the soil saturation. The interpretation of Vp and Vs provides information on the state of compaction and on the porosity of the soil; the electrical resistivity (ρ) gives important indications on water contents. The changes of these parameters through time were measured during an infiltration experiment carried out on a portion of the slope. Geophysical tomograms were computed from the geophysical data and interpreted. To transfer the geophysical information to a thematic oriented one, a fusion technique is proposed in order to verify the possibility of different hypotheses related to hydrological processes within the slope. Meta-hypotheses, combining the possibility of the presence of fissures, high porosity areas and the possible development of saturated zones, were defined and computed. Analysis of these quantities reveals a more constrained model and highlights the presence of a drain which existence is confirmed by the hydrological observations. The relative differences between the possibility functions obtained at each time step are then calculated in order to monitor the water transfer within the slope. These results indicate that a fusion based on fuzzy set theory is an interesting tool for integrating geophysical interpretations for hydrological purposes. In particular, this method constitutes a real advance in multi-parameter methods compared to the qualitative methods classically used in geophysical interpretation, especially because the integration of likelihood functions in the fusion may guarantee that only reliable data are considered.
Acknowledgments
This work has been supported by the research Project Ecou-Pref “Ecoulements Préférentiels dans les versants marneux fracturés” granted by the French National Research Agency (ANR) within the ECCO-PNRH programme (2006–2008). The authors would like to thank Christophe Emblanch, Anne-Laure Cognard-Plancq & Taha-Hocine Debieche (University of Avignon & Pays de Vaucluse), Sébastien Klotz & Nicolle Mathys (Cemagref), Olivier Maquaire & Matthieu Fressard (University of Caen-Basse-Normandie), Dominika Krezminska (Technical University Delft) and Julien Travelletti (University of Strasbourg) for their support during the field experiment, and the anonymous reviewers for their constructive comments. The authors also thank Dr. Vincenzo Lapenna, for his contribution in the manuscript improvements.