

1 Introduction
Most of the earth orbiting satellites are either geostationary, such as Meteosat Second Generation (MSG), or sun-synchronous. In the latter case, they can be used at high spatial resolution. However, their orbitography makes possible only a few acquisitions per year. Basically, they orbit 14 to 15 times a day, with an orbital period of about 100 min. Except the orbital period, the most common satellite parameters to describe any spacecraft system are altitude, inclination, i.e. the angle between the satellite orbital plane and the equatorial plane of the earth, and repeat coverage (Table 1). The local mean time, a form of the solar time that corrects the variations of local apparent time and then forms a uniform time scale at a specific longitude, is rarely debated, although it could be a very relevant feature, especially when coastal zones are concerned (Cracknell, 1999). Sometimes, it is not indicated within the metadata or unclearly mentioned, with possible confusion between local time, solar time, local mean time, etc. Sun-synchronous orbits are typically described by their equatorial crossing times in descending node. Since the first earth observing satellites have been launched in the early 1970s, the time of acquisition is very similar whatever the data used, because the equatorial crossing time of most of the satellites ranges between 09:30 and 10:30 (Table 1). Nevertheless, it should be noticed that the Landsat programme has been defined with earlier local mean times than those of the other satellites including Spot, IRS or ALOS. Indeed, Spot satellites cross the equator about 45 min after the Landsat ones.
Principales caractéristiques des systèmes d’observation de la Terre.
| Year of launch | Mission | Period (min) | Altitude (km) (mean) | Inclination (°) | Repeat coverage (days) | Equatorial Crossing Time (descending node) |
| 1972/75/78 | LANDSAT 1-2-3 | 103 | 910 | 99.2 | 18 | 09:42 A.M. |
| 1982/84 | LANDSAT 4-5 | 99 | 705 | 98.2 | 16 | 09:45 A.M. |
| 1986/90/93 | SPOT 1-2-3 | 101 | 832 | 98.7 | 26 | 10:30 A.M. |
| 1992 | JERS 1 | 96 | 568 | 97.7 | 44 | 10:30 A.M. |
| 1995 | IRS 1C | 101 | 817 | 98.7 | 24 | 00:30 A.M. |
| 1998/2002 | SPOT 4-5 | 101 | 830 | 98.7 | 1–4 | 10:30 A.M. |
| 1999 | LANDSAT 7 | 99 | 705 | 98.2 | 16 | 09:30 A.M. |
| 1999 | EOS TERRA | 90 | 705 | 98.5 | 15 | 10:30 A.M. |
| 2000 | EOS AQUA | 90 | 705 | 98.5 | 15 | 01:45 P.M. |
| 2006 | ALOS | 99 | 692 | 98.2 | 46 | 10:30 A.M. |
Tidal flats such as the German Bight or the Dutch Wadden are the places of interest for many topics in earth sciences, such as sedimentology (Blott et al., 2006; Deloffre et al., 2005; Malvareza et al., 2004; Sørensen et al., 2006), engineering geology (van de Kreeke, 2006; Yang et al., 2008) or, more generally, environment. We report here on the geological mapping of large French tidal flats. Such a cartography must be supported by aerial photographs and satellite images acquired at low tide to expose the larger tidal flat as possible. For very large tidal flats such as the Mont Saint-Michel Bay covering about 250 km2 at low spring tides, the acquisition of homogeneous aerial photographs is difficult, because 1 to 2 h are necessary to totally cover the area. The same problem was encountered for the Lidar campaign (Fondation Total) carried out on 23, 24 September and 8 October 2002. Therefore, satellite data should be selected. Optical data allow a detailed mapping of the sediments using spectral criteria (Bonnot-Courtois et al., 2004; Deroin and Verger, 2002; Marchand et al., 1998; Ryu et al., 2008), whereas radar data could be used to improve the roughness and moisture parameters (Gade et al., 2008).
2 Material and method
It is well established that the amplitude of the tide deeply depends on the Earth–Moon–Sun system's geometry. This amplitude also depends on the geographical location of the area under investigation, on the slope of the tidal flat, and on the time of acquisition. At the time of one of the last biggest tide that occurred on 29 March 1998, the tidal range, i.e. the difference between the high tide and the next low tide, was 14.25 m at Cancale station, Ille-et-Vilaine department, the reference for the Mont Saint-Michel Bay located in the western English Channel, 6.93 m at Grandcamp station, Calvados department, the reference for the Baie des Veys in the central English Channel between the two Landing places of Utah Beach and Omaha Beach, and only 4.50 m at Cap-Ferret station, Gironde department, at the entrance of the Arcachon basin on the Atlantic coast of France. Hereinafter, we discuss the detailed case of the tidal flat of the Mont Saint-Michel Bay, the 1:50,000 geological mapping of which has been realized with the help of the SPOT imagery (L’Homer et al., 1999).
3 Results
3.1 The French intertidal zones
Fig. 1 illustrates the link between sea elevation at low tide and local mean time. This latter is indicated in UTC or Universal Time Coordinated, the same as the Greenwich Mean Time. All low tides occurring in 2007 have been plotted with their corresponding local mean time. At Cap-Ferret (Fig. 1A) and Cancale (Fig. 1C), 705 low tides occurred during 2007, one more (706) at Grandcamp (Fig. 1B). It is easy to demonstrate that these graphs are similar whatever the year considered using a comparison between the low tides occurring at Cancale in 2007 and 1964 (Fig. 1D). The tidal range is then dictated by the location of the site under investigation. The annual variations of the tidal range, and particularly the link between the higher amplitudes and the equinoctial tides, characterize the solar declination influence (Verger, 2009).
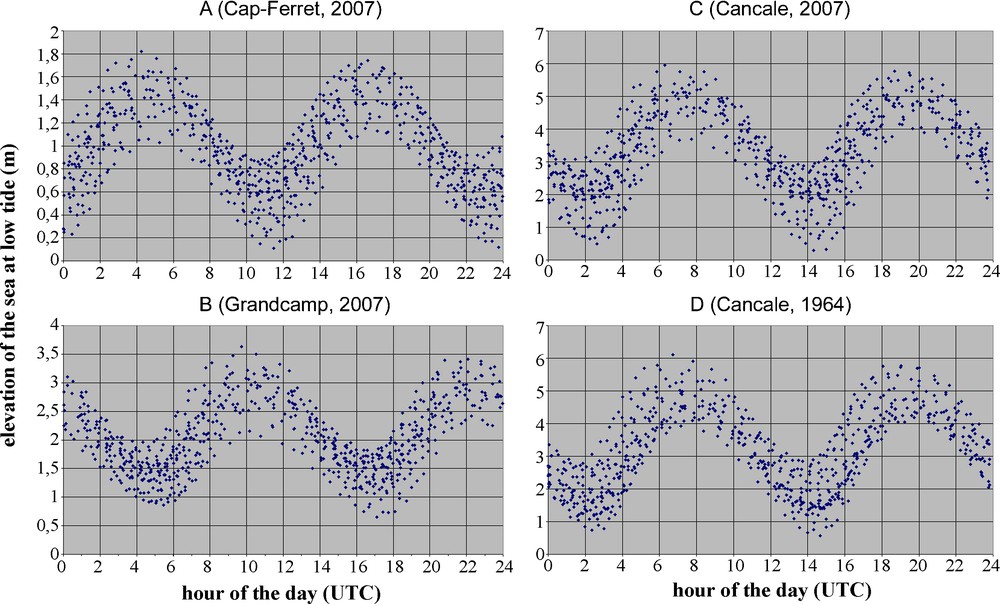
Relation between the hour of the day (UTC) and the elevation of the sea at low tide. One year of measurements (705 to 708 ebb tides). A. Cap-Ferret (2007). B. Grandcamp (2007). C. Cancale (2007). D. Cancale (1964).
Relation entre l’heure du jour (exprimée en UTC) et la hauteur d’eau à marée basse. Une année de mesures (705 à 708 marées basses). A. Cap-Ferret (2007). B. Grandcamp (2007). C. Cancale (2007). D. Cancale (1964).
Each French coastal site illustrates a semi-diurnal tide with a period of 12 h 25 min. The tidal ranges observed in the afternoon (between 12:00 and 24:00 UTC) are slightly higher than those in the morning (0:00 to 12:00 UTC), because of the western position of the sun. This is particularly clear at Grandcamp and Cancale, where the site's geometry plays also a particular role: the inner part of the Seine Bay for Grandcamp, and the Saint-Malo Gulf for Cancale. At Grandcamp, the lower tides occurred at about 17:00 (and 5:00) UTC, whereas they occurred at about 14:30 (and 2:30) UTC at Cancale and 11:30 (and 23:30) UTC at Cap-Ferret, respectively. In western France, the satellite acquisitions take place around 11:00 ± 45 min UTC for most of the spacecraft systems (Tables 1 and 2). The three coastal examples appear then respectively fully unfavourable (Baie des Veys), somewhat favourable (Mont Saint-Michel Bay) and very favourable (Cap-Ferret) for obtaining the larger tidal flat. Thus, satellite data allow one to characterize more or less completely the extent of the tidal flat, depending from the time and the place under investigation.
Relation entre la hauteur d’eau et la superficie de l’estran. ISS = Station Spatiale Internationale.
| Mission | Date of acquisition | Time (UTC) | Surface (km2) | Percentage (%) | Sea elevation at Cancale (m from marine zero) | Flood/ebb tide | Distance from 0 on the profile (km) |
| Full tidal flat | 243 | 100 | 0.00 | 0.00 | |||
| ALOS AVNIR-2 | 2007 10 24 | 11:12 | 193 | 80 | 2.56 | Ebb tide | 1.30 |
| JERS1-OPS | 1992 07 29 | 11:16 | 190 | 78 | 3.01 | Ebb tide | 1.47 |
| SPOT3-XS | 1995 01 15 | 11:22 | 185 | 76 | 3.45 | Ebb tide | 1.59 |
| ISS02 | 2001 07 02 | 10:58 | 175 | 72 | 3.60 | Flood tide | 1.67 |
| SPOT1-P | 1986 06 09 | 11:40 | 144 | 59 | 4.92 | Ebb tide | 2.76 |
| SPOT2-XS | 1993 08 20 | 11:33 | 129 | 53 | 6.23 | Ebb tide | 4.46 |
| LANDSAT7-ETM+ | 2000 04 07 | 10:50 | 88 | 36 | 8.39 | Ebb tide | 7.28 |
| LANDSAT7-ETM+ | 2000 07 21 | 10:43 | 9 | 4 | 9.85 | Ebb tide | N/A |
| Mont Saint-Michel | 10.5 |
3.2 The case of the Mont Saint-Michel Bay
A database has been built to hold information on the role of the local mean time in the mapping of the Mont Saint-Michel Bay. It contains eight satellite images with water elevation ranging from 2.56 to 9.85 m (Table 2). The instantaneous limit of the sea is drawn preferably using the near infrared range. Sometimes, the visible range could be used, but sedimentary plumes make water limits unclear, particularly when ebb tide is concerned. Theoretically, flow tide images should be preferred, because of a sharper limit due to the flood currents, that are more rapid (flow tide is about 5 h 25 min long, whereas ebb tide is about 7 h long). Moreover, the flooding of dry sand makes the limit clearer. Because the sea in the English Channel is not a perfectly horizontal surface (it is higher in the west during flood tide and higher in the east during ebb tide) the shape of the tidal flat is not exactly the same at flow or ebb tide for a similar water elevation. Indeed, the flood preferably concerns the north-eastern part of the bay. This phenomenon is clearly visible in the image acquired by the International Space Station (ISS) in 2001, that represents the only acquisition of the database in such flooding conditions. The actual value of elevation is also variable depending from the pressure conditions. An error of about ± 0.5 m could be estimated.
The instantaneous limits defined using satellite data allow us to calculate the surface of the tidal flat for each water elevation (Foody et al., 2005; Zhao et al., 2008). Then, the relationship between the water elevation calculated at Cancale and the surface of the tidal flat is clear (Figs. 2 and 3). For the eight images used, this surface ranges from 4 to 80% of the total surface of the tidal flat (243 km2). The adjustment curve in Fig. 3 shows an inflexion at about 3–4 m. The slope of the curve is weaker in the distal part of the tidal flat, meaning a steeper sea bottom. For a better understanding of this tidal flat, and particularly the aforementioned inflexion, a profile was studied along a NW–SE axis that corresponds to the maximum width of the tidal flat. The section is about 10.5 km long, starts from the Mont Saint-Michel and is oriented toward the north-west (Fig. 4). All the images of the database have been considered, except the Landsat data with a sea elevation of 9.85 m. In this case, the limit of the sea partly cuts the main meander of the Couesnon River and the local morphology is relatively difficult to decipher. The slope of the tidal flat is higher (0.2%) between 0 and 3.5 m, whereas it is only 0.06% between 4.5 and 10 m. Between 3.5 and 4.5 m, there is a high slope situated at about 9 km from the Mont Saint-Michel. This fact is also revealed in the work by (Kaveh and Deffontaines, 2005: Fig. 14), although these authors illustrated the whole megatidal prism about 20 km width, using onshore and offshore digital terrain models. Then, the edge we observed using the instantaneous limits is located in the upper part of the megatidal sedimentary prism made of coarse sandy sediments (L’Homer et al., 1999). The bottom-sets are definitely not visible using remote-sensing data because they are never exonded. The very flat morphology of the upper part of the megatidal sedimentary prism is due to strong tidal effects associated with scarce fluviatile deposits (Kaveh and Deffontaines, 2005).
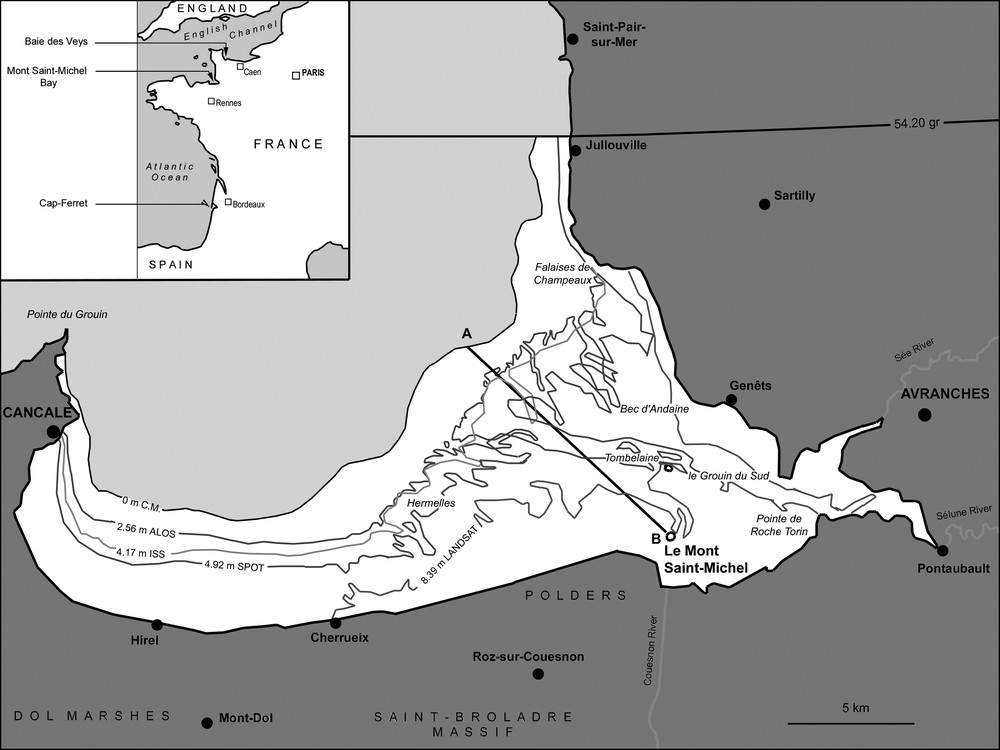
Map of the Mont Saint-Michel bay with the instantaneous limits of the sea for different data sets (Table 2). Only four limits have been indicated for clarity. The tidal flat (white area) extends from Pointe du Grouin to Jullouville at latitude North 54.20 gr (i.e. 48°46’51″). AB profile: see also Fig. 4.
Carte de la Baie du Mont Saint-Michel avec indication de limites instantanées de la mer, définies à partir de données satellitales (Tableau 2). Par souci de clarté, seules quatre limites ont été portées. L’estran est défini entre la Pointe du Grouin et Jullouville à la latitude N.54,20 gr (48°46’51″). Profil AB : voir également la Fig. 4.
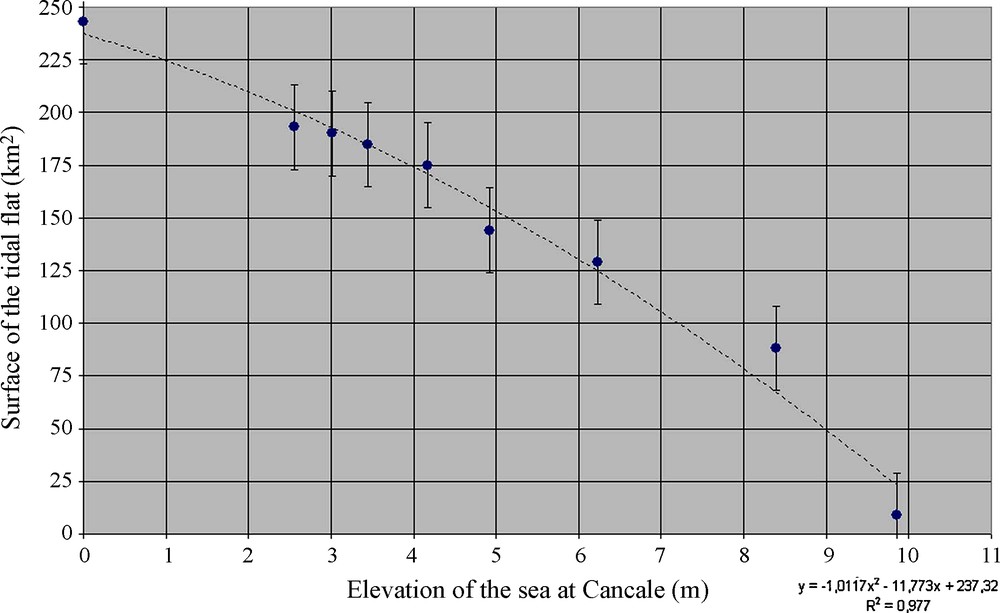
Mont Saint-Michel. Relation between the surface of the tidal flat and the elevation of the sea at Cancale (m). A standard error of ±15 km2 has been estimated for the surface.
Relation entre la superficie de l’estran et la hauteur d’eau mesurée à Cancale (m). Une barre d’erreur de ±15 km2 a été estimée.
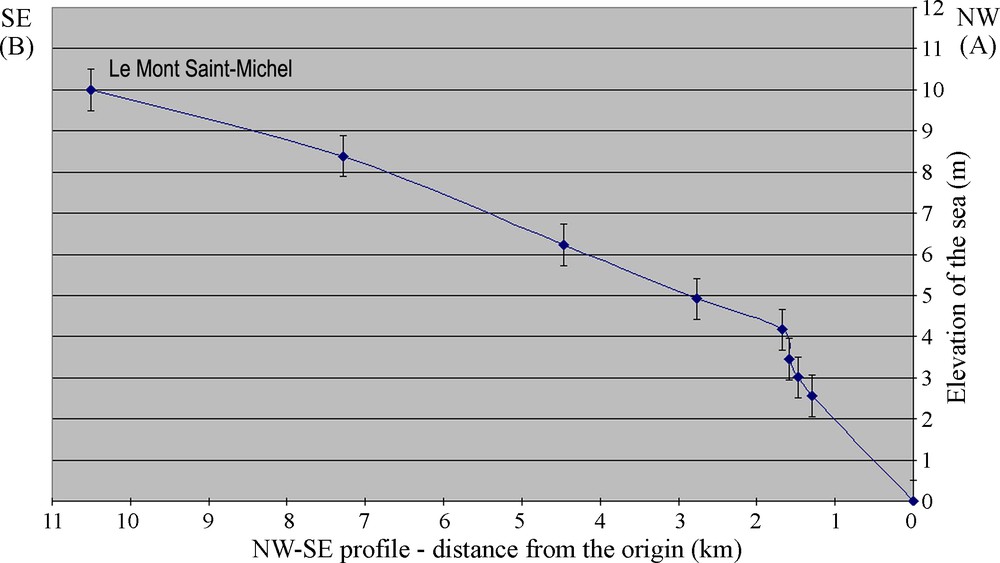
Profile of the Mont Saint-Michel tidal flat. Link between elevation of the sea (m) and location in the upper part of the sedimentary prism (see profile on Fig. 2). The error on the elevation is estimated at ±0.5 m.
Esquisse topographique de l’estran du Mont Saint-Michel à partir de la relation entre la hauteur d’eau et la position dans la partie supérieure du prisme sédimentaire (voir position du profil sur la Fig. 2). La barre d’erreur sur les hauteurs d’eau est estimée à ±0,5 m.
From a thematic point of view, the satellite images allow also the main environmental changes to be mapped. Two scenes acquired by JAXA, the Japanese Space Agency, have been compared, one from the JERS-1 Optical Sensor (OPS) acquired on 29 July 1992 and the other from the ALOS Advanced Visible Near Infrared Radiometer (AVNIR-2) acquired on 24 October 2007. The JERS-1 data have been already used for detailed studies (Deroin et al., 1997; Marchand et al., 1998). These JERS-1 and ALOS scenes could be used for characterizing changes during the last 15 years (period 1992–2007), because they offer the lowest water elevations, 3.01 m and 2.56 m respectively. It should be noticed that 2.56 m is very close to the theoretical minimal value of 2.40 m (Fig. 1). The study of the tidal flat reveals deep changes in the watercourse of the Couesnon, Sélune and Sée River, with meandering features particularly for the Couesnon River, associated with bank migration (Deroin et al., 2009). The most spectacular result consists in the mapping of the halophytic vegetation developed in the upper part of the tidal flat. Previous works have pointed out the progression of the schorre (the vegetated part of the upper tidal flat) using aerial photographs or multispectral data and checked in the field (Bonnot-Courtois et al., 2002; Deroin and Verger, 2002; Desguée, 2008; Kaveh and Deffontaines, 2005; L’Homer et al., 1999; Marchand et al., 1998; Verger, 2009). This vegetation plays a key role in the fixation of the sediment in the upper tidal flat. Between 1992 and 2007, the schorre of the internal part of the bay has gained about 6 km2, i.e. about +20% (Table 3 and Fig. 5). All the sectors illustrate a progression of the vegetation. The most important gain (60%) is observed at Bec d’Andaine–Grouin du Sud, whereas this area seemed to be stabilized between 1986 and 1995 (Marchand et al., 1998), and also until 2006 (Desguée, 2008). In the field, this appears clearly due to the recent extent of the spit (Bec d’Andaine) and the migration of the Sée–Sélune channel, principally from end–2006 onward. In the detail, the rate of progression deeply varies in time and space, and depends from the plants concerned. Basically, the salt meadows are relatively stable (for example near Roche Torin) and present a relatively low rate of progression (e.g. Les Herbus East). This apparently inexorable progression of the vegetation is also illustrated around the Mont Saint-Michel, and particularly to the west representing about half the total surface gained by the halophytic plants (about 3 km2), an area suffering an important anthropic influence. It should be reminded that polderization terminated in the early 1930s. From this period onward, the progression of the vegetation is incessant, with higher rates observed between the early 1950s and the 1980s (Bonnot-Courtois et al., 2002; Deroin and Verger, 2002).
Évolution de la superficie des herbus (schorre) entre 1992 et 2007. Numéros des secteurs de schorre localisés sur la Fig. 5.
| Location | 1992 (JERS1-OPS) (hectares) | 2007 (ALOS-AVNIR2) (hectares) | Evolution 1992–2007 (%) |
| 1. Les Herbus (West) | 1322.3 | 1613.0 | +22.0 |
| 2. Les Herbus (East) | 1031.2 | 1156.8 | +12.2 |
| 3. Bec d’Andaine-Grouin du Sud | 252.9 | 408.3 | +61.4 |
| 4. Sée River (right bank) | 245.4 | 287.5 | +17.2 |
| 5. Sée River (left bank) | 248.2 | 257.3 | +3.7 |
| 6. Sélune River | 120.6 | 134.4 | +11.4 |
| Total | 3220.6 | 3857.3 | +19.8 |
| Percentage of the tidal flat surface | 13.3 | 15.9 | +2.6 |
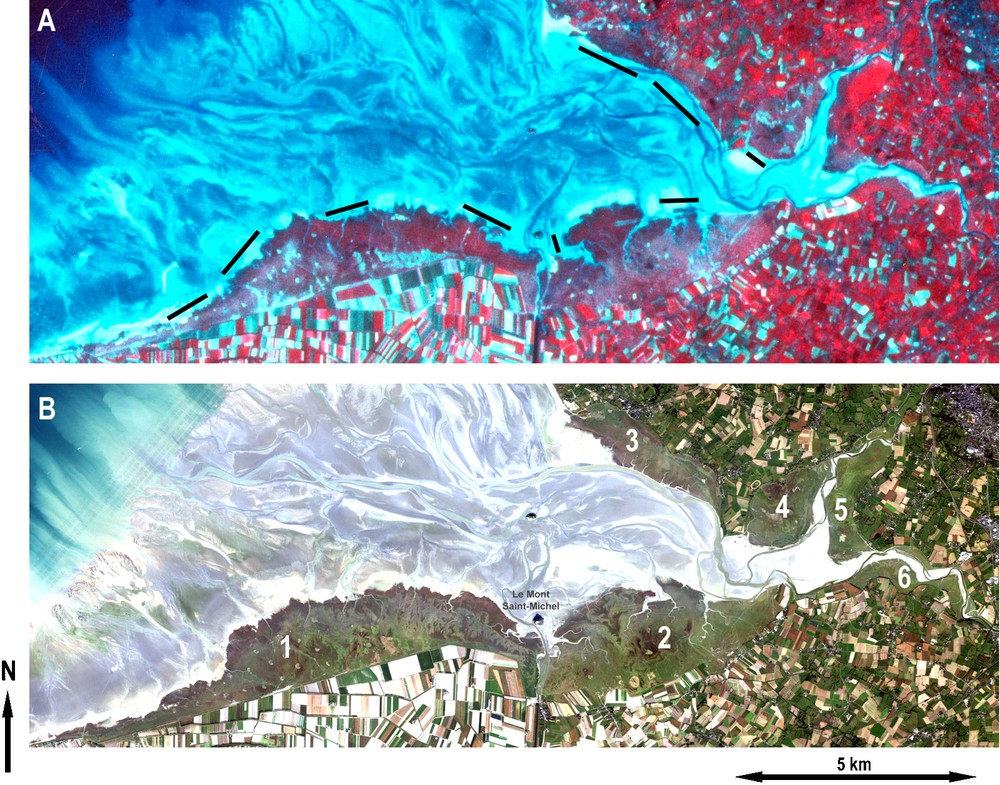
A. Colour composite of the JERS data acquired on July 29, 1992 (standard false colours: red = near infrared range, green = red range, blue = green range). The black lines correspond to a major extent of the schorre between 1992 and 2007. B. Colour composite of the ALOS AVNIR-2 data acquired on October 24, 2007 (natural colours: red = red range, green = green range, blue = blue range). Numbers 1 to 6 refer to the sectors defined in Table 3.
A. Composition colorée de la donnée JERS acquise le 29 juillet 1992 (fausses couleurs standard: rouge = domaine spectral du proche infrarouge, vert = domaine du rouge, bleu = domaine du vert). Les lignes noires indiquent les secteurs à forte progression des schorres entre 1992 et 2007. B. Composition colorée de la donnée ALOS-AVNIR-2 acquise le 24 octobre 2007 (couleurs naturelles: rouge = domaine spectral du rouge, vert = domaine du vert, bleu = domaine du bleu). Les chiffres de 1 à 6 correspondent aux secteurs définis au Tableau 3.
4 Discussion – conclusion
The time of acquisition in remote sensing is a key factor. Basically, satellites should acquire homogeneous data, whatever the longitude under consideration. This means in comparable conditions, including time conditions. The local mean time is then a compromise taken into account especially the cloud cover in the equatorial region and the morning fogs in the temperate zones. This leads to great difficulties for the mapping of tidal flats. We have previously illustrated three typical cases: one is unfavourable (Baie des Veys) with a water elevation of at least 2.2 m at 11:00 UTC (annual values range from 0.6 to 3.7 m), one is somewhat favourable (Mont Saint-Michel) with a water elevation of 2.4 m (0.3 to 6 m), and one is very favourable (Cap-Ferret) with a water elevation of 0.1 m (0.1 to 1.8 m). Nevertheless, due to the landform of each tidal flat, the theoretical maximum percentage of observable tidal flat is about 55% (Baie des Veys), 80% (Mont Saint-Michel) and 100% (Cap-Ferret), respectively. The use of diachronous data extending over more than 21 years (Fig. 2 and Table 2) can only general trends about the tidal flat's geometry to be determined. Nevertheless, this method could be extended to less known areas of the world. In the case of the Mont Saint-Michel, the morphology of the lower tidal flat as revealed by the instantaneous limits of the sea remotely sensed using multisource satellites is consistant with previous works on the whole bathymetry of the bay (Gade et al., 2008; Juc and Deffontaines, 2003).
The local mean time is a relevant parameter for any spacecraft system, that is rarely debated because most of the satellites acquire in quite similar conditions. Moreover, only a few set of “dynamic” applications is really concerned by the time of acquisition. The example of the Mont Saint-Michel Bay shows that 80% at maximum of the tidal flat could be studied with the current satellites. The other 20% correspond to a water elevation ranging from 0 to 2.5 m approximately. This very important part of the tidal flat includes particular sediments such as medium sands (200 to 500 μm) and, sometimes, coarse sands (500 μm to 2 mm) in the south-western part of the bay, and fine mud in the western part, close to the limit with the subtidal domain. These sediments could only be mapped using afternoon data. This interest for AM/PM acquisition has been illustrated for the first time by the large-scale MODIS sensor onboard two Earth Observing System (EOS) acquiring at 10:30 UTC (Terra) and 13:45 UTC (Aqua), respectively (Table 1). More generally, the National Polar-orbiting Operational Environmental Satellite System (NPOESS), the heir of the American space policy, now envisages AM and PM-acquisitions but this system is planned for the 2010s. A more complete set of local mean times is also essential for the survey of natural disasters that occur whatever the time of the day.
Acknowledgements
The ALOS data have been obtained in the frame of the Pilot-Project ADEN-ALOS no. 3463 (Geological Mapping of Sensitive Environments) supported by the Japanese Space Agency (JAXA) and the European Space Agency (ESA). The Landsat data were downloaded on the Global Land Cover Facility website (http://glcfapp.umiacs.umd.edu:8080/index.jsp), the ISS data were downloaded on the Gateway to Astronaut Photography of Earth website (http://eol.jsc.nasa.gov), and the Spot data from 1986 were downloaded from the Nima website (http://geoengine.nga.mil). The values of water elevation and corresponding local mean times were downloaded on the SHOM website (http://www.shom.fr/).