

1 Introduction
The main objective of the European Hot Dry Rock Energy (HDR) Program is to develop a deep heat exchanger to generate electricity, at the site of Soultz-sous-Forêts, France. This site, located within the Tertiary Rhine Graben (Fig. 1), which forms a part of the West European Rift, was selected for its large surface heat flow anomaly exceeding 140 mW/m2 (Pribnow and Clauser, 2000) and for its tectonic structure, characterized by prominent north-south faults, extending into the crystalline basement (Rousset et al., 1992).
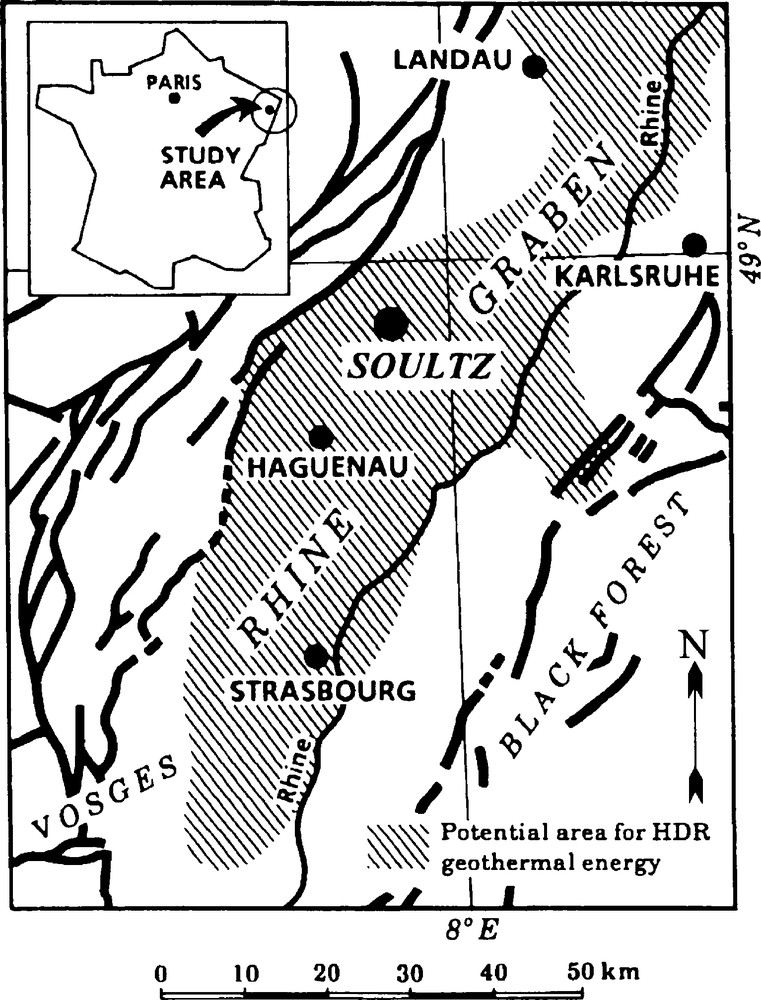
Location map of the Rhine Graben and Soultz-sous-Forêts, France.
Carte de localisation du graben rhénan et de Soultz-sous-Forêts, France.
The construction of a Scientific Pilot Plant was initiated in 2001 (Gérard, 2005). Between 1987 and 1996, three wells (GPK-1, EPS1 and GPK-2) had been drilled to depths less than 3900 m (Fig. 2). In 1997, a forced four month fluid circulation test suggested that it was possible to circulate between GPK-1 and GPK-2 at depths of 3500–3600 m, with a mean injection flow rate of 25 l/s and a temperature close to 140 °C (Aquilina et al., 2004). It was, however, decided to drill deeper wells, mainly for economical reasons. Well GPK-2 was deepened from 3900 to about 5000 m in 1999, and wells GPK-3 and GPK-4 were drilled to similar depths in 2002 and 2004, respectively. These deviated wells, which will make up the heat exchanger (GPK-3 as injector and GPK-2 and GPK-4 as producers; Fig. 2), intersected a 1400 m-thick sedimentary cover and extended into a granitic basement, with a temperature close to 200 °C and the presence of a geothermal NaCl brine (TDS ≈ 100 g/l). For each of the three wells, an open-hole section is located between about 4500 and 5000 m.

Location map and profiles of the geothermal wells (Dezayes et al., 2005).
Carte de localisation et profils des puits géothermiques (Dezayes et al., 2005).
In order to improve well injectivity and the quality of the existing connections between wells (major fractures), which sometimes are sealed by hydrothermal alteration products, different hydraulic stimulation tests were carried out in these wells between 2000 and 2005, accompanied by tracer tests, production tests, geophysical and geochemical monitoring (Sanjuan et al., 2001; Sanjuan et al., 2004; Sanjuan et al., 2006a; Sanjuan et al., 2006b).
After these stimulation operations, and as in 1997 but at greater depth and higher temperature, a fluid circulation test was conducted between the injection well GPK-3 and the production wells GPK-2 and GPK-4, from July to December 2005, with a mean injection flow rate of 15 l/s. After this test, several chemical stimulation operations were conducted in the wells GPK-3 and GPK-4 between 2006 and 2007 (Sanjuan et al., 2007).
This study, performed within the framework of the accompanying scientific work of the European HDR Program, presents new and important results about the native geothermal brine and associated gases present at depths ranging from 3500 to 5000 m. These data were obtained during the fluid geochemical monitoring carried out between 1999 and 2005 as a part of the production tests which accompanied the well drilling and the hydraulic stimulation operations, and during the fluid circulation tests. It summarizes the main characteristics of this geothermal brine which can be drawn up in 2008 from this work and previous work, in terms of fluid nature, origin and circulation. It completes the study of the characteristics of fluid circulation in the heat exchanger deduced from the tracer tests carried out between 2000 and 2005 (Sanjuan et al., 2006a).
2 Geochemical fluid characteristics
2.1 Chemical and isotopic composition of the deep native geothermal brine
2.1.1 Fluid samples collected from GPK-1 and GPK-2 at depths shallower than 3600 m before October 1999
Before the deepening of GPK-2 from a depth of 3900 to about 5000 m in 1999, all the fluid samples were collected at depths shallower than 3600 m.
Representative chemical and isotopic compositions of the native geothermal brine discharged from the well GPK-1 at different depths (Table 1) are reported in (Pauwels et al., 1993) and (Aquilina et al., 1997). This geothermal brine was produced from GPK-1 at depths of about 1800–1900 m and 3500 m, respectively.
Résultats des analyses des fluides produits dans les puits GPK-1 (Pauwels et al., 1993; Aquilina et al., 1997; Sanjuan et al., 2001), GPK-2, GPK-3 et GPK-4 (Vaute, 1998; Sanjuan et al., 2001; Sanjuan et al., 2004; Sanjuan et al., 2006b) utilisées pour déterminer la composition chimique et isotopique la plus représentative de la saumure géothermale profonde de Soultz (3500–5000 m).
| Fluid sample | Sampling date | Depth (m) | T (°C) | Density (20 °C) | Conductivity (mS/cm) | pH | O2 (%) | Eh (mV) | δ18O (‰) | δD (‰) | 3H (TU) | 87Sr/86Sr |
| GPK-1 | ||||||||||||
| GPK1-KS228 (Pauwels et al., 1993) | 1986–1991 | Wellhead | 5.82 | −3,1 | −41.0 | 0.711590 | ||||||
| GPK1-KD006 (Pauwels et al., 1993) | 1986–1991 | 1845 | 137 | 5.02 | −2.6 | −39.8 | ||||||
| KP-3500 (Aquilina et al., 1997) | 1993 | 3470 | 165 | 5.03 | −2.9 | −36.7 | 0.711320 | |||||
| GPK1-99-P1 (Sanjuan et al., 2001) | 02/03/99 | Wellhead | 47.8 | 111 (20 °C) | 5.52 (20 °C) | |||||||
| GPK1-99-P2 (Sanjuan et al., 2001) | 08/04/99 | Wellhead | 131 (25 °C) | 5.35 (31 °C) | 1.0 | |||||||
| GPK1-99-P3 (Sanjuan et al., 2001) | 06/05/99 | Wellhead | 131 (25 °C) | 5.48 (17 °C) | 3.9 | |||||||
| GPK-2 | ||||||||||||
| KP3-97-16 (Vaute, 1998) | 25/07/97 | Wellhead | 30.5 | 1.053 | 95 (20 °C) | 5.73 (30 °C) | 3.9 | 34 | ||||
| KP3-97-122 (Vaute, 1998) | 25/08/97 | Wellhead | 31.0 | 1.059 | 5.06 (31 °C) | 0.7 | 120 | |||||
| KP3-97-296 (Vaute, 1998) | 25/09/97 | Wellhead | 47.3 | 1.065 | 5.13 (47 °C) | 0 | 114 | |||||
| KP3-97-435 (Vaute, 1998) | 25/10/97 | Wellhead | 27.3 | 1.064 | 116 (20 °C) | 5.04 (27 °C) | 0 | 140 | ||||
| KP3-97-600 (Vaute, 1998) | 16/11/97 | Wellhead | 32.8 | 1.064 | 116 (20 °C) | 5.04 (33 °C) | 0 | 140 | ||||
| GPK2-99-S2 (Sanjuan et al., 2001) | 26/11/99 | Wellhead | 34.0 | 1.064 | 114 (20 °C) | 5.43 (20 °C) | 30 | −3.6 | −34.7 | |||
| GPK2-99-S3 (Sanjuan et al., 2001) | 29/11/99 | Wellhead | 40.0 | 1.063 | 114 (20 °C) | 5.41 (20 °C) | 20 | −3.1 | −35.3 | |||
| GPK2-99-S4 (Sanjuan et al., 2001; Sanjuan et al., 2004) | 03/12/99 | Wellhead | 35.0 | 1.065 | 119 (20 °C) | 5.46 (20 °C) | 8 | −2.9 | −35.1 | |||
| GPK2-99-D1 (Sanjuan et al., 2001; Sanjuan et al., 2004) | 02/12/99 | 650 m | 1.063 | 113 (20 °C) | 5.45 (20 °C) | −63 | −3.3 | −34.5 | 0.711264 | |||
| GPK2-99-D2 (Sanjuan et al., 2001) | 02/12/99 | 650 m | 1.063 | 114 (20 °C) | 5.51 (20 °C) | 17 | ||||||
| GPK2-99-D3 (Sanjuan et al., 2001) | 02/12/99 | 700 m | 1.063 | 114 (20 °C) | 5.72 (20 °C) | −35 | ||||||
| GPK2-02-P71 (Sanjuan et al., 2004) | 24/04/02 | Wellhead | 39.4 | 1.050 | 97 (25 °C) | 5.58 (20 °C) | −23 | −3.1 | −36.0 | 3 | ||
| GPK2-03-P42 (Sanjuan et al., 2006b) | 09/07/03 | Wellhead | 1.040 | 78 (25 °C) | 5.67 (20 °C) | |||||||
| GPK2-05-P149 (Sanjuan et al., 2006b) | 22/11/05 | Wellhead | 159 | 1.060 | 110 (25 °C) | 5.39 (20 °C) | 16 | −1 | ||||
| GPK-3 | ||||||||||||
| GPK3-03-P8 (Sanjuan et al., 2004) | 18/03/03 | Wellhead | 40.0 | 1.062 | 106 (25 °C) | 5.51 (20 °C) | ||||||
| GPK-4 | ||||||||||||
| GPK4-05-P212 (Sanjuan et al., 2006b) | 22/11/05 | Wellhead | 121 | 1.057 | 106 (25 °C) | 5.15 (20 °C) | 16 | 14 | ||||
| Most representative chemical and isotopic composition of the deep native geothermal brine | 230? | 1.065 | 120 (20 °C) | 5.0 | 0 | < −100 | −3.1 | −35.1 | 0 | 0.71126 | ||
| Fluid sample | Sampling date | δ7Li (‰) | δ18O(SO4) (‰) | δ34S(SO4) (‰) | Na (g/l) | K (g/l) | Ca (g/l) | Mg (mg/l) | Cl (g/l) | SO4 (mg/l) | (1)Alk. (meq/l) | (2)Alk. (meq/l) |
| GPK-1 | ||||||||||||
| GPK1-KS228 (Pauwels et al., 1993) | 1986–1991 | 8.5 | 17.1 | 28.2 | 3.32 | 6.73 | 150 | 58.5 | 215 | 10.6 | n.a. | |
| GPK1-KD006 (Pauwels et al., 1993) | 1986–1991 | 7.8 | 17.4 | 28.0 | 3.28 | 6.96 | 152 | 58.1 | 220 | 3.1 | n.a. | |
| KP-3500 (Aquilina et al., 1997) | 1993 | 5.9 | 14.0 | 27.9 | 2.81 | 7.30 | 112 | 61.0 | 198 | 7.5 | n.a. | |
| GPK1-99-P1 (Sanjuan et al., 2001) | 02/03/99 | 27.2 | 3.30 | 6.26 | 139 | 58.7 | 255 | 4.4 | 2.8 | |||
| GPK1-99-P2 (Sanjuan et al., 2001) | 08/04/99 | −0.4 | 25.9 | 3.25 | 6.92 | 109 | 57.9 | 246 | 5.6 | 3.9 | ||
| GPK1-99-P3 (Sanjuan et al., 2001) | 06/05/99 | 27.5 | 3.16 | 6.24 | 411 | 59.5 | 231 | 5.3 | 3.2 | |||
| GPK-2 | ||||||||||||
| KP3-97-16 (Vaute, 1998) | 25/07/97 | 22.5 | 2.99 | 5.77 | 119 | 49.5 | 217 | 3.6 | 2.6 | |||
| KP3-97-122 (Vaute, 1998) | 25/08/97 | 22 | 3.27 | 6.52 | 127 | 54.5 | 225 | 3.9 | 2.4 | |||
| KP3-97-296 (Vaute, 1998) | 25/09/97 | 24.8 | 3.26 | 6.65 | 123 | 55.9 | 214 | 4.9 | 2.3 | |||
| KP3-97-435 (Vaute, 1998) | 25/10/97 | 0.6 | 25.2 | 3.36 | 6.59 | 120 | 57.3 | 214 | 4.4 | 2.2 | ||
| KP3-97-600 (Vaute, 1998) | 16/11/97 | −0.1 | 25.3 | 3.38 | 6.67 | 119 | 57.0 | 221 | 3.6 | 2.1 | ||
| GPK2-99-S2 (Sanjuan et al., 2001) | 26/11/99 | 4.9 | 12.8 | 26.8 | 2.88 | 6.65 | 75 | 57.8 | 171 | 6.6 | n.a. | |
| GPK2-99-S3 (Sanjuan et al., 2001) | 29/11/99 | 5.2 | 12.6 | 26.2 | 2.91 | 6.65 | 77 | 57.6 | 172 | 6.3 | n.a. | |
| GPK2-99-S4 (Sanjuan et al., 2001; Sanjuan et al., 2006b) | 03/12/99 | 5.5 | 13.1 | 26.4 | 2.87 | 6.78 | 78 | 58.5 | 170 | 7.7 | n.a. | |
| GPK2-99-D1 (Sanjuan et al., 2001; Sanjuan et al., 2006b) | 02/12/99 | 27.4 | 2.86 | 6.60 | 98 | 59.0 | 159 | n.a. | 6.3 | |||
| GPK2-99-D2 (Sanjuan et al., 2001) | 02/12/99 | n.a. | n.a. | n.a. | n.a. | 58.5 | 158 | n.a. | 6.3 | |||
| GPK2-99-D3 (Sanjuan et al., 2001) | 02/12/99 | 27.5 | 2.93 | 6.80 | 99 | n.a. | n.a. | n.a. | 6.3 | |||
| GPK2-02-P71 (Sanjuan et al., 2004) | 24/04/02 | 23.5 | 2.77 | 5.02 | 124 | 46.2 | 150 | 5.0 | n.a. | |||
| GPK2-03-P42 (Sanjuan et al., 2006b) | 09/07/03 | n.a. | n.a. | 3.46 | n.a. | 32.6 | n.a. | 2.1 | n.a. | |||
| GPK2-05-P149 (Sanjuan et al., 2006b) | 22/11/05 | 22.9 | 2.59 | 6.10 | 106 | 49.3 | 157 | 2.3 | n.a. | |||
| GPK-3 | ||||||||||||
| GPK3-03-P8 (Sanjuan et al., 2004) | 18/03/03 | 27.2 | 2.70 | 6.21 | 100 | 54.6 | 163 | 6.9 | n.a. | |||
| GPK-4 | ||||||||||||
| GPK4-05-P212 (Sanjuan et al., 2006b) | 22/11/05 | 21.0 | 2.38 | 6.03 | 102 | 44.9 | 166 | 3.7 | n.a. | |||
| Most representative chemical and isotopic composition of the deep native geothermal brine | −0.4 | 5.2 | 13.0 | 27.5 | 3.25 | 6.90 | 125 | 59.0 | 59.0 | 5.0 (85 mg/l HCO3) | ||
| Fluid sample | Sampling date | DOC (mg/l) | SiO2 (mg/l) | NO3 (mg/l) | NO2 (mg/l)l | NH4 (mg/l) | PO4 (mg/l) | TDS (g/l) | Cl/Br (mass) | Br (mg/l) | B (mg/l) | F (mg/l) |
| GPK-1 | ||||||||||||
| GPK1-KS228 (Pauwels et al., 1993) | 1986–1991 | n.a. | 97 | n.a. | n.a. | n.a. | n.a. | 99 | 196 | 299 | 34.0 | 3.9 |
| GPK1-KD006 (Pauwels et al., 1993) | 1986–1991 | n.a. | 94 | n.a. | n.a. | n.a. | n.a. | 97 | 187 | 310 | 33.6 | n.a. |
| KP-3500 (Aquilina et al., 1997) | 1993 | n.a. | 210 | n.a. | n.a. | n.a. | n.a. | 101 | 270 | 226 | 29.0 | n.a. |
| GPK1-99-P1 (Sanjuan et al., 2001) | 02/03/99 | 18 | 98 | < 0.5 | < 0.01 | 24.2 | < 0.1 | 97 | 263 | 223 | 24.6 | 3.9 |
| GPK1-99-P2 (Sanjuan et al., 2001) | 08/04/99 | n.a. | 89 | < 0.5 | 0.02 | 25.2 | 0.5 | 96 | 253 | 229 | 24.7 | 3.8 |
| GPK1-99-P3 (Sanjuan et al., 2001) | 06/05/99 | n.a. | 81 | < 0.5 | < 0.01 | 23.8 | < 0.2 | 98 | 241 | 247 | 22.6 | 3.9 |
| GPK-2 | ||||||||||||
| KP3-97-16 (Vaute, 1998) | 25/07/97 | n.a. | 63 | n.a. | n.a. | n.a. | n.a. | 82 | 313 | 158 | n.a. | n.a. |
| KP3-97-122 (Vaute, 1998) | 25/08/97 | n.a. | 131 | n.a. | n.a. | n.a. | n.a. | 90 | 257 | 212 | n.a. | n.a. |
| KP3-97-296 (Vaute, 1998) | 25/09/97 | n.a. | 152 | n.a. | n.a. | n.a. | n.a. | 92 | 274 | 204 | n.a. | n.a. |
| KP3-97-435 (Vaute, 1998) | 25/10/97 | n.a. | 151 | n.a. | n.a. | n.a. | n.a. | 94 | 281 | 204 | n.a. | n.a. |
| KP3-97-600 (Vaute, 1998) | 16/11/97 | n.a. | 151 | n.a. | n.a. | n.a. | n.a. | 94 | 247 | 231 | 33.7 | n.a. |
| GPK2-99-S2 (Sanjuan et al., 2001) | 26/11/99 | n.a. | 409 | < 5 | < 0.01 | 21.1 | 2.0 | 95 | 248 | 233 | 27.5 | 4.6 |
| GPK2-99-S3 (Sanjuan et al., 2001) | 29/11/99 | 56 | 392 | < 5 | < 0.01 | 21.4 | 0.5 | 94 | 244 | 236 | 32.4 | 4.5 |
| GPK2-99-S4(Sanjuan et al., 2001; Sanjuan et al., 2004) | 03/12/99 | 58 | 364 | < 5 | < 0.01 | 20,0 | < 0.1 | 95 | 234 | 250 | 32.9 | 3.9 |
| GPK2-99-D1 (Sanjuan et al., 2001; Sanjuan et al., 2004) | 02/12/99 | n.a. | 175 | < 5 | 0.02 | 21.9 | < 0.1 | 98 | 265 | 223 | 36.0 | 4.7 |
| GPK2-99-D2 (Sanjuan et al., 2001) | 02/12/99 | n.a. | 130 | n.a. | n.a. | n.a. | n.a. | n.a. | n.a. | n.a. | n.a. | n.a. |
| GPK2-99-D3 (Sanjuan et al., 2001) | 02/12/99 | n.a. | 225 | n.a. | n.a. | n.a. | n.a. | n.a. | n.a. | n.a. | n.a. | n.a. |
| GPK2-02-P71 (Sanjuan et al., 2004) | 24/04/02 | n.a. | 262 | < 5 | 0.01 | 17.2 | 1.2 | 78 | 204 | 227 | 26.6 | 5.4 |
| GPK2-03-P42 (Sanjuan et al., 2006b) | 09/07/03 | n.a. | 212 | n.a. | n.a. | n.a. | n.a. | n.a. | n.a. | n.a. | n.a. | n.a. |
| GPK2-05-P149 (Sanjuan et al., 2006b) | 22/11/05 | n.a. | 255 | n.a. | n.a. | n.a. | n.a. | 82 | 225 | 219 | n.a. | n.a. |
| GPK-3 | ||||||||||||
| GPK3-03-P8 (Sanjuan et al., 2004) | 18/03/03 | n.a. | 216 | n.a. | n.a. | n.a. | n.a. | 92 | 270 | 202 | n.a. | n.a. |
| [0,1-18]GPK-4 | ||||||||||||
| GPK4-05-P212 (Sanjuan et al., 2006b) | 22/11/05 | n.a. | 231 | n.a. | n.a. | n.a. | n.a. | 75 | 229 | 196 | n.a. | n.a. |
| Most representative chemical composition of the deep native geothermal brine | 43 | 427 | < 0.5 | < 0.01 | 23.5 | < 0.1 | 97 | 268 | 220 | 35 | 4.5 | |
| Fluid sample | Sampling date | Sr (mg/l) | Li mg/l | Mn (mg/l) | Ba (mg/l) | Fe (mg/l) | Al (mg/l) | As (mg/l) | Rb (mg/l) | Cs (mg/l) | Ge (μg/l) | Be (μg/l) |
| GPK-1 | ||||||||||||
| GPK1-KS228 (Pauwels et al., 1993) | 1986-1991 | 480 | 123 | 18.1 | 12.3 | 232 | 0.044 | 0.6 | 25.1 | 15.7 | n.a. | n.a. |
| GPK1-KD006 (Pauwels et al., 1993) | 1986–1991 | n.a. | 126 | n.a. | 12.5 | 7.5 | n.a. | n.a. | 28.8 | 12.0 | n.a. | n.a. |
| KP-3500 (Aquilina et al., 1997) | 1993 | 490 | 147 | 15.4 | 12.0 | n.a. | 0.150 | 5.7 | 21.1 | 12.2 | n.a. | n.a. |
| GPK1-99-P1 (Sanjuan et al., 2001) | 02/03/99 | 420 | 122 | 16.8 | 14.0 | 50 | < 0.03 | 5.5 | n.a. | n.a. | n.a. | 26 |
| GPK1-99-P2 (Sanjuan et al., 2001) | 08/04/99 | 407 | 130 | 15.2 | 8.8 | 56 | < 0.03 | 4.5 | n.a. | n.a. | n.a. | 33 |
| GPK1-99-P3 (Sanjuan et al., 2001) | 06/05/99 | 410 | 115 | 14.7 | 13.7 | 35 | 0.054 | 5.9 | n.a. | n.a. | n.a. | 12 |
| GPK-2 | ||||||||||||
| KP3-97-16 (Vaute, 1998) | 25/07/97 | 377 | 139 | n.a. | n.a. | n.a. | n.a. | n.a. | n.a. | n.a. | n.a. | n.a. |
| KP3-97-122 (Vaute, 1998) | 25/08/97 | 417 | 163 | n.a. | n.a. | n.a. | n.a. | n.a. | n.a. | n.a. | n.a. | n.a. |
| KP3-97-296 (Vaute, 1998) | 25/09/97 | 436 | 158 | n.a. | n.a. | n.a. | n.a. | n.a. | n.a. | n.a. | n.a. | n.a. |
| KP3-97-435 (Vaute, 1998) | 25/10/97 | 447 | 169 | n.a. | n.a. | n.a. | n.a. | n.a. | n.a. | n.a. | n.a. | n.a. |
| KP3-97-600 (Vaute, 1998) | 16/11/97 | 460 | 151 | 14.8 | 2.9 | n.a. | < 0.03 | 11.0 | 22.7 | 14.0 | n.a. | n.a. |
| GPK2-99-S2 (Sanjuan et al., 2001) | 26/11/99 | 419 | 133 | 12.0 | 8.2 | 97 | < 0.03 | 8.3 | 21.2 | 13.7 | n.a. | < 5 |
| GPK2-99-S3 (Sanjuan et al., 2001) | 29/11/99 | 412 | 131 | 13.0 | 9.3 | 108 | 0.030 | 8.4 | 22.2 | 14.5 | n.a. | < 5 |
| GPK2-99-S4 (Sanjuan et al., 2001; Sanjuan et al., 2004) | 03/12/99 | 421 | 126 | 13.0 | 8.6 | 146 | < 0.03 | 8.5 | 21.3 | 13.1 | n.a. | < 5 |
| GPK2-99-D1 (Sanjuan et al., 2001; Sanjuan et al., 2004) | 02/12/99 | 400 | 125 | 15.4 | 8.2 | 96 | 0.031 | 6.5 | 23.1 | 14.4 | n.a. | < 20 |
| GPK2-99-D2 (Sanjuan et al., 2001) | 02/12/99 | n.a. | n.a. | n.a. | n.a. | n.a. | n.a. | n.a. | n.a. | n.a. | n.a. | n.a. |
| GPK2-99-D3 (Sanjuan et al., 2001) | 02/12/99 | n.a. | n.a. | n.a. | n.a. | n.a. | n.a. | n.a. | n.a. | n.a. | n.a. | n.a. |
| GPK2-02-P71 (Sanjuan et al., 2004) | 24/04/02 | 320 | 141 | 17.3 | 4.7 | 75 | < 1 | 4.2 | 18.1 | 20.7 | 53 | 50 |
| GPK2-03-P42 (Sanjuan et al., 2006b) | 09/07/03 | n.a. | n.a. | n.a. | n.a. | n.a. | n.a. | n.a. | n.a. | n.a. | n.a. | n.a. |
| GPK2-05-P149 (Sanjuan et al., 2006b) | 22/11/05 | n.a. | 130 | n.a. | n.a. | n.a. | n.a. | n.a. | n.a. | n.a. | n.a. | n.a. |
| GPK-3 | ||||||||||||
| GPK3-03-P8 (Sanjuan et al., 2004) | 18/03/03 | n.a. | 154 | n.a. | n.a. | n.a. | n.a. | n.a. | n.a. | n.a. | n.a. | n.a. |
| GPK-4 | ||||||||||||
| GPK4-05-P212 (Sanjuan et al., 2006b) | 22/11/05 | n.a. | 97 | n.a. | n.a. | n.a. | n.a. | n.a. | n.a. | n.a. | n.a. | n.a. |
| Most representative chemical composition of the deep native geothermal brine | 450 | 140 | 15 | 10 | 100 | 0.05 | 6 | 22 | 14 | 53 | 30 | |
| Fluid sample | Sampling date | Ni (μg/l) | Cu (μg/l) | Co (μg/l) | Cr (μg/l) | Cd (μg/l) | Zn (μg/l) | Ag (μg/l) | Ti (μg/l) | Pb (μg/l) | ||
| GPK-1 | ||||||||||||
| GPK1-KS228 (Pauwels et al., 1993) | 1986–1991 | 90 | 30 | 20 | 70 | 17 | 4000 | 4 | 320 | n.a. | ||
| GPK1-KD006 (Pauwels et al., 1993) | 1986–1991 | n.a. | n.a. | n.a. | n.a. | n.a. | n.a. | n.a. | n.a. | n.a. | ||
| KP-3500 (Aquilina et al., 1997) | 1993 | 110 | 30 | 30 | 60 | 14 | 5500 | 3 | 220 | n.a. | ||
| GPK1-99-P1 (Sanjuan et al., 2001) | 02/03/99 | 67 | 18 | 13 | 5 | 14 | 2360 | < 10 | n.a. | 782 | ||
| GPK1-99-P2 (Sanjuan et al., 2001) | 08/04/99 | 74 | 27 | 15 | 9 | 8 | 2060 | < 5 | n.a. | 181 | ||
| GPK1-99-P3 (Sanjuan et al., 2001) | 06/05/99 | 320 | 33 | 37 | < 15 | < 10 | 1030 | < 10 | n.a. | 210 | ||
| GPK-2 | ||||||||||||
| KP3-97-16 (Vaute, 1998) | 25/07/97 | n.a. | n.a. | n.a. | n.a. | n.a. | n.a. | n.a. | n.a. | n.a. | ||
| KP3-97-122 (Vaute, 1998) | 25/08/97 | n.a. | n.a. | n.a. | n.a. | n.a. | n.a. | n.a. | n.a. | 320 | ||
| KP3-97-296 (Vaute, 1998) | 25/09/97 | n.a. | n.a. | n.a. | n.a. | n.a. | n.a. | n.a. | n.a. | 320 | ||
| KP3-97-435 (Vaute, 1998) | 25/10/97 | n.a. | n.a. | n.a. | n.a. | n.a. | n.a. | n.a. | n.a. | 270 | ||
| KP3-97-600 (Vaute, 1998) | 16/11/97 | 176 | 17 | 36 | 43 | 10 | 3180 | < 5 | 193 | 289 | ||
| GPK2-99-S2 (Sanjuan et al., 2001) | 26/11/99 | 71 | 76 | 52 | < 10 | 4 | 3200 | < 5 | n.a. | 320 | ||
| GPK2-99-S3 (Sanjuan et al., 2001) | 29/11/99 | 80 | 68 | 59 | < 10 | 4 | 3300 | < 5 | n.a. | 320 | ||
| GPK2-99-S4 (Sanjuan et al., 2001; Sanjuan et al., 2004) | 03/12/99 | 100 | 60 | 48 | < 10 | 15 | 6000 | < 5 | n.a. | 270 | ||
| GPK2-99-D1 (Sanjuan et al., 2001; Sanjuan et al., 2004) | 02/12/99 | 205 | 260 | 60 | 18 | 28 | 3400 | < 20 | 181 | 307 | ||
| GPK2-99-D2 (Sanjuan et al., 2001) | 02/12/99 | n.a. | n.a. | n.a. | n.a. | n.a. | n.a. | n.a. | n.a. | n.a. | ||
| GPK2-99-D3 (Sanjuan et al., 2001) | 02/12/99 | n.a. | n.a. | n.a. | n.a. | n.a. | n.a. | n.a. | n.a. | n.a. | ||
| GPK2-02-P71 (Sanjuan et al., 2004) | 24/04/02 | < 100 | < 40 | < 40 | < 100 | < 40 | 1740 | < 100 | n.a. | < 100 | ||
| GPK2-03-P42 (Sanjuan et al., 2006b) | 09/07/03 | n.a. | n.a. | n.a. | n.a. | n.a. | n.a. | n.a. | n.a. | n.a. | ||
| GPK2-05-P149 (Sanjuan et al., 2006b) | 22/11/05 | n.a. | n.a. | n.a. | n.a. | n.a. | n.a. | n.a. | n.a. | n.a. | ||
| GPK-3 | ||||||||||||
| GPK3-03-P8 (Sanjuan et al., 2004) | 18/03/03 | n.a. | n.a. | n.a. | n.a. | n.a. | n.a. | n.a. | n.a. | n.a. | ||
| GPK-4 | ||||||||||||
| GPK4-05-P212 (Sanjuan et al., 2006b) | 22/11/05 | n.a. | n.a. | n.a. | n.a. | n.a. | n.a. | n.a. | n.a. | n.a. | ||
| Most representative chemical composition of the deep native geothermal brine | 100 | 45 | 50 | 40 | 10 | 3000 | < 5 | 200 | 300 |
Even though the fluid salinities (TDS close to 100 g/l), the chemical and isotopic compositions are similar, some discrepancies are observed between the fluids produced at different depths. Most of these discrepancies was revealed and discussed (Aquilina et al., 1997). Among the main discrepancies, the variations of some trace elements, of the dissolved silica, of the δ18O and δ34S values of dissolved sulphate and of strontium isotopic measurements were interpreted as resulting from a higher degree of water–rock interaction for the fluid sample collected at a depth of about 3500 m. Another difference was the Dissolved Organic Carbon (DOC) content (44 ppm at 1815 m, and below the detection limit at 3500 m). The presence of dissolved organic matter at 1815 m is probably related to the sedimentary Buntsandstein formation, close to the Pechelbronn oil field (Aquilina et al., 1997). Moreover, organic matter composed of 41% alkylbenzenes, 37% aliphatic acids, 19% n-alkanes and 3% aromatic acids was detected in granite cores collected from GPK-1 at depths between 2158 and 2160 m, in a highly fractured and altered zone (Ledésert et al., 1996). It was concluded that the 1815 and 3500 m fluids did not belong to the same circulation pathway (Aquilina et al., 1997). This conclusion is questionable because several of these differences (variations of some trace elements, dissolved silica, δ18O and δ34S values of dissolved sulphate, etc.) can also be explained by dissolution or precipitation processes occurring during a movement of the 3500 m fluid from the bottom to the top and its cooling. Moreover, all the fluids have similar salinity values and major constituent concentrations. As we will see it, the question of the presence or absence of natural organic matter in the fluids requires more detailed investigations.
Several hydraulic stimulation tests and injections of fresh water into GPK-1 and GPK-2 were conducted between 1993 and 1996. So, a total volume of 85,000 m3 of fresh water had been injected in 1995 and 1996 (Vaute, 1998). The geochemical fluid monitoring carried out during the 1997 circulation test suggested that, at the end of this test, the proportions of injected fresh water present in the fluid discharged from GPK-2 were low (close to 5%). For this fluid (KP3 samples in Table 1), chemical compositions similar to that of the fluid produced by GPK-1 at a depth of 3500 m were found. Only the concentrations of dissolved K, and SO4 were higher; the alkalinity markedly lower.
Three wellhead fluid samples were also collected from GPK-1 in 1999 by BRGM, after the fluid circulation test carried out in 1997 between GPK-1 and GPK-2. According to the analytical results (Table 1), small amounts of residual injected fresh water (< 5%) are probably still mixed with the native geothermal brine, but these results are close to those obtained in (Aquilina et al., 1997). As for GPK-2, the concentrations of dissolved K and SO4 are higher and the alkalinity is markedly lower. The concentrations of some trace elements (Al, Zn, Cr) are also lower. Unlike in (Aquilina et al., 1997), DOC was detected at a concentration of 18 mg/l but could not be characterized.
2.1.2 Fluid samples collected from GPK-2, GPK-3 and GPK-4 at greater depths than 3600 m after October 1999
Unlike to well GPK-1, it was not possible to collect and analyze a sample of deep geothermal brine discharged from wells GPK-2, GPK-3 and GPK-4 without any perturbation, after October 1999. During or just after the drilling of these wells, fluid samples were contaminated by drilling fluids. During production, tests carried out after hydraulic stimulation operations during which large volumes of fresh water were injected, the fluid samples constituted a mixture of geothermal brine and injected fresh water (Sanjuan et al., 2001; Sanjuan et al., 2004; Sanjuan et al., 2006a; Sanjuan et al., 2006b).
The last samples collected during geochemical monitoring of the fluid discharged from GPK-2, carried out in 1999 after the deepening of this well from 3900 to about 5000 m (GPK2-99 samples in Table 1), showed chemical and isotopic compositions close to those of the fluid discharged from GPK-1, at a depth of 3500 m (Aquilina et al., 1997). These results suggested that the amounts of residual injected fresh water present in the fluid discharged from GPK-2 at depths of 4500–5000 m were very small (< 5%) and that there was relatively direct hydraulic connection between the fractured and permeable areas located at 3500–3600 m and 4500–5000 m. The highest concentrations of dissolved silica were found in these samples. DOC was also detected (56–58 mg/l; Table 1) but could not be characterized. Its presence could be due to contamination by drilling fluids or grease.
Few fluid samples could be collected from GPK-3 and GPK-4 (Table 1) (Sanjuan et al., 2004; Sanjuan et al., 2006a; Sanjuan et al., 2006b).
2.1.3 Representative chemical and isotopic composition of the deep native geothermal brine
With the exception of the analytical data for the fluid discharged from GPK-1 at depths of 1800–1900 m, which indicate some stronger discrepancies, the results (Table 1) have been used to accurately elucidate the chemical and isotopic composition of the deep native geothermal brine, which was intersected by wells GPK-2, GPK-3 and GPK-4.
The most representative value for the Cl concentration in the deep native geothermal brine was considered to be 59 ± 2 g/l. A statistical treatment taking into account the dilution factors for injected fresh waters and discarding probable contamination allowed the determination of the most representative concentrations of the dissolved major constituents Na, K, Ca, Mg, SO4 and some trace constituents such as Br, B, NH4, Li and Sr in the deep native geothermal brine (Sanjuan et al., 2006b) (Table 1). Relative uncertainty was estimated at 5–10% for major constituents and 10–15% for trace constituents.
For other trace constituents (F, Ba, Ti, As, Rb, Cs, Fe, Ni, Cu, Co, Cr, Cd, Zn, Ag and Pb), which indicate relatively unstable concentrations, representative values are proposed in Table 1. They are often close to those analyzed in fluid sample GPK2-99-D1, collected from GPK-2 at a depth of 650 m in December 1999. For these constituents, it is obvious that additional analysis of samples of unperturbed deep geothermal brine would be very useful.
The values for pH, partial CO2 pressure and dissolved Al and SiO2 concentrations, were determined using the reconstructed chemical composition of the geothermal brine (Table 1) and the EQ3NR geochemical modeling code (Wolery, 1995). This code used the thermodynamic data0.com.R2 database and the B-dot equation, an extended Debye-Hückel equation, to take into account the salinity effect. The pressure effect, which is negligible in this case, was not considered. The reservoir temperature was set to 230–240 °C (see Section 4). The pH was calculated assuming its control by an equilibrium reaction between the geothermal brine and calcite. The CO2 fugacity was determined using the concentration of dissolved HCO3, which was estimated at about 85 mg/l from the analytical alkalinity and DOC values (Table 1). A SiO2 concentration of 427 mg/l was selected in order to be close to the concentration value controlled by the equilibrium reaction between the geothermal brine and quartz, which is also close to the maximum values analyzed in the fluid discharged from GPK-2 in 1999. Generally, cooling of hot fluid during its rise can cause silicate mineral precipitation (amorphous silica, for example). The risk of silica precipitation is increased when rise of the fluid is slow. This probably explains why the concentrations of dissolved SiO2 are relatively low in most of the fluids, especially those collected from GPK-1 at depths of 1800–1900 m (Table 1). The concentration of dissolved Al was calculated assuming that it was controlled by the equilibrium between the geothermal brine and K-feldspar (see results obtained using the Na/K geothermometer and geochemical modelling in section 4 for the validity of this assumption).
The results obtained using the EQ3NR code are reported in Table 1. CO2 pressure and pH values close to 6 bar and 5.0 were found, respectively. An approximate value of CO2 fugacity of 1.7–2 bar in the reservoir was evaluated using the K-Ca geobarometer (Giggenbach, 1988). Taking into account the fugacity coefficient for CO2 at 500 bar and 240 °C (0.84) (Duan et al., 1992), the CO2 partial pressure is estimated to be around 2–2.4 bar. The estimated pH value ranges from that directly measured (4.79) in the line at 60 °C in 1997 (Vaute, 1998) to those determined on site at 20–30 °C (5.1–5.5; Table 1). If alkalinity is considered as only due to bicarbonate ions, unrealistically high CO2 fugacity values are obtained by geochemical modeling with a pH value of 5.0. In this context, the alkalinity value determined for the fluid collected from GPK-1 at a depth of 3500 m without detection of DOC (Aquilina et al., 1997) seems to be too high. Another explanation could be that the pH value of the reservoir fluid is lower than 5.0 (close to 4.3). The DOC values analyzed in the fluid samples collected from GPK-1 and GPK-2 in 1999 suggest that alkalinity is also due to dissolved organic compounds (natural organic compounds, residual compounds of drilling mud?). Additional analysis is necessary to better identify and quantify the alkalinity constituents and find out whether natural organic species are dissolved in the deep geothermal brine. The concentration of dissolved Al was calculated as 52 μg/l at 230 °C and 93 μg/l at 240 °C. These values are relatively close to those analyzed in the fluid discharged from GPK-2 in 1999 (30 and 54 μg/l). A value of 50 μg/l was selected (Table 1).
The isotopic values obtained for the fluids collected in 1999 were close to those determined in 1993 and in 2002, and considered to be representative of the native reservoir brine (Table 1).
2.2 Chemical composition of the non-condensable gases associated with the deep geothermal brine
Only three gas samples were collected at the wellheads of GPK-2 and GPK-4 by BRGM during the five month fluid circulation test carried out in 2005. These gases were analyzed by gas chromatography. Analytical uncertainty is about 5%. Results are reported in Table 2 where other analytical data previously obtained from the wells GPK-1 and GPK-2 are also presented (Pauwels et al., 1993; Aquilina et al., 1997; Naumann et al., 1999; Naumann et al., 2000; Sanjuan et al., 2001).
Compositions chimiques des gaz profonds provenant des puits GPK-1 (Pauwels et al., 1993; Aquilina et al., 1997), GPK-2 et GPK-4 (Sanjuan et al., 2001; Naumann et al., 2000; Sanjuan et al., 2006a).
| Well | Date | Depth (m) | Laboratory | GLR (% vol.) | CO2 (% vol.) | O2 (% vol.) | N2 (% vol.) | Ar (% vol). | He (% vol.) | ||
| GPK-1 | |||||||||||
| GPK1 KS228 (Pauwels et al., 1993) | 1986–1991 | Wellhead | BRGM | 20.0 | 46.3 | 0 | 27.3 | n.a. | 1.0 | ||
| GPK1 KD006 (Pauwels et al., 1993) | 1986–1991 | 1845 | BRGM | n.a. | 67.1 | 0 | 27.4 | n.a. | n.a. | ||
| GPK1 KD007 (Pauwels et al., 1993) | 1986–1991 | 1930 | BRGM | n.a. | 54.3 | 0 | 37.0 | n.a. | n.a. | ||
| GPK1 KP3500 (Aquilina et al., 1997) | 1993 | 3470 | BRGM | 16.7 | 79.0 | 0 | 11.0 | 0.074 | 0.45 | ||
| GPK-2 | |||||||||||
| GPK2-99-S1 (Sanjuan et al., 2001) | 04/11/99 | Wellhead | BRGM | 13.2 | 14.2 | 0.48 | 29.9 | 0.23 | 1.0 | ||
| GPK2-99-D1 (Sanjuan et al., 2001) | 02/12/99 | 650 | IFP | 2.6 | 15.8 | 0 | 48.6 | 0 | 2.2 | ||
| GPK2-99-D3 (Sanjuan et al., 2001) | 02/12/99 | 700 | IFP | 17.8 | 37.2 | 0 | 37.2 | 0 | n.a. | ||
| GPK2-99-CM1 (Naumann et al., 2000) | Continuous monitoring 1999 | Surface (from gas separator and casing gas tube) | GFZ | 17–29 | 59–64 | 0 | 24–30 | 0.1–0.2 | 0.5–0.8 | ||
| GPK2-99-CM2 (Naumann et al., 2000) | Nov. 25th to 29th, 1999 | Surface (from gas separator) | GFZ | 29.0 | 62.0 | 0 | 27.0 | 0.15 | 0.65 | ||
| GPK2-99-DG (Naumann et al., 2000) | 24/11/99 | Inlet of the gas separator and complete degassing in lab | GFZ | 38.0 | 89.7 | 0 | 7.2 | 0.17 | 0.13 | ||
| GPK2-05-G1 (Sanjuan et al., 2006a) | 19/10/05 | Wellhead | BRGM | n.a. | 56.6 | 0.05 | 34.3 | 0.17 | 1.98 | ||
| GPK2-05-G2 (Sanjuan et al., 2006a) | 19/10/05 | Wellhead | BRGM | n.a. | 56.4 | 0.04 | 35.5 | 0.14 | 1.93 | ||
| GPK-4 | |||||||||||
| GPK4-05-G1 (Sanjuan et al., 2006a) | 19/10/05 | Wellhead | BRGM | n.a. | 61.2 | 0.05 | 30.8 | 0.18 | 1.66 | ||
| Well | Date | Depth (m) | Laboratory | H2 (% vol.) | He+H2 (% vol.) | CH4 (% vol.) | C2H6 (% vol.) | C3H8 (% vol.) | H2S (% vol.) | N2/Ar (% vol.) | He/Ar (% vol.) |
| GPK-1 | |||||||||||
| GPK1 KS228 (Pauwels et al., 1993) | 1986–1991 | Wellhead | BRGM | 20.1 | n.a. | 4.8 | n.a. | n.a. | n.a. | n.a. | n.a. |
| GPK1 KD006 (Pauwels et al., 1993) | 1986–1991 | 1845 | BRGM | 0.61 | n.a. | 4.2 | n.a. | n.a. | n.a. | n.a. | n.a. |
| GPK1 KD007 (Pauwels et al., 1993) | 1986–1991 | 1930 | BRGM | 0.25 | n.a. | 6.1 | n.a. | n.a. | n.a. | n.a. | n.a. |
| GPK1 KP3500 (Aquilina et al., 1997) | 1993 | 3470 | BRGM | 7.2 | n.a. | 3.4 | 0.03 | 0.0011 | n.a. | 149 | 6.1 |
| GPK-2 | |||||||||||
| GPK2-99-S1 (Sanjuan et al., 2001) | 04/11/99 | Wellhead | BRGM | 46.3 | n.a. | 6.8 | 0.12 | 0.018 | < 0.005 | 130 | 4.4 |
| GPK2-99-D1 (Sanjuan et al., 2001) | 02/12/99 | 650 | IFP | 26.5 | 28.7 | 7.0 | 0 | 0 | n.a. | n.a. | n.a. |
| GPK2-99-D3 (Sanjuan et al., 2001) | 02/12/99 | 700 | IFP | n.a. | 19.2 | 6.5 | 0 | 0 | n.a. | n.a. | n.a. |
| GPK2-99-CM1 (Naumann et al., 2000) | Continuous monitoring 1999 | Surface (from gas separator and casing gas tube) | GFZ | 5–7 | n.a. | 4–6 | n.a. | n.a. | n.a. | 120–300 | 2–8 |
| GPK2-99-CM2 (Naumann et al., 2000) | Nov. 25th to 29th, 1999 | Surface (from gas separator) | GFZ | 6.0 | n.a. | 5.0 | n.a. | n.a. | n.a. | 180 | 4.3 |
| GPK2-99-DG (Naumann et al., 2000) | 24/11/99 | Inlet of the gas separator and complete degassing in lab | GFZ | 1.7 | n.a. | 1.2 | n.a. | n.a. | n.a. | 42 | 0.8 |
| GPK2-05-G1 (Sanjuan et al., 2006a) | 19/10/05 | Wellhead | BRGM | 1.9 | n.a. | 6.3 | 0.06 | 0.003 | < 0.005 | 202 | 11.6 |
| GPK2-05-G2 (Sanjuan et al., 2006a) | 19/10/05 | Wellhead | BRGM | 1.9 | n.a. | 6.2 | 0.06 | 0.003 | < 0.005 | 254 | 13.8 |
| GPK-4 | |||||||||||
| GPK4-05-G1 (Sanjuan et al., 2006a) | 19/10/05 | Wellhead | BRGM | 2.8 | n.a. | 5.8 | 0.06 | 0.003 | < 0.005 | 171 | 9.2 |
These analytical results are relatively heterogeneous. The discrepancies are probably due to the different techniques used for sampling, to the different sampling locations and to the different flow rate values. They have been discussed in (Sanjuan et al., 2001; Sanjuan et al., 2006a). When sampling conditions are similar, analytical results are closer to each other. So, except for H2 content, the chemical composition of gases collected from GPK-2 and GPK-4 in 2005 is similar to that obtained in 1999 from continuous gas monitoring carried out in GPK-2, from the gas separator (degasser) and casing gas tube (Table 2) (Naumann et al., 2000). Although additional gas analyses will have to be performed and tested, these gas analyses will be considered as the most representative for non-condensable gases associated to the deep geothermal brine, for the moment. CO2 is the predominant gas. The partial pressure of this gas in the reservoir was estimated to be close to 6 bar in the previous section. δ13C value will have to be determined in future work to reveal its origin. No trace of H2S was found in the gases.
3 Fluid origin
The high salinity values of the fluid samples and their chemical and isotopic compositions indicate a common sedimentary origin for the deep native geothermal brine. The relationships of δD values for the water with concentrations of Cl and Br (Table 1) suggest the following scheme to explain the brine origin (Pauwels et al., 1993):
- - formation of a primary brine by advanced evaporation of sea water up to, at least, halite precipitation; so observed Cl/Br ratios, lower than that of sea water (≈ 300), can be explained, but the degree of the evaporation cannot be determined;
- - migration of this primary brine and mixing with more dilute fluids;
- - dissolution of halite to increase the Cl/Br ratios and reach the analysed values.
The most probable reservoir is the Triassic Buntsandstein formation. We will see, in the next section, that the deep native geothermal brine has interacted at 230–240 °C with rocks of this sedimentary reservoir, probably located in the Graben centre (where it is deepest and hottest), before migrating towards the Soultz granite through a complex network of deep faults still poorly defined.
In order to explain the chemical composition of the geothermal brine sample collected at 1800–1900 m depths in GPK-1 (Table 1), marine evaporite minerals such as anhydrite or barite are assumed to dissolve during rise and cooling of the geothermal brine present at depths of 3500 m (Pauwels et al., 1993) or 4500–5000 m. This assumption is based upon the following observations:
- - the concentrations of dissolved SO4, Br and Ba tend to increase with decreasing well depth and temperature (Table 1);
- - the δ34S values for the dissolved sulphate move away from 20 (marine value) and become closer to 0 (magmatic sulphur) with increasing depth and temperature (Table 1);
- - a similar trend is found for the δ18O values for dissolved SO4 (Table 1).
4 Reservoir fluid temperature and processes of water–rock–gas interaction
4.1 Reservoir fluid temperature
From the most representative chemical composition of the native reservoir brine (Table 1), temperature values of 220–240 °C are estimated in the deep reservoir using classical chemical geothermometers (Nicholson, 1993) (Table 3). Except for the silica geothermometer, these estimates are similar to those previously obtained for all the fluids collected from GPK-1 and GPK-2 (Pauwels et al., 1993; Aquilina et al., 1997; Sanjuan et al., 2001) (Table 3).
Géothermomètres chimiques et isotopiques (Nicholson, 1993; Giggenbach, 1988; Fouillac and Michard, 1981; Kharaka et al., 1982; Kharaka and Mariner, 1989; Michard, 1990) appliqués à des échantillons de saumure géothermale profonde de Soultz (3500–5000 m) et à la composition la plus représentative de cette saumure (les nombres en italique représentent des valeurs de température concordantes).
| Brine sample | GPK1-99-P1 (02/03/99) | GPK2-99-S3 (29/11/99) | GPK2-99-S4 (03/12/99) | GPK2-99-D1 (02/12/99) | Representative deep Soultz geothermal brine |
| Geothermometers | T °C | T °C | T °C | T °C | T °C |
| TQuartz (Fournier and Rowe, 1966) | 136 | 231 | 225 | 239 | 239 |
| TNa-K (Michard, 1979) | 218 | 209 | 206 | 229 | 218 |
| TNa-K (Fournier, 1979) | 233 | 225 | 224 | 242 | 233 |
| TNa-K-Ca (b = 1/3; Fournier and Truesdell, 1973) | 237 | 230 | 228 | 243 | 235 |
| TMg correction (Fournier and Potter, 1979) | 225 | 224 | 223 | 236 | 226 |
| TK-Mg (Giggenbach, 1988) | 211 | 219 | 218 | 224 | 213 |
| TNa-Li (Cl > 0.3 M; Fouillac and Michard, 1981) | 431 | 451 | 442 | 434 | 458 |
| TNa-Li (Cl < 0.3 M; Fouillac and Michard, 1981) | 180 | 190 | 186 | 181 | 193 |
| TNa-Li (Kharaka et al., 1982) | 232 | 240 | 237 | 233 | 242 |
| TMg-Li (Kharaka and Mariner, 1989) | 221 | 239 | 237 | 230 | 230 |
| TSr-K (Michard, 1990) | 301 | 288 | 285 | 316 | 295 |
| TRb-Na (Michard, 1990) | - | 140 | 139 | 140 | 139 |
| TCs-Na (Michard, 1990) | - | 128 | 126 | 127 | 127 |
| TFe-K (Michard, 1990) | 279 | 229 | 214 | 255 | 242 |
| TMn-K (Michard, 1990) | 186 | 186 | 185 | 195 | 189 |
| T18O(H2O-SO4) (Mizutani and Rafter, 1969) | - | 215 | 213 | 199 | 209 |
| Measured temperature at the bottom hole | 165 | 200 | 200 | 200 | 200 |
The reservoir fluid temperature estimated using the δ18O-δ18O (SO4) geothermometer (Mizutani and Rafter, 1969) is close to 210 °C. This geothermometer yields a more concordant value than in the study carried out on the fluids collected from GPK-1 at depths of 1800–1900 m (Pauwels et al., 1993). This result is in good agreement with the assumption about the dissolution of marine sulphate minerals, during rise and cooling of the deep geothermal brine, which increases the δ18O values of the dissolved sulphates.
Gas geothermometers such as CO2/H2/CH4 (Marini, 1987), CO2/Ar and CO2/CH4 (Giggenbach, 1991) and H2/Ar (Giggenbach and Goguel, 1989) applied to the gas analyses of the samples collected from GPK-2 and GPK-4 in 2005 yield temperature values ranging from 193 to 259 °C (Table 4). Similar values for temperature are found for the gases continuously analysed in GPK-2 from the gas separator and the casing gas tube (Naumann et al., 2000). These values are in good agreement with those found using chemical cation geothermometers.
Géothermomètres à gaz (Marini, 1987; Giggenbach, 1991; Giggenbach and Goguel, 1989) appliqués à des échantillons de gaz incondensables associés à la saumure géothermale profonde de Soultz (3500–5000 m; les nombres en italique représentent des valeurs de température concordantes).
| Gas sample | GPK1 KP3500 | GPK2-99-CM2 (Nov. 1999) | GPK2-99-DG (24/11/99) | GPK2-05-G1 (19/10/05) | GPK4-05-G1 (19/10/05) |
| Gas geothermometers | T °C | T °C | T °C | T °C | T °C |
| TCO2/H2/CH4 (Marini, 1987) | 240 | 226 | 230 | 193 | 203 |
| TCH4/CO2 (Giggenbach, 1991) | 239 | 224 | 269 | 217 | 220 |
| TH2/Ar (Giggenbach and Goguel, 1989) | 314 | 287 | 245 | 248 | 259 |
| TCO2/Ar (Giggenbach, 1991) | 236 | 215 | 220 | 210 | 210 |
| Measured temperature at the bottom hole | 165 | 200 | 200 | 200 | 200 |
4.2 Processes of water–rock–gas interaction
The concordant temperature values obtained by chemical geothermometers, which are slightly higher than the bottom-hole temperature measured in wells GPK-2, GPK-3 and GPK-4 (close to 200 °C), suggest the existence of chemical equilibrium reactions between the deep native reservoir brine and a mineralogical assemblage at 220–240 °C. In order to determine the constituents of this mineralogical assemblage, calculations of saturation indices for minerals were performed using the EQ3NR geochemical code (Wolery, 1995) and the most representative chemical composition of the deep native brine (Table 1). These calculations indicate that the deep native geothermal brine is close to an equilibrium at 230–240 °C with respect to quartz, albite, K-feldspar, calcite, dolomite, CaSO4:0.5H2O (β), fluorite, muscovite (illite) and smectites (smectite, montmorillonites). Most of these minerals have already been observed in a hydrothermal alteration sequence in the Soultz granite (Ledésert et al., 1999). As sulphides have never been detected in solution or in the gases, they were not considered in the calculations.
The concordant values of temperature between the gas and solute geothermometers indicate that CO2, CH4, H2 and Ar are near equilibrium with the deep native geothermal brine at a temperature of 220–240 °C.
The good results obtained using Na/Li (Kharaka et al., 1982) and Mg/Li (Kharaka and Mariner, 1989) geothermometers (Fig. 3; Table 3), especially developed for sedimentary basin waters, and the poor temperature results obtained using Na/Li (Fouillac and Michard, 1981), Sr/K, Na/Cs and Na/Rb (Michard, 1990) geothermometers, all developed for volcanic and granitic areas, suggest that most of the equilibrium reactions at 230–240 °C occur in a sedimentary rather than a granite reservoir.
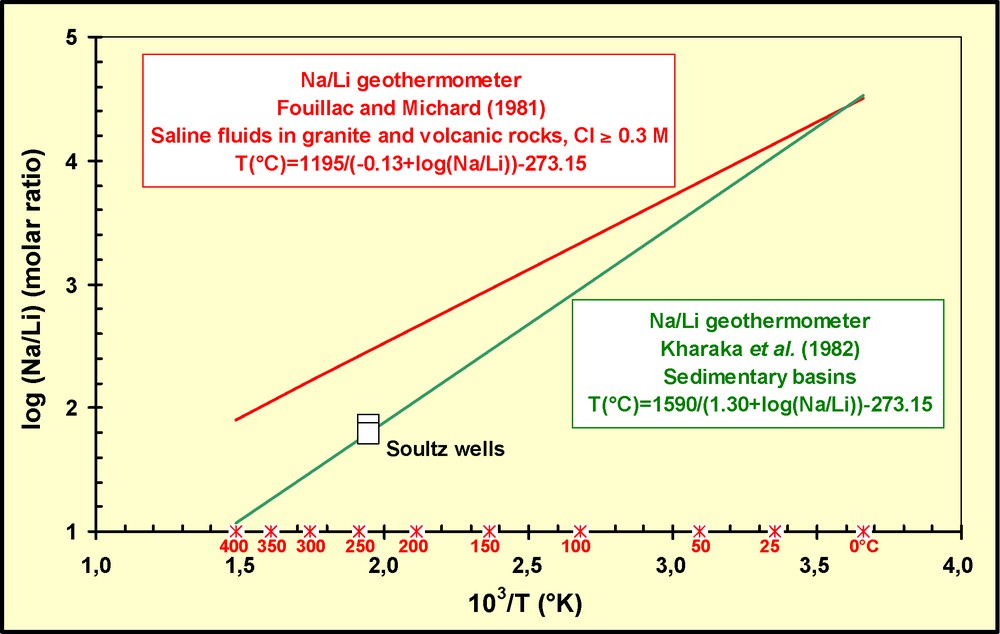
Known Na/Li geothermometer relationships for sedimentary and granite or volcanic reservoirs. The analytical results suggest that the deep Soultz geothermal brine is equilibrated at 230–240 °C with sedimentary rather than granite rocks.
Relations géothermométriques Na/Li existant dans la littérature pour les réservoirs sédimentaires et volcaniques ou granitiques. Les résultats analytiques suggèrent que la saumure géothermale profonde de Soultz est équilibrée à 230–240 °C avec des roches sédimentaires plutôt que granitiques.
Moreover, according to the experimental and literature data obtained for the lithium isotopic fractionation at 230 °C (Chan et al., 1994; James et al., 1999; Millot et al., 2009), the δ7Li value estimated for the rock in equilibrium with the deep native geothermal brine (see Table 1 for analysed δ7Li values) would be lower than –6‰. This value is not characteristic of granites (δ7Li ranges from 0 to 10‰) but would rather correspond to that of carbonated sediments (Coplen et al., 2002).
Given the location of the Soultz site and these constraints, the main reservoir could be situated further east, towards the Graben centre where the Triassic Buntsandstein sedimentary formation is deepest and hottest (Fig. 4). In this area, thermal gradient values ranging from 50 to 60 °C/km were determined in, at least, eight deep wells (Vernoux and Lambert, 1993). According to these values, it is possible for the Triassic formation to reach temperatures close to 200–240 °C (corresponding to a depth of about 4000 m). After that, the geothermal brine would migrate from the Graben centre to its external borders (Soultz), in the granite, through a complex system of deep faults still poorly defined.

Schematic NW-SE cross-section (from (Le Carlier et al., 1994)) and location of the three fractured zone clusters in the Soultz wells represented with an average orientation. In the Graben centre, eight deep wells are reported (HZL1, SCH3, FO1, RN1, RO1, BE1, BB1 and BB2; up to a depth of about 2500 m) where thermal gradient values ranging from 50 to 60 °C/km were observed (Vernoux and Lambert, 1993). According to these values, the Triassic Buntsandstein formation can reach temperatures close to 200–240 °C in the Graben centre (corresponding to a depth of about 4 km) and is probably the reservoir in which the deep Soultz geothermal brine originates and has equilibrated with sedimentary rocks at 230–240 °C. After that, this brine probably migrates from the Graben centre to its external borders (Soultz), in the granite, through a complex system of deep faults still poorly defined. Its natural convective flux was estimated at 1.0–1.2 m3/h. At the Soultz site, it would move from bottom (3500–5000 m) to top, explaining the observed surface thermal anomaly. Some dissolution or precipitation processes would occur during its rising and cooling.
Coupe schématique NW-SE (basée sur les travaux de (Le Carlier et al., 1994)) et localisation des trois clusters de zones fracturées dans les puits de Soultz représentés avec une orientation moyenne. Dans le centre du graben, sont reportés huit puits profonds (HZL1, SCH3, FO1, RN1, RO1, BE1, BB1 and BB2; jusqu’à une profondeur de 2500 m) où des valeurs de gradient thermique de 50 à 60 °C/km ont été mesurées (Vernoux and Lambert, 1993). D’après ces valeurs, la formation triasique du Buntstandstein peut atteindre des températures proches à 200–240 °C dans le centre du graben (correspondant à une profondeur d’environ 4 km) et est probablement le réservoir d’origine de la saumure géothermale profonde de Soultz, dans lequel elle s’équilibre avec des roches sédimentaires à 230–240 °C. Cette saumure migrerait, ensuite, du centre du graben vers ses bordures externes, dans le granite, à travers un système complexe de failles profondes encore mal défini. Son flux naturel convectif a été estimé à 1,0–1,2 m3/h. Sur le site de Soultz, elle se déplacerait du fond (3500–5000 m) vers la surface, ce qui explique l’anomalie thermique superficielle observée. Quelques processus de précipitation ou de dissolution auraient lieu pendant sa remontée et son refroidissement.
5 Estimation of the natural convective flux of the deep native geothermal brine
A natural flux value of 1–1.2 m3/h was estimated for the deep native geothermal brine (Sanjuan et al., 2004; Sanjuan et al., 2006a; Sanjuan et al., 2006b), during a tracer test and geochemical fluid monitoring associated with four short-term production tests carried out in GPK-2 between December 2000 and April 2004, after a hydraulic stimulation operation conducted in this well in July 2000 (injection of 27,800 m3 of fresh water). Despite the small amount of fluid discharged from GPK-2 (about 4600 m3) and the poor recovery of fresh water injected in July 2000 (less than 7%), the latter was progressively replaced by the geothermal brine (about 80% at the end of the production tests).
Taking into account the conclusions about the regional redistribution of heat by convection due to fluid flow in the upper crust (Pribnow and Schellschmidt, 2000), the interpretation of the thermal gradient of GPK-2 (Kohl et al., 2002) and the temperature at depth according to chemical geothermometers (about 230–240 °C), the value of 1–1.2 m3/h may be also applied to the natural flux of fluid convection. This value is identical to that calculated for the graben-parallel fluid flux at the Soultz site, using numerical 3D modelling (Bächler, 2003).
Although the total volume of the fluids injected into the wells is greater than that of the discharged fluids, most of the tracer tests conducted between 2000 and 2005 showed that small amounts of injected fresh water were recovered through discharged fluids and the contribution of deep native reservoir brine was always large, even after significant fresh water injection. It was estimated that the fresh water injected into the wells since 2000 had mixed with a volume greater than 750,000 m3 of deep native reservoir brine (Sanjuan et al., 2004; Sanjuan et al., 2006a).
Comparable hydraulic connections between GPK-1 and GPK-2, at depths of 3500–3900 m, and GPK-3 and GPK-2, at depths of 4500–5000 m, probably interconnected themselves, can explain the similarity of the results (maximum and mean apparent fluid velocities, tracer recovery, etc.) obtained during the fluid circulation tests carried out in 1997, 2003 and 2005 (Vaute, 1998; Aquilina et al., 2004; Sanjuan et al., 2004; Sanjuan et al., 2006b) and the relative homogeneity of the chemical and isotopic compositions of the deep native geothermal brine at depths ranging from 3500 to 5000 m.
The deep native geothermal brine is omnipresent in the heat exchanger for which the characteristics of fluid circulation deduced from the tracer tests carried out between 2000 and 2005 are presented and detailed in (Sanjuan et al., 2004; Sanjuan et al., 2006b).
6 Conclusions
Several production or circulation tests were conducted between 1999 and 2005, after the GPK-2 deepening, the GPK-3 and GPK-4 drilling and the hydraulic stimulation tests carried out in these wells. The geochemical fluid monitoring performed during these production tests has made available new data on the chemical and isotopic composition of the native geothermal brine and associated non-condensable gases present at depths ranging from 3500 to 5000 m. It has also led to a better knowledge of the characteristics of this geothermal brine in terms of origin and fluid circulation.
Reconstructed chemical and isotopic data for this brine and associated gases are proposed in this study. Even if additional analysis for several trace elements in samples of uncontaminated deep native geothermal brine are necessary, these data will be very useful to prevent and solve the scaling and corrosion problems expected during the running of the heat exchanger. Additional investigations will have to be performed in order to better identify and quantify the dissolved compounds which constitute the alkalinity and validate the estimation of dissolved bicarbonate concentration, pH value and CO2 pressure in the reservoir.
The high salinity values and the chemical and isotopic compositions of the fluid samples indicate a common sedimentary origin for the deep native geothermal brine. The temperature values estimated using most of the geothermometers and δ7Li values suggest that this brine is in equilibrium with a mineralogical assemblage at a temperature close to 230–240 °C in a sedimentary rather than a granite reservoir. Given the Soultz location and these constraints, the latter would be situated close to the Graben centre where the Triassic Buntsandstein formation is deepest and hottest (temperature values of 200–240 °C can be attained at a depth of about 4000 m, in this area). After that, the geothermal brine would migrate from the Graben centre to its external borders (Soultz), in the granite, through a complex system of deep faults still poorly defined. In the Soultz area, the relatively homogeneous composition of numerous dissolved major, trace constituents and isotopes in the fluid samples associated with the variations observed for dissolved silica, sulphate, barium and bromide concentrations and the δ18O and δ34S values for dissolved sulphate with decreasing depth suggest a fluid movement from bottom (3500–5000 m) to top. This movement would be compatible with a more general scheme taking into account a convective circulation of the geothermal brine, which explains the surface thermal anomaly observed in this area. The presence or the absence of natural organic matter in the deep fluids must be better studied and elucidated in order to better understand their circulation.
The present fluid-flow data obtained from tracer tests conducted between 2000 and 2005 highlight the omnipresence of the deep native geothermal brine in the heat exchanger for which a natural convective flux was estimated at 1–1.2 m3/h. Similar hydraulic connections seem to exist between GPK-1 and GPK-2, at depths of 3500–3900 m, and between GPK-3 and GPK-2, at depths of 4500–5000 m. They are probably interconnected themselves, which can explain the relative homogeneity of the chemical and isotopic composition of the native geothermal brine at depths ranging from 3500 to 5000 m.
Acknowledgments
This study was funded by the European Community and the BRGM Research Division in the framework of the research work accompanying the construction of the Scientific Pilot Plant of the European HDR Program. The authors would like to thank the staff of the GEIE Géothermie Soultz for site facilities. They are also grateful to S. Gentier, BRGM project leader, and to the two reviewers for improving the quality and the English of the manuscript.