1 Introduction
For the recent decades, sea level variations depend mainly on global climate change induced by anthropogenic greenhouse gases emissions as well as on natural climate variability. The two main factors causing sea level change (globally and regionally) are thermal expansion of sea waters and fresh water mass exchange between oceans and land (Bindoff et al, 2007; Lombard et al., 2006; Nerem et al., 2006). For example, as ocean warms in response to global warming, sea water expands, and thus sea level rises. As mountain glaciers melt in response to increasing air temperature, sea level rises because of fresh water mass input to the oceans. Similarly, ice mass loss from the ice sheets causes sea level rise. Modification of the land hydrological cycle due to climate variability and direct anthropogenic forcing may also affect sea level: on interannual to decadal time scales, more water on land means less water in the oceans, and inversely (Milly et al., 2010). While thermal expansion and land ice melt have been recently the object of numerous investigations, e.g., (Bindoff et al, 2007), the terrestrial water contribution to sea level remains poorly known, mainly because global in situ observations on land water storage are lacking. Estimates have been provided on the basis of global hydrological modelling for the past decades (Milly et al., 2003; Ngo-Duc et al., 2005). Their results are discussed below. The only study based on observations (Ramillien et al., 2008b) estimated the land water storage change on sea level using space gravimetry data from the GRACE space mission (launched in 2002). Based on only 3 years of GRACE data (February 2003 to February 2006), it concluded to a slight positive contribution to sea level changes over that time span, of ∼0.2 mm/yr. Here, we provide an update of this study that considers 7 years of GRACE data (from August 2002 to July 2009) instead of 3 years and uses improved GRACE products (see below). We consider the 33 largest river basins worldwide to estimate land water storage change (short-term trend and interannual variability). Summing up all contributions, we deduce the total land water storage trend over the 7-year time span and its contribution to sea level. We also compare the interannual variability in total land water storage with detrended global mean sea level corrected for thermal expansion.
2 Effect of land water storage change on sea level
Excluding ice sheets and glaciers, fresh water on land is stored in various reservoirs: snow pack, rivers, lakes, man-made reservoirs, wetlands and inundated areas, root zone (upper few meters of the soil) and aquifers (ground water reservoirs). Terrestrial waters are continuously exchanged with atmosphere and oceans through vertical and horizontal mass fluxes (evaporation, transpiration of the vegetation, surface runoff and underground flow). They are an integral part of the global climate system, with important links and feedbacks generated through its influence on surface energy and moisture fluxes between continental water, atmosphere and oceans. Thus, climate change and variability modify land water storage. Some human activities also directly affect water storage: for example, removal of ground water from aquifers by pumping (particularly in arid regions), building of artificial water reservoirs by construction of dams on rivers and wetland drainage. Other anthropogenic effects on land waters result from change of physical characteristics of the land surface by urbanization and land use associated with agriculture and deforestation. All these effects that modify the water budget in river basins, have consequently an impact on sea level.
To estimate the contribution of land water storage change on sea level, we can simply consider the conservation of water mass in the Earth's system (as done in previous studies, e.g., Chen et al., 1998; Milly et al., 2003). On time scales of years to decades, solid Earth stores can be neglected, so that only changes in terrestrial reservoirs, ocean and atmosphere can be considered, with the mass conservation as follows:
| (1) |
Previous studies have shown that water vapour change in the atmosphere cannot be neglected at the annual time scale. On interannual time scale (as considered here), we assume that the atmospheric storage is negligible (because of global warming, an increase of atmospheric water vapour is expected but no reliable estimates are available). Besides, because of the water holding capacity of the atmosphere, even with higher temperature, this contribution is expected to be small – as far as sea level change is concerned – (Milly et al., 2010). Thus Eq. (1) becomes:
| (2) |
ΔMocean represents the change in mass of the ocean due to total fresh water input from continents (i.e., land waters plus ice melt). It can be further expressed in terms of sea level change by simply dividing the total continental water volume change by the mean surface of the oceans (assumed equal to 360 × 106 km2) and changing its sign. In the following, we only consider the land water contribution (the purpose of this study). The associated ΔMcont component may then be quantified in estimating the change in water storage W in World river basins. At a river basin scale, temporal change in water storage W is related to precipitation P, evapotranspiration E and river runoff R through the water balance equation:
| (3) |
If P, E and R, or W were known globally, it would be possible to use these hydrological parameters to estimate the effect of land water storage change on sea level.
3 Previous studies
For the past decades, variations in land water storage caused by climate change and variability cannot be directly estimated from observations because these are almost inexistent at global continental scale (except for precipitation, but according to Eq. (3), either W or P-E-R need to be known). However, global hydrological models (or land surface models) developed for atmospheric and climatic studies can be used for estimating W. The models compute the water and energy balance at the earth surface, as well as water storage change in response to prescribed variations of near-surface atmospheric data (precipitation, temperature, humidity and wind) and radiation. Using atmospheric re-analyses over 1950–2000 and the Orchidee land surface model outputs, Ngo-Duc et al., 2005 estimated W globally and its contribution to sea level. They found no climatic long-term trend in W but large interannual/decadal fluctuations, of several millimetres amplitude when translated in sea level equivalent. A similar result was also found by Milly et al., 2003 using the Land Dynamics model over 1980–2000.
Direct human intervention on land water storage and induced sea level changes have been estimated in several studies (e.g., Chao, 1995; Chao et al, 2008; Gornitz, 2001; Sahagian, 2000). These results have been recently reviewed by Hungtington, 2008 and Milly et al., 2010. The largest contributions come from ground water pumping (either for agriculture, industrial and domestic use) and reservoir filling. Surface water depletion has a non-negligible contribution. Although detailed information is lacking, and estimates vary significantly between authors, ground water depletion may have contributed to past decades sea level rise by 0.55–0.64 mm/yr (Hungtington, 2008). During the past 50 years, several tens of thousands dams have been constructed over world rivers, leading to water impoundment into artificial reservoirs, hence negative contribution to sea level. Several attempts have been made to estimate the total volume of water stored in artificial reservoirs over the past half century (e.g., Chao, 1995; Gornitz, 2001; Vörösmarty et al., 1997). The recent study by Chao et al. (Chao et al, 2008) which reconstructs water impoundment history of nearly 30 000 reservoirs built during the 20th century, estimates to –0.55 mm/yr the contribution to sea level of dams and artificial reservoirs during the past half century. Hence, for the last few decades, effects on sea level from ground water depletion and water impoundment behind dams roughly cancel each other.
For the recent years, total land water storage W can be estimated from observations of the GRACE space gravimetry mission. The GRACE mission, launched in 2002, was developed by NASA (USA) and DLR (Germany) to measure spatio-temporal change of the Earth gravity field at a monthly interval. On time scales ranging from months to decades, temporal gravity variations mainly result from surface redistribution of water inside and among the outer fluid envelopes of the Earth (Ramillien et al., 2008a; Tapley et al., 2004; Wahr et al, 2004). On land, GRACE thus provides measurements of total water storage change W in river basins.
A recent study by Ramillien et al., 2008b estimated the water volume trend in the 27 largest river basins worldwide using space gravimetry data from GRACE over a 3-year time span (February 2003 to February 2006) and found either positive or negative water volume change over that period depending on the location of the river basins. The net water volume change was slightly negative (i.e., water loss), corresponding to <0.2 mm/yr sea level rise. We will see below that the length of the time series is critical when estimating trends in land water storage as total water storage in river basins is dominantly seasonal and interannual. As noted above, the global hydrological models runs for the past few decades did not report any long-term trend in global water storage but large interannual fluctuations. Thus, results from the present study are expected to be different from that of Ramillien et al., 2008b because of the more than twice longer time span of analysis.
4 GRACE data analysis
4.1 Data
Raw GRACE data are processed by different groups belonging to the GRACE project (Center for Space Research -CSR – and Jet Propulsion Laboratory-JPL – in the USA, and Geo-ForschungsZentrum-GFZ – in Germany). GRACE data are also processed by other groups (GSFC/NASA in the USA; GRGS in France and DUT in The Netherlands). The GRACE products delivered over land by all groups are time series of equivalent water height, expressed either in terms of spherical harmonic expansion or as gridded data. Several GRACE product releases have been available from the GRACE project, each time with substantial improvement. Here, we use the latest release (RL04) of three solutions: the CSR, JPL and GFZ solutions (1° × 1° global grids at monthly interval). This new data set (available at http://grace.jpl.nasa.gov/data/mass/) includes an implementation of the carefully calibrated combination of destripping and smoothing, with a 300 km half-width Gaussian filter (Chambers, 2006). Compared to earlier products (contaminated by north-south strips due to aliasing by the GRACE coverage of high-frequency signals of atmospheric and oceanic origins), the latest release is less noisy because of the destripping procedure applied to the data. Thus, it needs less spatial smoothing than earlier solutions. As a result the signal amplitude attenuation is less critical than in previous analyses. The gridded GRACE products are corrected for post-glacial rebound (the solid Earth response to last deglaciation, also sensed by GRACE) using Paulson et al., 2007 model. Thus, the post-glacial rebound contamination to high-latitude river basins storage is expected to be small (but of course model dependent). The gridded time series cover the August 2002 through July 2009 time span. In this analysis, we average the three GRACE data sets (CSR, JPL and GFZ) in order to increase the signal to noise ratio. If one month of data is missing in one data set, we consider the other two when averaging.
We consider the 33 largest World river basins. Their location is shown in Fig. 1 and their number and characteristics are summarized in Table 1. The river basin contours are based on masks of 0.5° resolution from Oki and Sud, 1998. To estimate the water storage contribution of individual river basins, we simply spatially average, for each month, GRACE equivalent water height over the area included inside the basin contours (after adjustment of the grids resolution), then multiply by the basin area to estimate water storage (in km3). We repeat the analysis for the three GRACE products and then compute the mean of the three time series for each river basin. For each month, the uncertainty of the water storage estimate is computed from the standard deviation of each solution with respect to the mean.
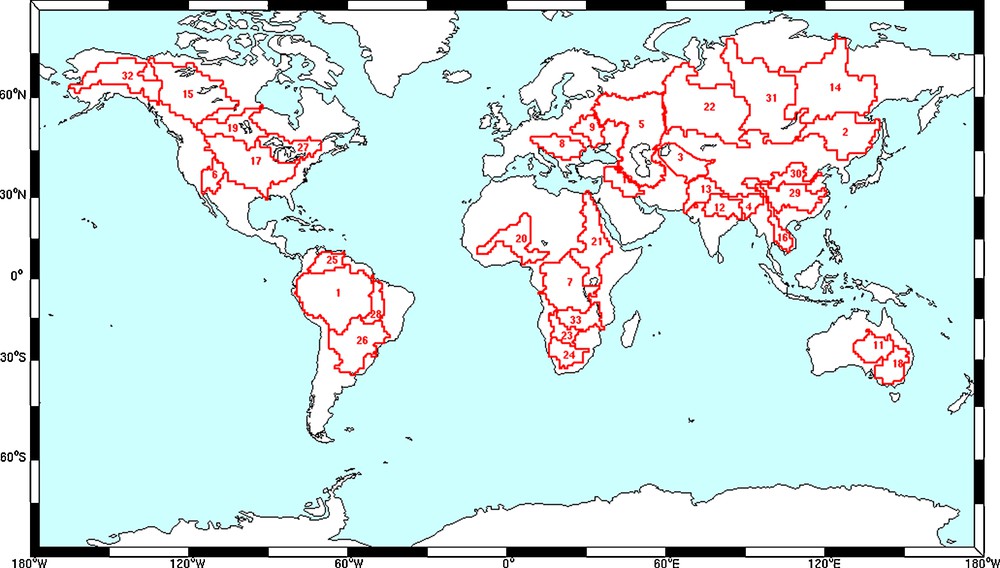
Map showing the contours of the 33 river basins.
Carte des contours des 33 bassins versants.
Liste des 33 bassins hydrologiques considérés dans cette étude: Noms et numéro associés, aire, tendance sur la période 2002–2009 en termes de stock d’eau déduit de GRACE avec les erreurs associées.
| Basin Number/name | Area (106 km2) | Water storage trend (km3/yr) | Trend error (km3/yr) |
| 1 Amazon | 6.20 | 77.8 | 9.3 |
| 2 Amur | 1.6 | −2.4 | 2.3 |
| 3 Aral | 1.2 | −9.7 | 1.9 |
| 4 Brahmaputra | 0.68 | −10.3 | 0.9 |
| 5 Volga/Caspienne | 3.7 | −6.7 | 4.8 |
| 6 Colorado | 0.65 | −4.0 | 0.7 |
| 7 Congo | 3.83 | −0.7 | 6.1 |
| 8 Danube | 0.82 | −2.2 | 1.5 |
| 9 Dniepr | 0.52 | −0.9 | 0.7 |
| 10 Euphrates | 0.75 | −7.5 | 1.2 |
| 11 Eyre | 1.2 | −6.4 | 0.8 |
| 12 Ganges | 0.94 | −11.0 | 1.1 |
| 13 Indus | 0.98 | −7.1 | 1.2 |
| 14 Lena | 2.47 | 26.6 | 2.3 |
| 15 Mackenzie | 1.74 | −6.8 | 1.2 |
| 16 Mekong | 0.81 | 0.8 | 1.2 |
| 17 Mississippi | 3.3 | −14.2 | 3.6 |
| 18 Murray | 1.1 | −6.3 | 1.0 |
| 19 Nelson | 1.07 | −0.5 | 1.2 |
| 20 Niger | 2.15 | 4.0 | 1.2 |
| 21 Nile | 3.13 | 4.7 | 2.5 |
| 22 Ob | 2.91 | 7.8 | 3.0 |
| 23 Okavango | 0.79 | 6.7 | 1.1 |
| 24 Orange | 1.0 | −0.8 | 0.8 |
| 25 Orinoco | 0.9 | 1.5 | 1.5 |
| 26 Parana | 2.93 | −7.1 | 3.7 |
| 27 St Lawrence | 1.11 | 6.2 | 1.3 |
| 28 Tocantins | 0.89 | 3.1 | 2.1 |
| 29 Yangtze | 1.81 | 7.8 | 1.3 |
| 30 Yellow | 0.76 | −2.1 | 0.9 |
| 31 Yenisey | 2.54 | 22.3 | 1.8 |
| 32 Yukon | 0.85 | −5.1 | 0.9 |
| 33 Zambeze | 1.35 | 14.0 | 3.1 |
4.2 Data errors
There are two main sources of error affecting the computation of GRACE-based water storage: to reduce spatial noise affecting GRACE data at short-wavelength, smoothing is necessary, which reduces the amplitude of the storage signal. Another problem is related to the signal contamination from neighboring regions (often called leakage). The basins considered here have a size equal or larger than ∼106 km2, nearly five times the GRACE resolution (of the order of 2 × 10⁵ km2). However, for the smallest basins, water storage from surrounding ones may leak into the considered region, thus pollute the estimated water storage. These errors are discussed in several papers (e.g., Ramillien et al., 2008a; Schmidt et al., 2008; Seo et al., 2006; Swenson and Wahr, 2002; Syed et al., 2008).
In this study, we analyze the effects of smoothing and leakage using synthetic hydrology data. For that purpose, we use monthly 0.5° × 0.5° grids of total water storage from the Water Gap Hydrological Model – WGHM – (Doll et al., 2003). To quantify the amplitude attenuation due to smoothing, we apply the same Gaussian filter (300 km half-width) to the WGHM data when averaging over each river basin (as done for the GRACE data) and compare the corresponding storage with and without smoothing. For the basins considered in this study, attenuation due to smoothing is small (<10%). To quantify the leakage, we apply the same procedure as in Ramillien et al., 2008b. For each month and each basin, the global WGHM model grid is modified by setting zero values over the considered river basins, keeping the model values outside the basin. This modified data set is then expanded in spherical harmonics up to degree 60 (equivalent to the GRACE resolution). The leakage signal is then estimated by convoluting this spherical harmonic expansion with that of the geographical mask representing the river basin (see Ramillien et al., 2008b), for more details). As noted previously, the leakage signal is mainly seasonal and on the order of 5% to 15% of the ‘model’ annual signal, depending on the basin. In terms of trend, the error is negligible, but we cannot exclude that hydrological models like WGHM do not perfectly reproduce the interannual and trend signal.
5 GRACE-based water storage change: Results
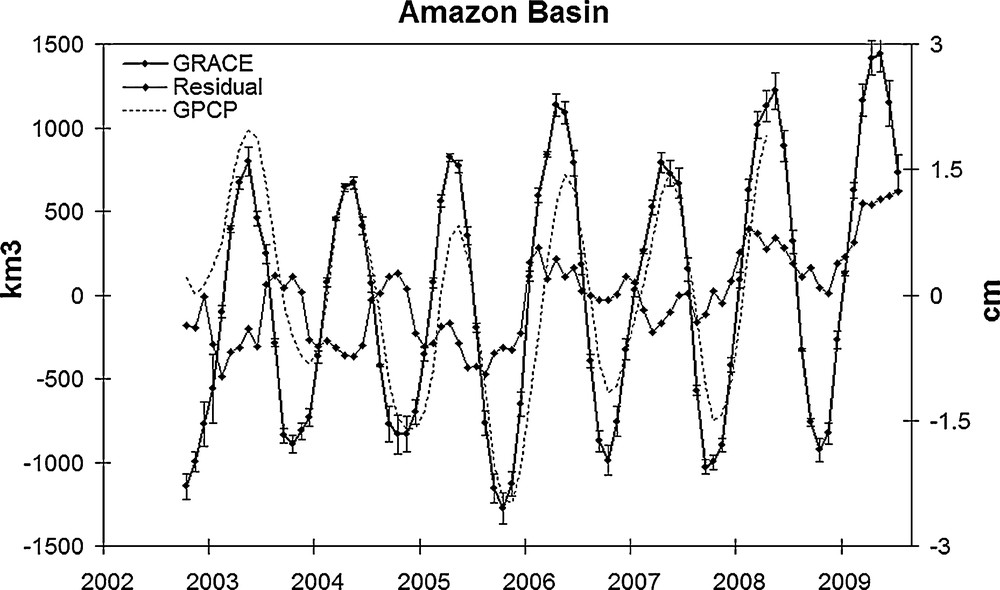
We now examine water volume time series over the 33 largest World river basins. We present separately the case of the Amazon basin (Fig. 2). Because of its huge dimension, its corresponding water volume variations dominate all other basins. A large annual cycle is observed. The residual curve also shows large fluctuations of ±300 km3 amplitude. What is particularly noticeable is an abrupt positive excursion occurring at the end of 2005, right after a temporary minimum in water storage in mid-2005 (Chen et al., 2005). The end of year 2008 also shows an abrupt increase in water storage. Link between GRACE-based water storage change and precipitation patterns over the Amazon basin have been shown in several previous publications. For example, two recent studies (Chen et al., 2005; Xavier et al., 20101) which focus on the interannual time scale report a high correlation between year-to-year fluctuations of average precipitation and GRACE-based water storage. Several hydrological events have affected the Amazon basin over the recent years: a severe drought in the second part of 2005, followed by a wet episode in early 2006. Other wet periods are also observed in early 2008 and 2009. The studies show that the 2005 dry conditions (rain deficit) affect essentially the western part of the Amazon basin while the 2006 and 2008 wet episodes affect the eastern part. To illustrate the relationship between rainfall and water storage, we have superimposed in Fig. 2, time-integrated precipitation averaged over the Amazon basin and GRACE-based water storage (from the water balance equation, GRACE-based water storage W should be compared to time-integrated precipitation). Precipitation data are obtained from the Global Precipitation Climatology Project (http://lwf.ncdc.noaa.gov/oa/wmo/wdcamet-ncdc/). We can clearly see the high level of correlation between time integrated precipitation and water storage inferred from GRACE.
In Fig. 3 are presented for a few basins (Euphrates, Ganges, Lena, Mississipi, Yenisey and Zambezi, selected among the largest contributors to sea level changes), the water volume time series (whole signal) and the residuals after removing the seasonal signal (annual and semi-annual cycles). For each basin, we have compared the interannual water storage from GRACE (i.e., the residual time series) with model data from the GLDAS (Global Land Data Assimilation System)/Noah (Rodell et al., 2004). A few examples are presented in Fig. 4 (Colorado, Danube, Nelson, Parana, Okavongo and Yantgze; this selection allows to show another set of residual time series, covering different regions of the world). We note for all basins a very good agreement between GRACE and GLDAS, not only for the seasonal cycle (for which the signal is generally dominant), but also at the interannual time scale. As shown in several previous studies, this gives confidence in the GRACE results, even at interannual time scale.
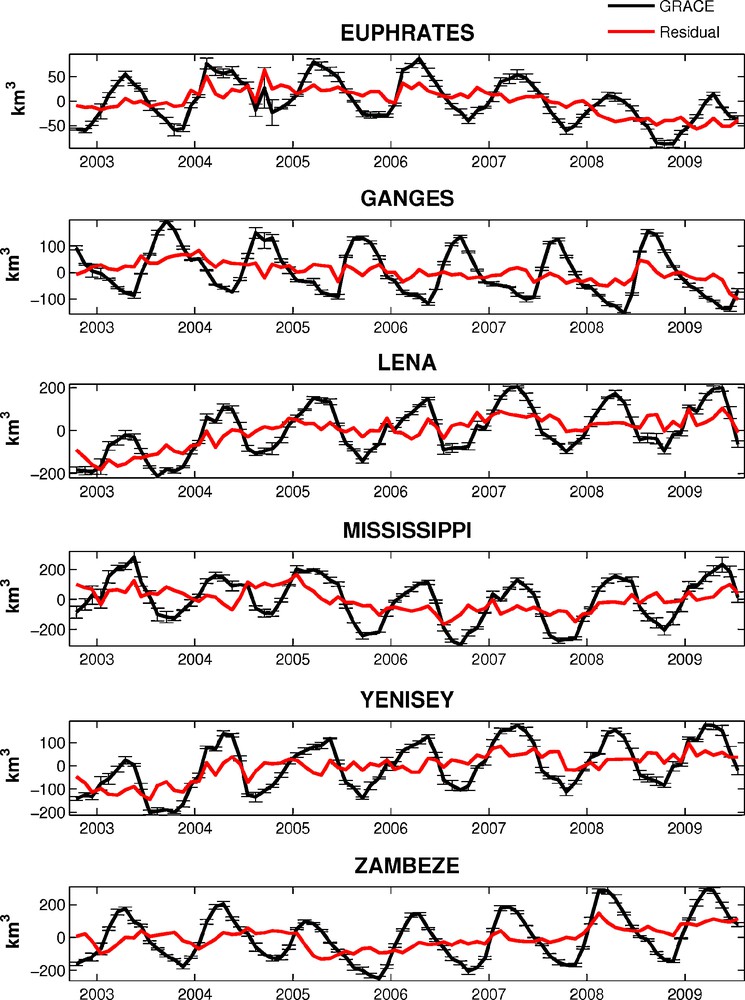
Water storage change (in km3) from GRACE over a selection of 6 basins (Euphrates, Ganges, Lena, Mississippi, Yenisei and Zambezi). Solid black curve: land water signal with uncertainty; red (lighter) curve: residual signal (seasonal cycle removed).
Variations du stock d’eau (en km3) calculé à partir de GRACE sur 6 bassins versants (Euphrate, Gange, Lena, Mississippi, Yenisei et Zambézi). Courbe noire : signal total ; courbe rouge (plus claire) : signal résiduel (cycles saisonniers retirés).
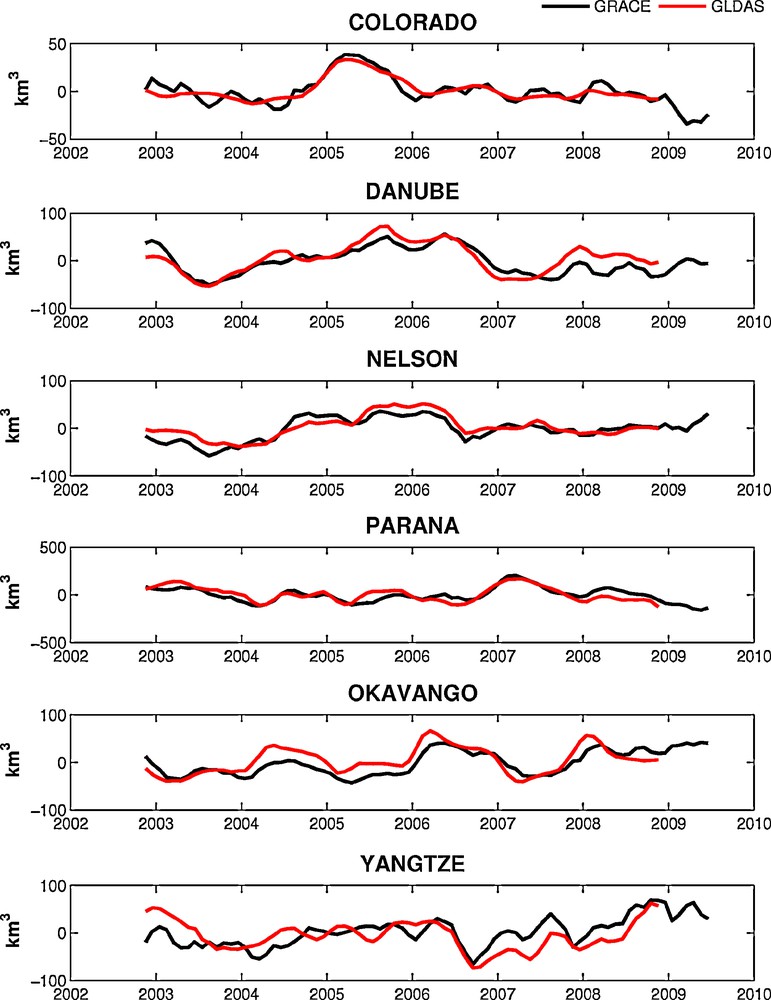
Interannual water storage variability (in km3) over a selection of 6 basins (Colorado, Danube, Nelson, Parana, Okavango and Yangtze). Solid black curve: land water signal from GRACE; red (lighter) curve: GLDAS model result.
Variations interannuelles du stock d’eau (en km3) calculé à partir de GRACE sur 6 bassins versants (Colorado, Danube, Nelson, Parana, Okavango et Yangtze). Courbe noire : signal GRACE ; courbe rouge (plus claire) : signal GLDAS.
For each residual curve, we have computed a linear trend over the 7-year time span (further called ‘short-term trend’). We are well aware that the time span is still short but this allows to provide an order of magnitude of the land water contribution to sea level rise. GRACE-based water storage trends over 2002–2009 are gathered in Table 1 and shown in Fig. 5. The largest water storage short-term trend is due to the Amazon basin (+77.8 ± 9.3 km3/yr). As shown in Fig. 2, this positive trend results from a change in water storage regime as of early 2006, from dry to wet conditions. In Ramillien et al., 2008b, we found a trend of –18 km3/yr for the 3-year period (February 2003 to February 2006). Of course, the present study finds the same trend value over this smaller time span. The fact that the trend value becomes positive when increasing the length of the time series is due to the strong increase in water storage in early 2006. Water storage remains high beyond that date. Thus, the computed trend value becomes positive (in fact what we see here in a succession of positive steps in the time series in 2006, 2008 and 2009, with dry conditions during years 2003 through 2005 and wet conditions beyond).
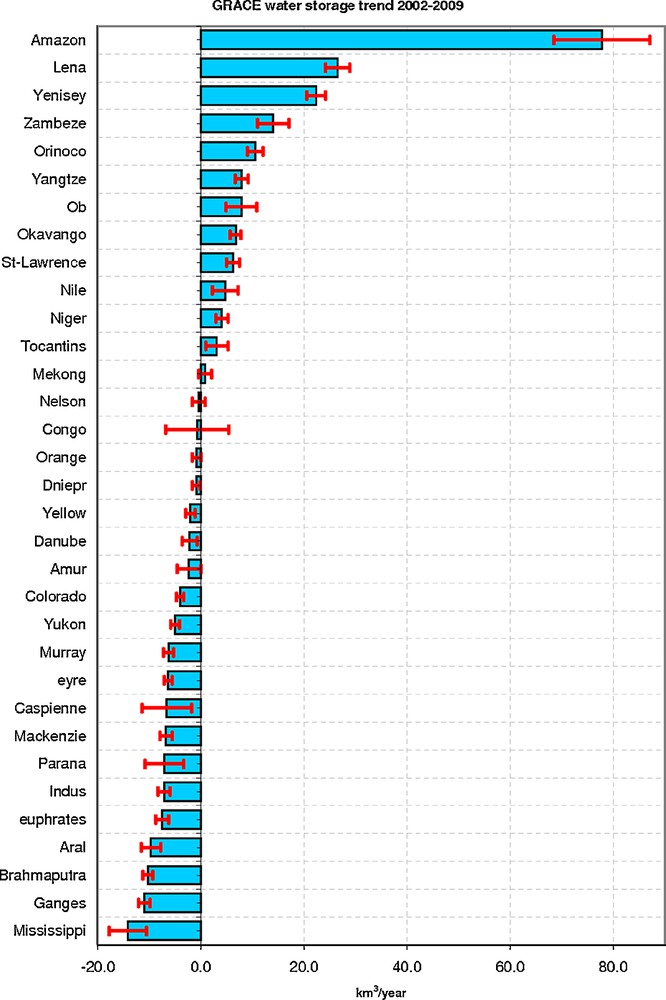
Histogram of the largest positive and negative basin storage trends estimated from GRACE over the 7-year time span.
Histogramme des tendances les plus significatives des stocks d’eau estimées à partir de GRACE, comme décrit dans le Tableau 1.
The next largest positive contributions come from the Lena and Yenisey basins located in Siberia (trends of 26.6 ± 2.3 km3/yr and 22.3 ± 1.8 km3/yr respectively). Analysis of rainfall data (from the Global Precipitation Climatology Project; http://lwf.ncdc.noaa.gov/oa/wmo/wdcamet-ncdc/) indicates positive trends in precipitation over the Siberian river basins over 2002–2009 (not shown). The largest negative trends are observed for the Mississipi (−14.2 ± 3.6 km3/yr), the Ganges and Brahmaputra (−11.0 ± 1.1 km3/yr and −10.3. ± 0.9 km3/yr). Loss of water in the Ganges region has been confirmed by two recent publications (Rodell et al., 2009; Tiwari et al., 2009) and attributed to intensive ground water pumping for crop irrigation. We do not wish to reiterate the comment made above for the Amazon basin about the comparison between Ramillien et al. (Ramillien et al., 2008b) but it is clear that estimated short-term trends greatly depend on the length of the time series. This is so because year-to-year fluctuations dominate the water storage signal.
We have summed up the 33 water volume time series (with and without the seasonal cycles). Corresponding curves are shown in Fig. 6. Both curves are dominated by the Amazon contribution. The residual curve (annual cycle removed) exhibits significant year-to-year variability on the order of 500 km3. The mean trend of the residual water volume change is +80.6 ± 15.7 km3/yr.
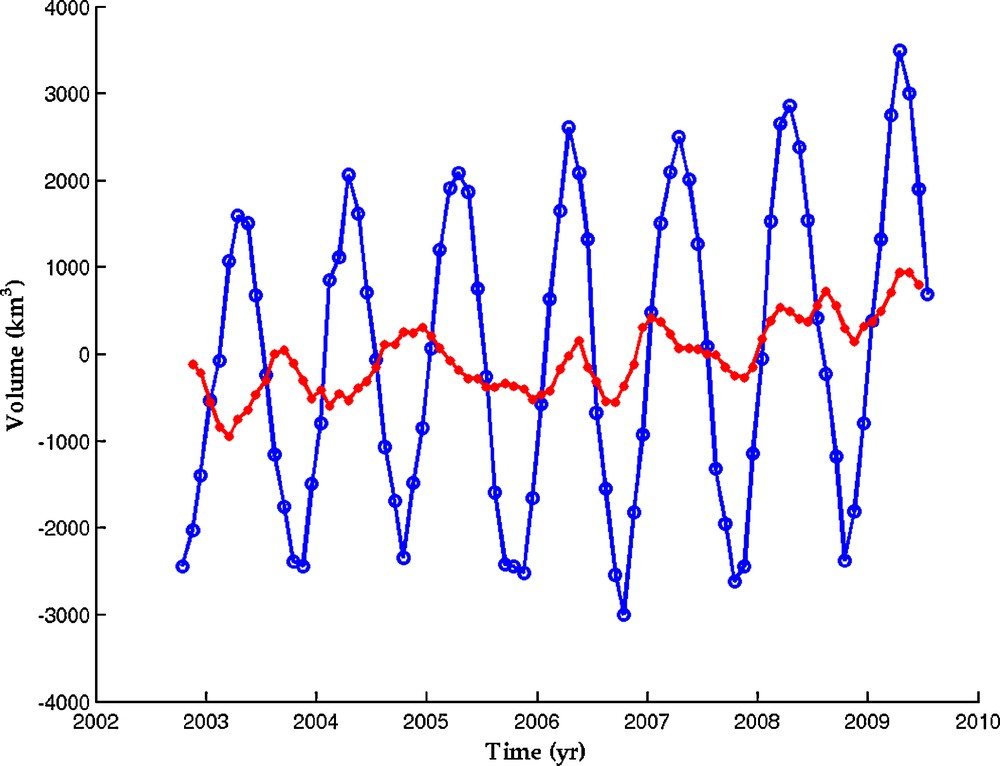
Total land water storage change from GRACE (sum of the 33 basins contributions). Solid blue (darker) curve: total signal; Red (lighter) curve: residual signal (seasonal cycle removed). Unit in km3.
Variation du stock d’eau continental total d’après GRACE (somme des contributions des 33 bassins). Courbe bleue (plus foncée) : signal total; courbe rouge (plus claire) : signal résiduel (cycles saisonniers retirés). Unité en km3.
6 Land waters and sea level
Converting the positive short-term trend in land water storage (+80.6 ± 15.7 km3/yr) estimated from GRACE between August 2002 and July 2009 into sea level equivalent leads to a negative sea level trend of ∼ –0.22 ± 0.05 mm/yr over this time span.
Satellite altimetry observations available since 1993 indicate that sea level has been rising by 3.4 ± 0.4 mm/yr between 1993 and 2009 (Ablain et al., 2009). Knowledge of the contribution of thermal expansion, glaciers melting and mass change of the ice sheets has considerably improved in recent years (Bindoff et al, 2007). Although none of these climate factors change linearly with time, on average over the 1993–2008 time span, ocean warming, glaciers melting and ice sheet mass loss have each contributed by ∼30% to global mean sea level rise (Cazenave and Llovel, 2010). The negative short-term trend contribution for terrestrial water storage determined in this study over the past 7 years is small and within the uncertainty of observed sea level trend and estimated climate contributions. It is of similar magnitude as land surface model results (Milly et al., 2003; Ngo-Duc et al., 2005) and previous GRACE-based estimate (Ramillien et al., 2008b), but of opposite sign with the latter study based on only 3 years of data. The fact that the land water component oscillates from positive to negative values depending on the time span strongly suggests the dominance of interannual variability for this component (as shown by model results).
To further investigate the contribution of year-to-year variability in land water storage to sea level, we now compare the GRACE-based total water storage computed above (expressed in terms of equivalent sea level) with observed, detrended sea level (corrected for thermal expansion).
The thermal expansion contribution, based on (Guinehut et al., 2009), has been subtracted to the global mean sea level curve (based on Topex/Poseidon and Jason-1 altimetry). The difference time series has been detrended since we focus now on the interannual variability. Results are shown in Fig. 7 which compares interannual variability in global mean sea level (corrected for thermal expansion) and land water storage oscillations. A 3-month smoothing has been applied to both time series. We note a clear correlation between the two curves, amounting to ∼0.6. The phasing is particularly good. This is an interesting result since, so far, the origin of interannual fluctuations of the global mean sea level remained unexplained. The result obtained in this study suggests that year-to-year fluctuations of total water storage on land – mainly related to climate variability – is responsible, at least partly, for the interannual variability of the global mean sea level.

Year-to-year fluctuations of the (detrended) global mean sea level corrected for thermal expansion (red [lighter] curve) and of total land water storage from GRACE – expressed in equivalent sea level – (green [darker] curve). Units in mm.
Variabilité interannuelle du niveau moyen de la mer (tendance retirée et corrigée de l’expansion thermique, courbe rouge [plus claire]) et variabilité interannuelle du stock d’eau continental total d’après GRACE – exprimé en equivalent niveau de la mer (courbe verte [plus foncée]). Unités en mm.
7 Conclusion
In this study, we have estimated the contribution of total land water storage variations to sea level changes using GRACE data over a 7-year period (August 2002 to July 2009). The 33 largest World basins of the world are considered. We find that over this time span, the Amazon basin dominates the total land water signal. This is due to particularly wet conditions as of early 2006 which lasted until 2009. These wet conditions contrast with a previous drought episode in 2005. The Siberian basins (Lena, Yenisey and Ob) also show water storage increase. On the other hand, some basins have lost water during the time span, in particular the Mississippi and the Ganges-Brahmaputra basins. In the latter basins, water loss is possibly of anthropogenic origin (groundwater withdrawal for irrigation). The net water storage trend is positive over the 7-year time span. When translated into equivalent sea level, this gives a small negative contribution of –0.22 ± 0.05 mm/yr. This is a small contribution which confirms earlier modelling results. On the other hand, the water storage time series clearly show that -except for the two Siberian basins (Lena and Yenissei)-, the signal is dominated by interannual variability. We have compared the year-to-year variability of total land water storage with interannual fluctuations of the global mean sea level (corrected for thermal expansion). The two signals are positively correlated (correlation coefficient of ∼0.6). This suggests that interannual variability of the global mean sea level is at least partly caused by year-to-year variability of land water storage. Such a result is new.
Acknowledgements
We thank Katia Laval and three anonymous reviewers for their comments. W. Llovel and M. Becker are supported by grants from CNRS and the Region Midi-Pyrénées, and the RTRA-STAE respectively. GRACE data were processed by D. P. Chambers, supported by the NASA Earth Science REASoN GRACE Project, and are available at http://grace.jpl.nasa.gov.
1 L. Xavier, A. Cazenave, O.C. Rotunno Filho and M. Becker, Interannual variability in water storage over 2003–2007 in the Amazon Basin from GRACE space gravimetry, in situ river level and precipitation data, Remot. Sens. Env. (2010) in revision. Water storage change (in km3) from GRACE over the Amazon basin. Solid curve: total signal; Solid dotted curve: residual signal (seasonal cycle removed). The dashed curve represents time-integrated precipitation over the basin (in cm). Variations du stock d’eau (en km3) calculé à partir de GRACE sur le bassin de l’Amazone. Trait plein: signal total ; trait plein avec carrés: signal résiduel (cycles saisonniers retirés). La courbe en pointillé représente les précipitations intégrées temporellement sur le bassin (en cm).