

1 Introduction
The impact of climate variability on groundwater resources remains poorly known because in situ measurements are very sparse. This is of particular concern in Africa, where approximatively half of its nearly one billion inhabitants rely upon groundwater for their daily water supply (Taylor et al., 2008). Furthermore, future adaptations in response to climate change and rapid population growth are expected to intensify dependence upon groundwater in Africa.
In the recent years, remote sensing observations have been used to study water storage variations in major river basins on time scales from months to decades. For example, satellite altimetry measures water levels of rivers, lakes and flood plains (Birkett, 1995; Birkett, 1999; Calmant et and Seyler, 2006; Calmant et al., 2008; Crétaux and Birkett, 2006; Mercier et al., 2002; Ponchaut and Cazenave, 1998; Zakharova et al., 2006). Over lakes and flood plains, it also provides surface water volume change when combined with surface water area. Since 2002, the gravity recovery and climate experiment (GRACE) space mission measures spatiotemporal change in vertically-integrated water storage (surface water, soil moisture and groundwater, and snow where appropriate). The combination of altimetry and gravimetry gives access to a large range of hydrological products and finds all its interest in remote areas where networks of in situ measurements encounter maintenance problems (Alsdorf et al., 2007; Awange et al., 2008; Frappart et al., 2006; Frappart et al., 2008; Papa et al., 2008; Swenson and Wahr, 2009). Satellite altimetry observations, which are publicly available and of high quality (see below), are a powerful tool for monitoring surface waters of the East Africa region.
In this study, we jointly analysed GRACE and satellite altimetry data over the East African lakes and their drainage basins in order to highlight time-variable hydrological conditions in this region. We analyse also rainfall data as well as thermal expansion of the western Indian Ocean. Finally, we combine altimetry and GRACE data in order to compute soil moisture and groundwater variations and perform comparison with output of a global hydrological model. For simplicity, in the following, we call “soil moisture” the water contained in the pore space of the unsaturated zone, “groundwater” the saturated water zone and “subsurface water” the sum of groundwater and soil moisture.
2 Hydrological characteristics of the study area
In this work, we study the drainage basins of the four largest lakes of the East African Rift Valley: Turkana, Victoria, Tanganyika and Malawi. The study region is shown in Fig. 1. It is crossed by the borders of 11 countries: Ethiopia, Kenya, Sudan, Uganda, Tanzania, Rwanda, Burundi, Republic of Congo, Zambia, Malawi and Mozambique. The contours of the drainage basin (Fig. 1) for each lake are obtained from the drainage network provided by the routing model called Total Runoff Integrating Pathways (TRIP (Oki and Sud, 1998)). The hydrographic network defined by TRIP has a spatial resolution of 1 × 1 and gives for each mesh the direction of the flow. Lake Turkana is located in the arid north-western Kenya. Its drainage basin covers part of Kenya and the Omo River (which supplies about 90% of water to the lake). Lake Turkana loses water mainly by evaporation (Ferguson and Harbott, 1982). Lake Victoria is the largest lake in Africa. The boundaries of the lake cross Kenya, Uganda and Tanzania. Outflow from Lake Victoria contributes most of present-day White Nile River flow. The Kagera River contributes only ∼7% of the total water input. In Uganda, where the lake outflow is located, hydropower is the main source of electricity for the country (WWAP, 2006). Lake Victoria's water balance is controlled both by net precipitation, catchment inflow and dam outflow (Yin et and Nicholson, 1998). Lake Tanganyika is the longest lake in the world. It crosses or has on its banks Burundi, the Democratic Republic of the Congo, Tanzania and Zambia. Lake Tanganyika is fed by many small streams and two major rivers: the river Rusizi, flowing from Lake Kivu to the north and the river Malagarasi, to the south. The only outlet of Lake Tanganyika is the river Lukuga. Lake Malawi is fed by 14 perennial rivers, the largest being the Ruhuhu river. Its unique outlet is the river Shire, a tributary of the Zambezi river.
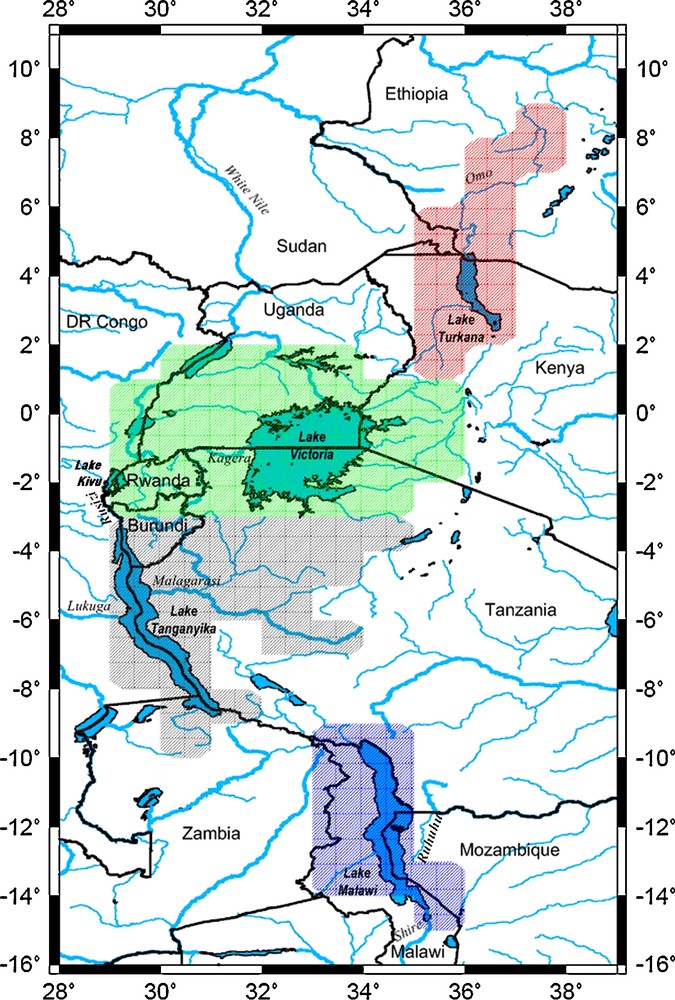
Boundaries of the East African Great Lakes region. The lakes with their drainage basin selected for the study are: Lake Turkana (red), Lake Victoria (green), Lake Tanganyika (gray) and Lake Malawi (blue). The contours of the drainage basin were obtained from the drainage network provided by the model routing Total Runoff Integrating Pathways (TRIP, (Kundzewicz et al., 2004)).
Les frontières de la région des grands lacs d’Afrique de l’Est. Les lacs avec leur bassin de drainage sélectionnés pour l’étude sont : le lac Turkana (rouge), le lac Victoria (en vert), le lac Tanganyika (gris) et le lac Malawi (bleu). Les contours des bassins de drainage ont été obtenus à partir de la direction des flux fournie par le modèle de routage Total Runoff Integrating Pathways (TRIP, (Kundzewicz et al., 2004)).
Fluctuations in lake water volume mainly reflect changes in precipitation and evaporation over the lake and its catchment basin. In that sense, these fluctuations constitute a sensitive indicator of past and present climate changes, at least at local and regional scales. Another important term in the lake water balance is outflow (Awange et al., 2008; Swenson and Wahr, 2009).
The hydrological regime of the East African lakes is primarily dependent on the climatic conditions of the alternating wet and dry seasons. Rainfall over much of East Africa displays a bimodal regime with rainy seasons from March to May and October to December, moderated by coastal and topographic influences (Mutai et al., 1998). The rainfall regimes and the transitional periods show varying degrees of influence from the Atlantic, Indian and Pacific Oceans. Periodic circulation dipole events in the Indian Ocean tend to be associated with above-average and sometimes very extreme rainfall from October to December (Conway et al., 2005).
3 Data sets
In this section, we present the four data sets used in this study.
3.1 Satellite altimetry
Satellite altimetry has been developed and optimized to measure sea surface height (Fu and Cazenave, 2001). However, during the last two decades, it has also been applied to monitor water levels of lakes, floodplains and wetlands (Birkett, 1999; Birkett et al., 1999; Calmant et and Seyler, 2006; Calmant et al., 2008; Crétaux and Birkett, 2006; Frappart et al., 2006; Frappart et al., 2008; Mercier et al., 2002). Water level time series of greater than 15 years length, based on the Topex/Poseidon, Jason-1, ERS-1/2 and ENVISAT altimetry missions are now available for several hundred continental lakes, river stations and man-made reservoirs. These are available on Internet databases (e.g., http://www.pecad.fas.usda.gov/cropexplorer/global_reservoir for large lakes, the HYDROWEB data base http://www.legos.obs-mip.fr/soa/hydrologie/hydroweb for lakes, man-made reservoirs, rivers and floodplains, and the “River and Lakes” database http://earth.esa.int/riverandlake for large lakes and rivers). On rivers and small lakes, conventional nadir-viewing altimetry has limitations because radar waveforms (e.g., raw radar altimetry echoes after reflection from the land surface) are more complex than their oceanic counterparts due to interfering reflections from water, vegetation canopy and rough topography. However, for large lakes (such as those considered in the present study), this technique has proved quite useful to measure surface elevation with good accuracy. Validation studies indicate that water level uncertainty of 3–5 cm RMS (root mean squares) for the largest lakes (Birkett, 1995; Crétaux and Birkett, 2006). A comparison of altimetric lake levels and in situ stage measurements of Lake Victoria near Jinja, Uganda during the period 2000–2004 showed excellent agreement ((Reynolds, 2005), http://www.fas.usda.gov/pecad/highlights/2005/09/uganda_26sep2005/). Fig. 2 presents water volume evolution since 1993 for the four African lakes. Data were smoothed with a 6-month window. To compute the lake water volume at a given date, we simply multiply the spatially averaged water level over the lake area (as given in the HYDROWEB data base) by the lake area given in Table 1. More details on the method developed for estimating mean lake levels from multiple satellite tracks are given in Crétaux and Birkett (Crétaux and Birkett, 2006). On Fig. 2, we observe a water volume decrease of lakes Tanganyika and Malawi (≥ 6 km3/year) over 1993–1997. Ponchaut and Cazenave (Ponchaut and Cazenave, 1998) associated this trend, observed from Topex/Poseidon (1993–1997), with recurrent droughts recorded in East and South Africa since the early 1990s. On the other hand, a large water volume increase in late 1997 – early 1998 is noted for lakes Turkana, Victoria and Tanganyika. This major anomalous pattern has been explained by a positive rainfall anomaly occurring in late 1997, related to the equatorial Indian Ocean warming reported during the 1997–1998 ENSO event (Mercier et al., 2002). These lakes exhibit a strong volume decrease between 1998 and 2006, then an increase until 2008. The Malawi lake shows a different pattern. Jury and Gwazantini (Jury and Gwazantini, 2002) showed that the interannual cycles of Malawi lake level are consistent with those found for Zambezi River streamflows, suggesting a degree of regional coherence.
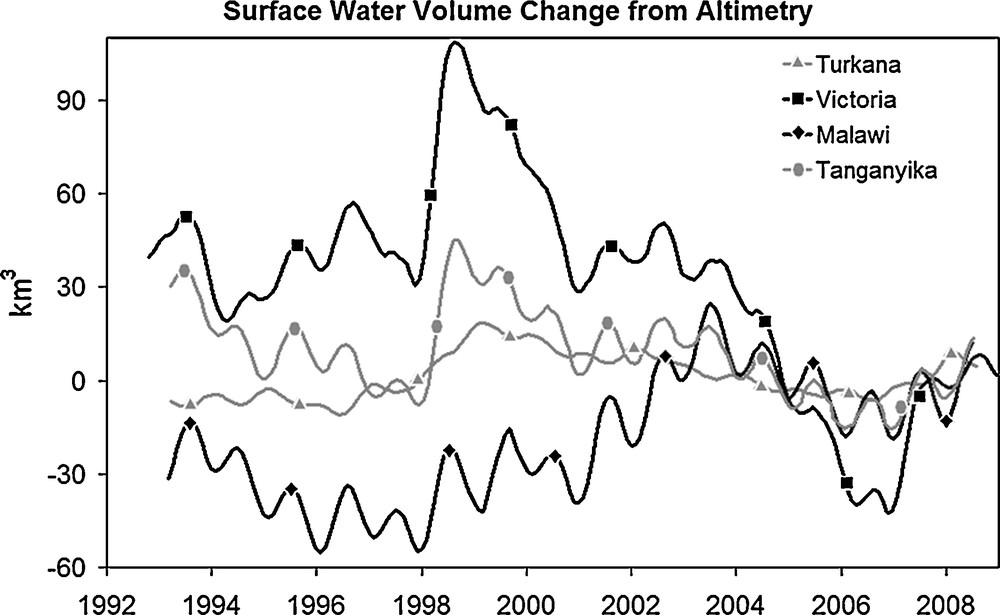
Mean Lake volume fluctuations (in km3) from satellite altimetry (1992–2008) for each lake studied: Turkana, Victoria, Malawi and Tanganyika. The data are smoothed, with a 6-month window.
Moyenne des fluctuations de volume des lacs, (en km3) à partir des données d’altimétrie spatiale (1992–2008), pour chacun des lacs : Turkana, Victoria, Malawi et Tanganyika. Les données sont lissées avec une moyenne glissante de six mois.
Données morphométriques des grands lacs de l’Est Africain (Awange, 2006; Bootsma and Hecky, 1993; Spigel and Coulter, 1996; Thieme et al., 2005).
| Turkana | Victoria | Tanganyika | Malawi | |
| Location | 3°N – 36°E | 1°4S – 33°E | 8°5S – 29°5E | 11°S – 34°5E |
| Catchment area (km2) | 130,860 | 193,000 | 220,000 | 126,500 |
| Lake area (km2) | 6750 | 68,800 | 32,600 | 29,500 |
| Total area (km2) | 137,610 | 261,800 | 252,600 | 156,000 |
| Water level control | Unregulated | Regulated | Unregulated | Regulated |
3.2 GRACE space gravimetry
The space gravimetry mission GRACE was launched in March 2002 with the objective of providing spatiotemporal variations of Earth's gravity field. On time scales ranging from months to decades, temporal variations of gravity are mainly due to redistribution of water mass in the surface fluid envelopes of the Earth. On land, GRACE provides measurements of vertically-integrated water storage or terrestrial water storage (TWS) (surface water, soil, groundwater and snowpack) in large river basins (Tapley et al., 2004; Wahr et al., 2004). The GRACE mission is managed by both the US National Aeronautics and Space Administration (NASA) and the German Aerospace Centre (DLR). Monthly gravity field solutions are computed at the University of Texas at Austin Center for Space Research (CSR), the German Research Centre for Geosciences Potsdam (GFZ), the Jet Propulsion Laboratory (JPL), the Groupe de recherche de geodesie spatiale (GRGS), and the Delft Institute of Earth Observation and Space Systems (DEOS) as well as at Delft University of Technology, among others. In this study, we use the most recent GRACE data release (RL04) from CSR, JPL and GFZ. This new data set (available at http://grace.jpl.nasa.gov/data/mass/) includes an implementation of the carefully calibrated combination of destriping and smoothing, with different Gaussian filters (Chambers, 2006). Compared to earlier products (contaminated by north-south strips due to orbital resonance induced by aliasing of high-frequency atmospheric perturbations by the GRACE coverage), the latest release is much less noisy because of the destripping procedure applied to the data and needs less spatial smoothing than earlier solutions. The GRACE products are corrected for post-glacial rebound (the solid Earth response to last deglaciation, also sensed by GRACE) using the Paulson et al. (Paulson et al., 2007) model.
Here we consider RL04 GRACE grids from CSR, JPL and GFZ (with 300 km half width Gaussian filter). The data are available as monthly 1 × 1 grids TWS over land, expressed in units of equivalent water height and cover the period from August 2002 through August 2008. Two months are missing: June 2003 and January 2004. In the following, we use the mean of the three GRACE products: CSR, JPL and GFZ.
3.3 Precipitation data
Monthly grids from August 2002 to August 2008 precipitation (2.5° × 2.5°) used in this study are derived from Global Precipitation Climatology Project database (GPCP, http://lwf.ncdc.noaa.gov/oa/wmo/wdcamet-ncdc.html). GPCP quantify the distribution of precipitation over the global land surface (Adler et al., 2003). We use the Satellite-Gauge Combined Precipitation Data product Version 2 data, whose estimated uncertainties over land range between 10 to 30%. These grids merge infrared and microwave satellite-inferred precipitation with rain gauges data from more than 6000 ground stations.
3.4 WaterGAP Global Hydrological Model
The WaterGAP Global Hydrological Model (WGHM) provides estimates of the TWS globally, with a resolution of 0.5° × 0.5° (Döll et al., 2003). This model has been used to analyse spatiotemporal variations of water storage components globally over large river basins (Güntner et al., 2007). It computes water storage in the snow pack, rooted soil zone, groundwater, on vegetation surfaces, and in surface water reservoirs (rivers, lakes and wetlands). Here, we use the latest WGHM simulations (Hunger and Döll, 2008) forced with precipitation from the Global Precipitation Climatology Centre (GPCC) and air temperature, radiation, and number of rain-days within each month from ECWMF operational forecasts. The conceptual model equations of WGHM are described in detail by Doll et al. (Döll et al., 2003) and Hunger and Doll (Hunger and Döll, 2008). WGHM is based on the best global data sets currently available, and is able to simulate the reduction of river discharge by human water consumption. In order to obtain a reliable estimate of water availability, it is tuned against observed discharge at 1235 gauging stations, which represent 50% of the global land area and 70% of the actively discharging area. In Africa, most basins north of the equator do not perform well, while the interannual variability of the Central African Congo and the semi-arid to arid Southern African basins of the Zambezi and Orange is captured (Döll et al., 2003).
4 Water storage and climate variation
4.1 GRACE data and precipitation
At a regional scale, total water storage, TWS, measured by GRACE is related to precipitation P through the water budget equation:
| (1) |
where E is evapotranspiration and R is river runoff.
In view of the lack of direct information on E and R over the studied region, here we compare TWS and P.
We performed an Empirical Orthogonal Function (EOF) decomposition (Preisendorfer, 1988) of the GRACE data (average from CSR, JPL and GFZ) over the East Africa region (16°S-11°N; 28°E-40°E). EOF analysis decomposes the spatiotemporal data in orthogonal modes of decreasing variance, expressed by spatial patterns and associated variations in time (also called principal component [PC] time series). We removed a composite annual cycle at each data point and the results were smoothed with a 6-month window before the EOF decomposition, in order to emphasize the low frequency signal. Accordingly to North's rule of thumb (North et al., 1982), the first three modes for GRACE TWS were kept. These explain 71, 10 and 9% of the total variance. They are shown on Fig. 3. The first EOF spatial pattern reveals a positive TWS change with a maximum located west of Lake Victoria basin. The corresponding principal component shows a significant negative trend from 2002 to 2006 with a minimum occurring at the end of 2005, then a strong increase until 2008. The mode 2 spatial pattern shows a positive TWS change signal over the north-west part of the area, which includes the Lake Victoria basin. A clear negative trend time evolution is revealed by the corresponding principal component, but also a quasi-periodic oscillation (2-year period). Mode 3 principal component time series shows a quasi-periodic oscillation of period 1.5 to 2 years.
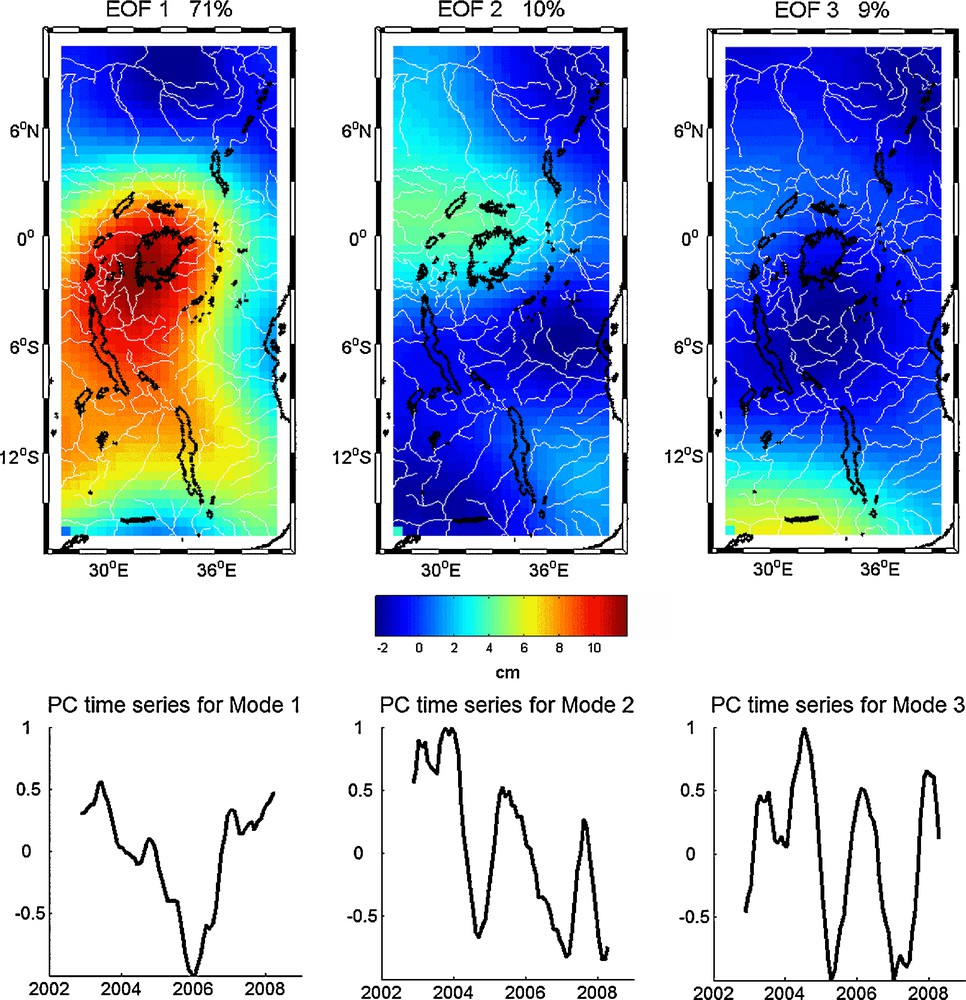
EOF decomposition of GRACE TWS over East Africa for 2002–2008. The upper panel represents the geographical pattern and the lower panel represents the temporal variation of the GRACE TWS.
Décomposition en EOF des données de TWS de GRACE sur l’Afrique de l’Est, entre 2002 et 2008. La figure du haut représente la variabilité spatiale et la figure du bas représente la variation temporelle des données de TWS de GRACE.
We also performed an EOF decomposition of precipitation data (after removing the annual signal and smoothing with a 6-month window at each grid point). Fig. 4 shows the first leading mode (49% of the total variance) of the EOF decomposition of precipitation data over the studied region. The temporal curve shows a decrease between mid-2003 and the end of 2005, probably related to the 2005 severe drought reported in Equatorial East Africa (Hastenrath et al., 2007). Moreover, a sudden rise occurs in the temporal curve between the end of 2005 and the beginning of 2007. This event will be discussed below in some detail. As indicated by the spatial pattern map, the wettest region is the center of the area that includes the lakes. According to the water budget equation (see Eq. [1] above), we expect that precipitation and TWS show a common mode of variability. Fig. 4 displays the principal component time series of the first mode (PC1) of GRACE and GPCP. The two curves are very similar. The correlation coefficient between the two signals is equal to 0.49, significant at more than 95%. The spatial correlation between PC1 for GRACE and GPCP is −0.46. In a recent study, also based on altimetry and GRACE data over Lake Victoria, Swenson and Wahr (Swenson and Wahr, 2009) showed that increased precipitation over Lake Victoria significantly reduced the TWS deficit accumulated during the previous few years.
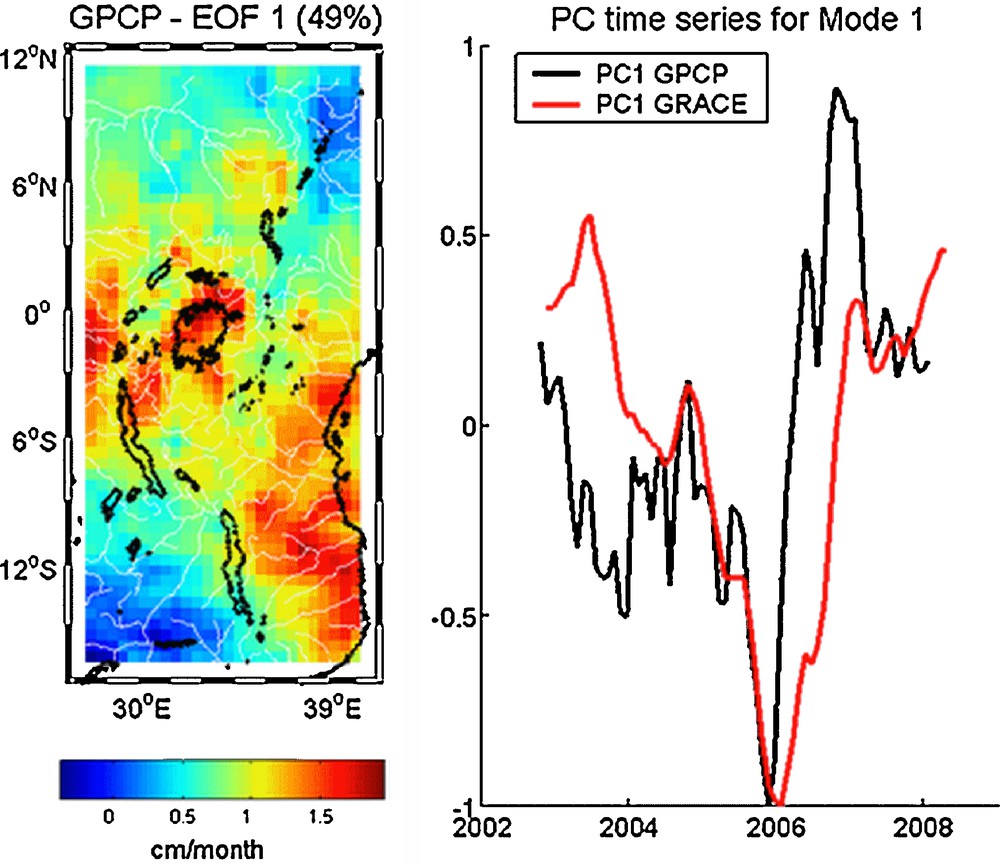
Mode 1 of the EOF decomposition of precipitation from GPCP over East Africa (2002–2008). The percentage of variance explained by the first mode is 49%. The left panel represents the geographical pattern whereas the right panel represents the temporal variation of the precipitation (black) and the temporal variation of PC1 of GRACE data over East Africa (red) over the same period. The correlation coefficient between the two signals is 0.49, significant at more than 95%.
Mode 1 de la décomposition en EOF des précipitations GPCP sur l’Afrique de l’Est, (2002–2008). Le pourcentage de variance expliquée par le premier mode est de 49 %. La figure de gauche représente le mode spatial alors que la figure de droite représente la variation temporelle des précipitations (en noir) et la variation temporelle des données GRACE PC1 sur l’Afrique de l’Est (en rouge) sur la même période. Le coefficient de corrélation entre les deux signaux est de 0,49, significatif à plus de 95 %.
4.2 GRACE data and the Indian Ocean Dipole
Several analyses have discussed the relationship between sea surface temperature (SST) of the Indian Ocean and rainfall in East Africa (Birkett et al., 1999; Clark et al., 2003; Goddard and Graham, 1999; Hastenrath, 2007; Latif et al., 1999; Trenberth, 1984; Webster et al., 1999). It is therefore reasonable to assume that SST anomalies associated with Indian Ocean Dipole (IOD) have an influence on adjacent moisture surfaces (Reason, 2002), hence on TWS. The IOD is an ocean-atmosphere interaction, over the Indian Ocean, with alternate positive and negative SST anomalies (Reason, 2002). During the positive phase, there is flooding in East Africa, while the Indian summer monsoon remains above normal, and drought in Indonesia and in several regions of Australia. The IOD usually begins to develop during summer of the northern hemisphere, reaches its maximum during fall and ends in winter as a result of strong seasonal winds (Behera and Yamagata, 2001; Black et al., 2003; Hastenrath, 2007). Horii et al. (Horii et al., 2008) documented the precondition and evolution of the 2006 IOD. The subsurface negative temperature anomalies in the eastern part of the Indian Ocean (1.5°S, 90°E) started in May 2006, about 3 months earlier than the development of surface signatures. The subsurface negative temperature anomalies in the eastern part of the Indian Ocean were associated with unusual westward surface currents and an anomalous easterly wind event in May. These anomalous conditions at the thermocline depth ended between February and March 2007, a few months later than the disappearance of the surface IOD signals. We investigated the steric sea level in the Indian Ocean using temperature data from the Argo profiling floats (Roemmich and Owens, 2000). Steric sea level anomalies have been computed by Guinehut et al. (Guinehut et al., 2009) using ocean temperature and salinity anomalies from the surface down to 900 m depth. We performed an EOF decomposition of the steric sea level grids over the Indian Ocean for the 2002–2007 time span. We removed the annual signal and applied a 6-month smoothing filter as for GRACE and precipitation data. Fig. 5 shows the first leading mode (30% of the total variance) of the steric sea level EOF decomposition. The IOD is clearly evidenced by the geographical pattern associated with the first EOF, confirming observations of Horii et al. (Horii et al., 2008). We observe a decrease of the steric sea level from 2002 to 2006 with a minimum in May 2004, then a sudden increase from late 2005 to 2006, as observed in East Africa precipitation pattern. On Fig. 5, the Argo PC1 (temporal curve) is superimposed on the GRACE TWS PC1 computed over the East African lake region. We note a good agreement between the two curves. The corresponding correlation coefficient is 0.64. Moreover, we note that the correlation coefficient between Argo PC1 and GPCP PC1 is 0.80 (not shown on the figure), confirming the strong link between West Indian Ocean temperature (in fact here, ocean heat content and thermal expansion) and precipitation over East Africa. Fig. 5 shows the second leading mode (16% of the total variance) of the steric sea level EOF decomposition. We observe a quasi-periodic oscillation (2-year period) in the temporal curve. We superimposed the GRACE TWS PC2. As for PC1, a good correlation coefficient (amounting 0.75) is noticed between the two curves. Webster et al. (Webster et al., 1999) reported a 2-year periodicity in SST gradients along the equator, linking two anomalous states: warm in the west and cool in the east, and cool in the west and warm in the east. The cool SST anomalies lead to less evaporation and less rain, while warm SST anomalies lead to enhanced evaporation and more rain. SST anomalies during the IOD events are strongly coupled to surface wind anomalies in the central equatorial Indian Ocean (Saji et al., 1999; Saji and Yamagata, 2003a). In this study, we show that the 2-year periodicity also affects West Indian Ocean heat content and East Africa total water storage.
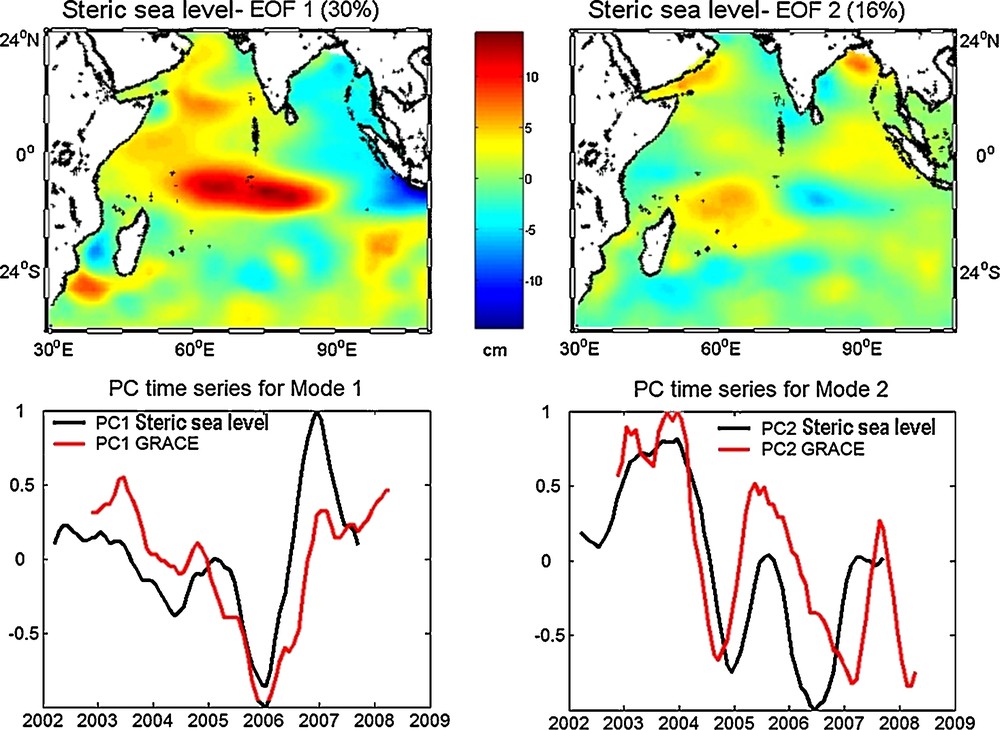
Mode 1 (left) and mode 2 (right) of the EOF decomposition of steric sea level anomalies from Argo data over the Indian Ocean (2002–2008). The upper panel represents the geographical pattern, the percentage of variance explained by the first mode is 30% and second mode is 16%. Whereas the lower panel represents the temporal variation of the steric sea level (black) and the temporal variation of PC of GRACE TWS over East Africa (red). The correlation coefficient between the PC1 steric sea level and PC1 GRACE TWS is 0.65 and equal to 0.72 between the PC2 steric sea level and PC2 GRACE TWS, both are significant at more than 95%.
Mode 1 (à gauche) et mode 2 (à droite) de la décomposition en EOF du niveau de la mer d’origine stérique fourni par les données Argo sur l’océan Indien, entre 2002 et 2008. Le panneau supérieur de la figure représente le mode spatial, le pourcentage de variance expliquée par le premier mode est de 30 % et le second mode est de 16 %. Le panneau inférieur représente la variation temporelle du niveau de la mer d’origine stérique PC1/PC2 (noir) et la variation temporelle des données TWS de GRACE PC1/PC2 de l’Afrique de l’Est (en rouge) sur la même période. Les coefficients de corrélation entre le PC1/PC2 du TWS de GRACE et le PC1/PC2 du niveau de la mer d’origine stérique sont de 0,65 et 0,72, significatifs à plus de 95 %.
4.3 GRACE data and ENSO
Several studies have suggested a link between El Niño-Southern Oscillation (ENSO), Indian Ocean temperature and East African rainfall (Birkett et al., 1999; Black et al., 2003; Clark et al., 2003; Goddard and Graham, 1999; Latif et al., 1999; Mercier et al., 2002; Ummenhofer et al., 2009). Recent studies have shown that a significant proportion of the IOD events occurred independently of ENSO and a significant proportion of ENSO events were independent of IOD (Ashok et al., 2003; Behera et al., 2006; Hong et al., 2008; Lau and Nath, 2004; Saji and Yamagata, 2003a; Saji and Yamagata, 2003b). The most recent occurrence of El Niño started in September 2006 and lasted until early 2007 and that of La Niña in 2007/2008, while three IOD events have been reported recently (in 2006, 2007 and 2008; (Cai et al., 2009; Horii et al., 2008; Saji et al., 1999; Vinayachandran et al., 2007)). Consequently, we expect that even a weak ENSO can be correlated with TWS variations over East Africa. To compare GRACE TWS over East Africa with ENSO, we used the Southern Oscillation Index (SOI) defined as the difference in atmospheric pressure anomalies between Tahiti and Darwin (Trenberth, 1984), smoothed with the same 6-month window as for GRACE data. In Fig. 6, are displayed the principal component time series of the third mode (PC3) of GRACE TWS and scaled SOI. The correlation coefficient between the two is equal to 0.55, with variable lag in the range 0 to 6 months. For the 2005–2008 period, the correlation coefficient between the two series is equal to 0.80. This supports the hypothesis that the third EOF mode of TWS (explaining only 9% of the total variance) is related to the ENSO cycle.
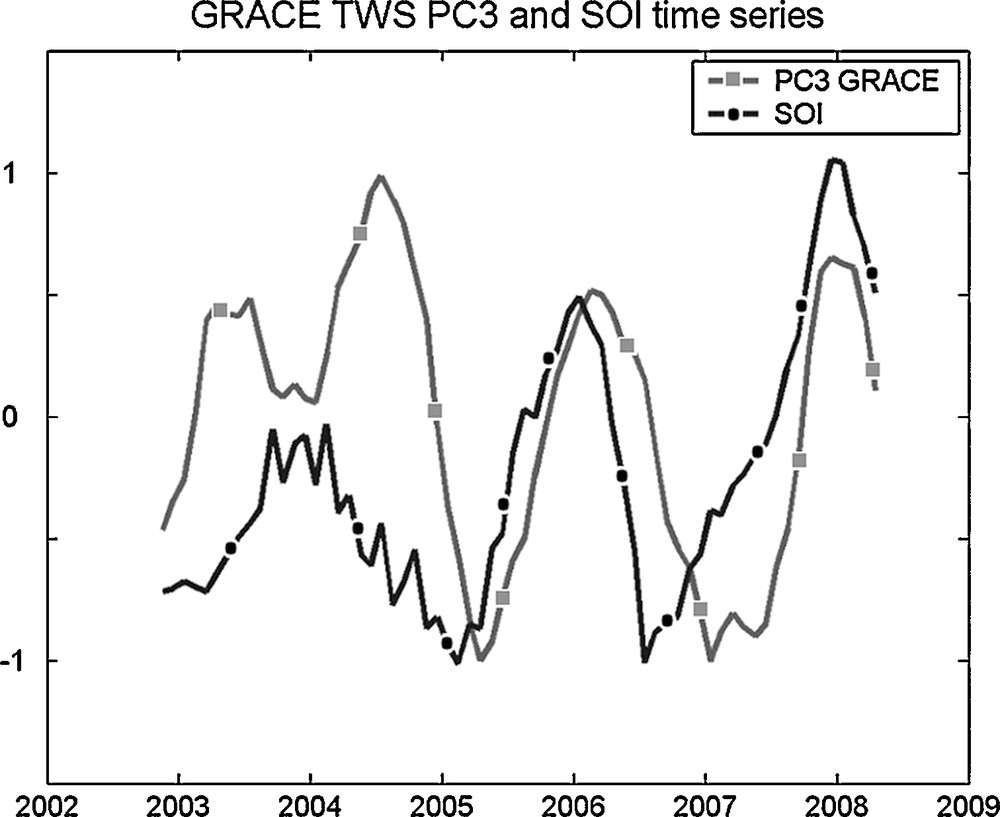
Mode 3 of the EOF decomposition of GRACE TWS (square) over East Africa and scaled SOI (circle), between 2002 and 2008. The correlation coefficient between the two signals is 0.55, significant at more than 95%.
Mode 3 de la décomposition en EOF des données TWS de GRACE (carré) sur l’Afrique de l’Est et le SOI redimensionné (cercle), entre 2002 et 2008. Le coefficient de corrélation entre les deux signaux est de 0,55, significatif à plus de 95 %.
Comparison between total water storage from GRACE and surface water volume change from altimetry; inference on soil moisture and groundwater and comparison with outputs of the WGHM hydrological model.
We have combined GRACE TWS with satellite altimetry-derived lake water volume, to estimate soil moisture and groundwater variations over each lake drainage basin. Rodell and Famiglietti (Rodell and Famiglietti, 2001) suggested that the GRACE resolution was insufficient to study basins smaller than 200,000 km2. For Lake Victoria and Lake Tanganyika, the drainage basin areas are 261,800 and 252,600 km2 (Table 1). However, Lake Malawi and Lake Turkana basins are considerably smaller, with areas of 156,000 and 137,610 km2, respectively (Table 1). Nevertheless, latest GRACE data have improved precision and resolution and allow studying smaller basins.
We have averaged GRACE-based water storage over the four lake drainage basins. Their location is shown in Fig. 1 and characteristics summarized in Table 1. To estimate individual lake drainage basin contribution, we simply spatially average, for each month, GRACE equivalent water height over the area included inside the basin, then multiply it by the basin area to estimate water storage (in km3). A potentially important source of error affecting the basin-averaged water storage time series is the leakage from surrounding basins. Because of the GRACE resolution, water mass signals outside the domain limited by the mask may leak into the considered region, thus polluting the estimated water storage. We have estimated this error as in Ramillien et al. (Ramillien et al., 2008). We consider global monthly grids of total water storage – canopy, surface, soil and underground water plus snow – outputs from WGHM over the time span of analysis. Conceptually, WGHM provides water storage information that is directly comparable to GRACE TWS (whatever the precision of the model). For each month, the global model grid is modified by setting zero values over the considered river basin, keeping the model values outside the basin. This modified data set is then expanded in spherical harmonics up to degree 60 (equivalent to the GRACE resolution). The leakage signal is then estimated by convoluting this spherical harmonic expansion with that of the geographical mask representing the lake drainage basin (see Ramillien et al. (Ramillien et al., 2008), for more details). As noted previously, the leakage signal is mainly seasonal and on the order of 3% of the “model” annual signal on the four lake drainage basins. In terms of interannual variability, the error is negligible. In the following, we do not account for this effect any further.
GRACE data cannot be directly compared to the altimetry-based lake water volume time series, because the GRACE data processing (in particular the smoothing) reduces the TWS signal compared to the “true” signal (Swenson et and Wahr, 2002; Chambers, 2006; Chen et al., 2007). To determine what scaling apply to GRACE data, we do the flowing: we consider 0.5° × 0.5° outputs from WGHM over the studied region. For each lake drainage basin, we apply the same spatial smoothing to WGHM grids as for GRACE data (Gaussian filter of half-weight radius 300 km) to TWS of WGHM and compute the reduction, time variable, factor compared to unsmoothed data. We focus on the interannual time scale and to estimate the scaling factor, we remove the annual signal. The mean scaling factor obtained for lakes Turkana, Victoria and Tanganyika is 1.1 and for Lake Malawi is 1.2.
Fig. 7 (left panel) shows, for each lake, the lake water volume (from altimetry) superimposed to GRACE TWS (scaling factor applied). In the right panel on Fig. 7, we compare the subsurface water (sum of soil moisture and groundwater) volume change (rescaled GRACE TWS minus altimetry-derived lake volume) with the WGHM outputs (after application of the same Gaussian filter of half-weight radius 300 km). Only soil moisture and groundwater components of the model are considered, because in this semi-arid region: snow, canopy and the surface storage in rivers and reservoirs are insignificant. For Lake Turkana, the total volume of water in the basin is governed by the surface water of the lake (Fig 7a). The correlation coefficient between surface water volume and TWS is 0.60. The subsurface water component has two peaks, which occurred in mid 2005 and late 2006 (Fig. 7e). For Lake Victoria, the volume of water in the basin is also mainly governed by the surface water of the lake (Fig. 7b). The correlation coefficient between surface water volume and TWS is 0.93. TWS and surface water volume show a sharp increase from 2006 to 2007. We note (Fig. 7f) that the subsurface water component increases between 2006 to early 2007, where it reaches its maximum. Lake Tanganyika surface water volume represents a small fraction of TWS variations (Fig. 7c). The correlation coefficient between surface water and TWS is 0.62. A sharp increase in 2006 is observed for Lake Tanganyika. The corresponding subsurface water component (Fig. 7g) shows oscillations, with a minimum in early 2006 and a maximum in early 2007. Therefore, the water volume of Lake Tanganyika drainage basin is mainly governed by the groundwater. For Lake Malawi, surface water volume and TWS (Fig. 7d) are well correlated (0.72). The volume of water in the basin is governed by the surface water of the lake until 2006. The variability of the subsurface water component (Fig. 7h) shows a positive linear trend of 3.7 km3/year. Abrupt changes in TWS and surface water volumes for all lakes are observed between 2006 and 2007. These are directly correlated with the strong positive and negative episodes of IOD in 2006–2007. In terms of interannual fluctuations of subsurface water, we note a very good correlation coefficient between observations and model results. Especially for Lake Tanganyika (correlation coefficient of 0.93) but the amplitudes appear to differ by about a factor of two, and for Lake Victoria with a correlation coefficient of 0.60 and similar amplitudes.
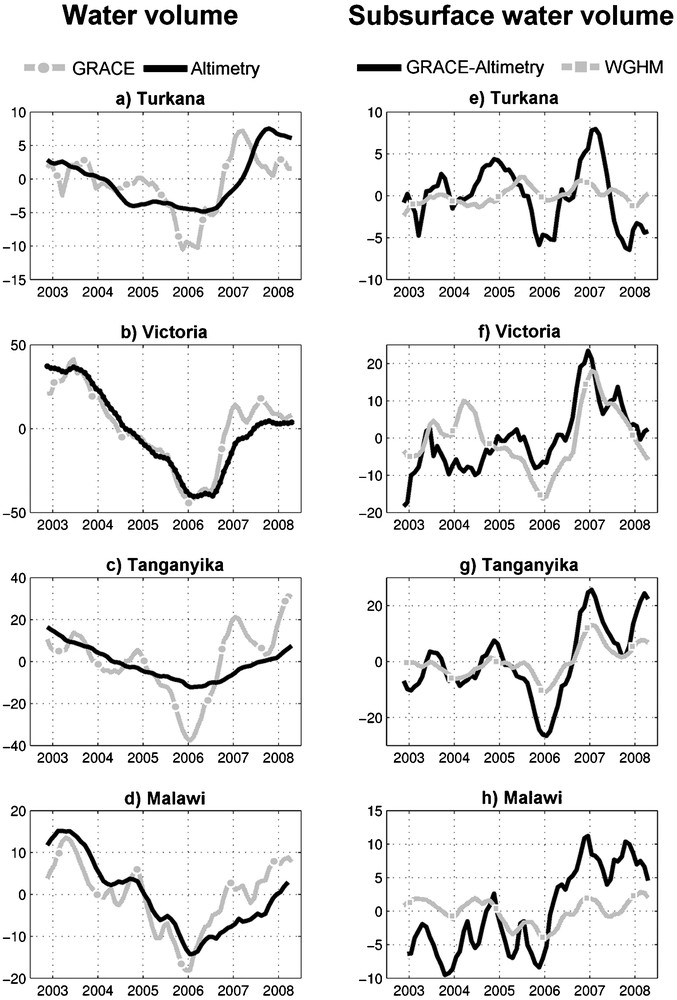
Left panel: changes in volume (km3) of the GRACE TWS in the basin (square) and surface water of the lake from altimetry satellite (triangle). Right panel: changes in volume (km3) of the soil moisture and groundwater: GRACE-Altimetry (diamond) and WGHM outputs (circle). The annual signal is removed and data are smoothed with a 6-month window.
Figures de gauche : évolution du volume pour chaque bassin (km3) du TWS de GRACE (carré) et des eaux de surface des lacs à partir de l’altimétrie (triangle). Figures de droite : évolution du volume (km3) de l’humidité du sol et des eaux souterraines : GRACE-Altimétrie (losange) et WGHM (cercle). Le signal saisonnier a été filtré et les données ont été lissées avec une moyenne glissante de six mois.
5 Conclusion
We have investigated TWS and surface water storage changes over the East African Lake region during 2002–2008 and their link with precipitation and IOD. We find that precipitation and TWS from GRACE show a common mode of variability at interannual time scale, with a minimum late 2005 and a sharp rise in 2006–2007. We show that this event is due to forcing by the 2006 IOD on East African rainfall. We also show that GRACE-inferred water storage is related to the El Niño-Southern Oscillation cycle. This study also shows that combining satellite altimetry-based water volumes with TWS from GRACE provides new information on soil moisture and groundwater. This offers interesting perspective, in particular for detecting subsurface water storage changes associated with climate variability and human activities. TWS from GRACE is very helpful as it provides an integrated information on water storage change, not available from in situ measurements (in most regions information on soil moisture and groundwater does not exist and gauging networks on rivers and lakes are drastically decreasing since the early 1980s (Kundzewicz et al., 2004)). It is a valuable tool for hydrological studies and is especially important for separating hydrological components. The combination with other data sources is essential to maximize the benefit of GRACE data.
Acknowledgments
This work is supported by CYMENT project of the RTRA “Sciences et technologies pour l’aéronautique et l’espace (STAE)”. The altimeter products were produced by SSALTO/DUACS and distributed by AVISO with support from CNES. We thank S. Guinehut from CLS for providing steric sea level grids from Argo. Many thanks go to Professor Pierre Ribstein and the two anonymous reviewers for their helpful comments and suggestions. GRACE data were processed by D. P. Chambers, supported by the NASA Earth Science REASoN GRACE Project, and are available at http://grace.jpl.nasa.gov.