1 Introduction
The IPCC Fourth Assessment Report (IPCC AR4) published in 2007 provides a synthesis of recent progress realized in precisely measuring global mean sea level change as well as understanding causes of the observed rise [4]. For the last 15 years, sea level is routinely measured by satellite altimetry from Topex/Poseidon and Jason satellites [2,6].1 Quasi global in situ ocean temperature data available for the past few decades have allowed the quantification of the contribution of ocean warming to sea level rise. Glaciers and ice sheets mass balance estimated from in situ and remote sensing observations have also provided important information on the land ice contribution to sea level. The land water storage component can now be determined from space-based gravity data of the recently launched GRACE mission. In addition, GRACE allows a direct estimate of the ocean mass component to sea level change, and when combined with satellite altimetry, provides a measure of thermal expansion, totally independent of in situ ocean temperature data. In this review, we briefly summarize recent sea level results and discuss new developments, in particular since 2003.
2 Satellite altimetry observations of sea level change
We now have a 15-year old time series of global sea level change measurements from the Topex/Poseidon and Jason-1 satellites. Fig. 1 shows the global mean sea level curve since January 1993 computed at Collecte Localisation Satellite (CLS) (data available on the AVISO web site: www.aviso.fr). This curve is based on Topex/Poseidon data from January 1993 to September 2002, a combination of Topex/Poseidon and Jason-1 between September 2002 and November 2005, and Jason-1 data alone since then. Data are averaged between 65°S to 65°N latitude. All geophysical and environmental corrections to sea level data have been applied.1 In Fig. 1, annual and semiannual cycles have been removed and a three-month smoothing has been applied to the raw 10-day global mean sea level values. The global mean sea level increases almost linearly except at the end of the period where the rate is slightly reduced. The linear trend computed over the whole time span (January 1993 to February 2008) amounts 3.1 ± 0.1 mm/yr. This rate agrees well with earlier estimates (e.g., [2,6]). The 0.1 mm/yr uncertainty quoted above represents the formal error. According to Mitchum [33] and Leuliette et al. [24], comparison between altimetry-based sea level change and tide gauge records over their overlapping time span suggests a more realistic error of 0.4 mm/yr. Such a value is considered below. A small correction of –0.3 mm/yr due to the global deformation of ocean basins in response to postglacial rebound (or glacial isostatic adjustment [GIA]) has to be subtracted from the above trend, leading to a rate of sea level rise of 3.4 ± 0.4 mm/yr for 1993–2008.2
For the past century, the rate of sea level rise is estimated from tide gauges data (e.g., [16,17,19,44]) and from reconstruction methods that combine tide gauge records and regional variability from Topex/Poseidon altimetry [10], thermal expansion data [3] or general ocean circulation model outputs.3 Fig. 2 shows the global mean sea level evolution over the past century from some of the above studies. Over the past 50 years, these studies report a mean rate of sea level rise on the order of 1.7 mm/yr. Although over the whole 20th century sea level rise is not linear, as illustrated in Fig. 2, a linear approximation also leads to a mean of ≈ 1.7 mm/yr since 1900 [11,17,19]. It is worth mentioning that a recent study, taking into account vertical crustal motions at tide gauge sites, obtains a smaller rate of 1.3 ± 0.3 mm/yr for the 20th century [44].
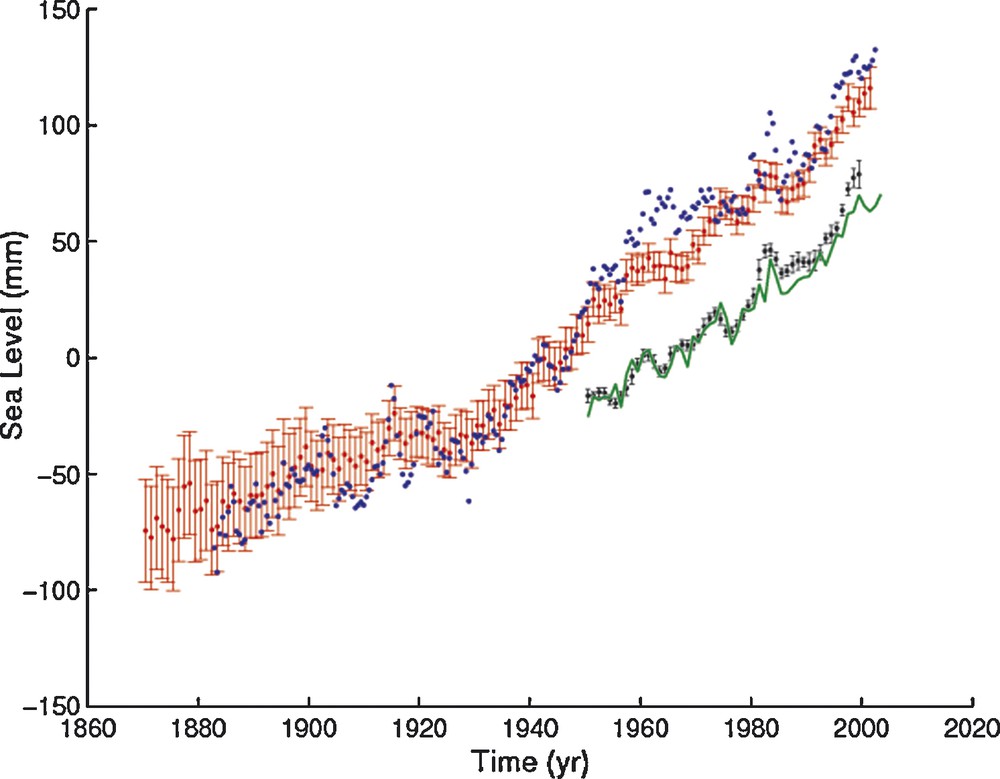
Sea level curve for the 20th century based on different tide gauges data and reconstruction analyses. Red dots: data from [11]; Blue dots: data from [19]; Black dots: data from [16]; Green curve.3
Évolution du niveau de la mer mesurée au cours du xxesiècle d’après diverses reconstructions utilisant les enregistrements marégraphiques. Points rouges : données de [11] ; points bleus : données de [19] ; points noirs : données de [16] ; courbe verte.3
Compared to the past century, the altimetry-derived sea level is clearly rising faster, although the rate is not exceptionally high. In effect, decadal sea level fluctuations are commonly observed in long-term tide gauge records, so that the higher rate reported by satellite altimetry over the 15 years may eventually reflect decadal variability. Holgate [17] and Jevrejeva et al. [19] have computed global mean rates over the 20th century and report fluctuations on decadal time scales. For example, sea level rates from the Church and White [11] and Jevrejeva et al. [19] data sets show oscillations in the 2–20 years waveband, possibly linked to internal variability of the ocean–atmosphere system. Shorter oscillations are likely related to El Niño-Southern Oscillation (ENSO) events. However, we cannot exclude that the 3 mm/yr rate observed since the early 1990s reflects an acceleration linked to present-day global warming.
Tide gauges data had previously indicated that sea level is not rising uniformly. However, until the advent of altimeter satellites and their global coverage of the oceans, it was not possible to map the geographical variability in rates of sea level change. Fig. 3 shows the spatial patterns in sea level trends over 1993–2008 computed with Topex/Poseidon and Jason-1 altimetry data (completed by Envisat and GFO altimetry data). Over this time span, an important regional variability is visible. Some regions, in particular the western Pacific, exhibit rates of sea level rise of up to five times the global mean. In other regions (e.g., the eastern Pacific) sea level has been falling during the last 15 years. Spatial patterns in the tropical Pacific are dominated by the signature of the 1997–1998 ENSO event. We discuss the cause of the regional variability in the next section.
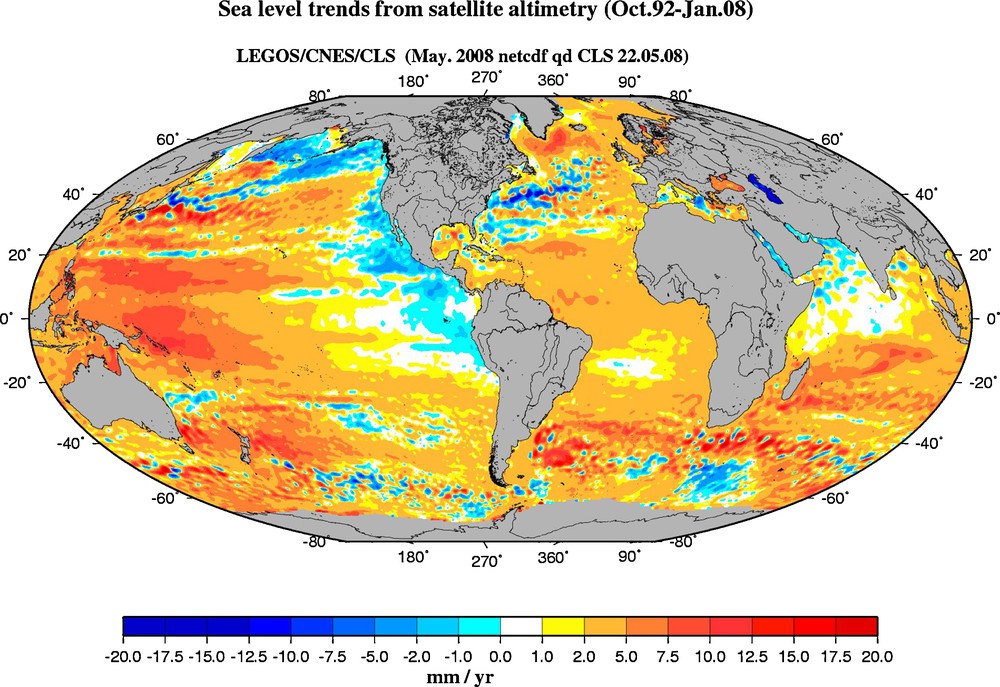
Geographical distribution of linear sea level trends computed over 1993–2008 from multisatellite altimetry.
Distribution géographique des vitesses de variation du niveau de la mer entre 1993 et 2008 basées sur les données altimétriques multisatellites.
3 Quantifying the processes causing present-day sea level change
Interannual/decadal changes in global mean sea level result from changes in ocean temperature (thermal expansion), in the volume of land ice and in the amount of water stored in terrestrial reservoirs. We successively examine below the current knowledge of each contribution.
3.1 Ocean temperature change
The thermal expansion of seawater in response to ocean warming results in a sea level rise. More generally, seawater density changes (e.g., due to salinity variations) cause sea level changes. The combined contributions to sea level of temperature and salinity are called steric. In the recent years, several global ocean temperature data sets – based on in situ hydrographic measurements – have been made available (e.g., [15,18,25,42]). The Levitus et al. [25] and Ishii et al. [18] data sets consist of yearly/monthly global grids of ocean temperature data down to 3000 m/700 m for the period 1950–2005. Guinehut et al. [15] and Willis et al. [42] data combine in situ hydrographic data with satellite altimetry data. Data are also given as global grids down to 750 and 700 m respectively, starting in January 1993. Levitus et al. [25] computed the change in ocean heat content over the past 50 years and showed that heat stored by the oceans over this period dominates the thermal budget of the climate system (i.e., heat stored by atmosphere and land are smaller by factors of 15 and 10 respectively than heat stored in the oceans). This results from the huge mass of the ocean and the large heat capacity of seawater.
By vertically integrating temperature anomalies (first expressed in terms of density anomalies), one can compute, at each time step and each grid mesh, the steric sea level. Over the last 50 years, the global mean steric sea level shows a positive trend (of 0.2–0.4 mm/yr depending on the depth of integration), on which is superimposed large decadal fluctuations [1,18].
For the recent years, the rate of steric sea level has increased compared to the previous decades, with a mean contribution to sea level of 1.5 ± 0.3 mm/yr over 1993–2003. Thus, the higher sea level rise observed during the 1990s by satellite altimetry may at least partly result from an increase in thermal expansion.
Like observed sea level trends, thermal expansion trends are not spatially uniform, as illustrated in Fig. 4a (Fig. 4a shows the spatial patterns of thermal expansion trends for 1993–2003 using data from Guinehut et al. [15]). Spatial patterns of steric sea level over 1993–2003 agree well with observed patterns, an indication that nonuniform thermal expansion (hence nonuniform ocean heat content change) is the main cause of regional variability in sea level trends. Recent studies based on ocean general circulations models, either with data assimilation (e.g., [45]) or not [28], confirm that regional patterns in sea level change reported by satellite altimetry are mainly due to regional variability in thermal expansion. However, salinity changes are not negligible at regional scale (although at global scale, salinity has negligible effect on sea level). As shown by Lombard et al. [28] using the MERCATOR high-resolution ocean circulation model without assimilation over 1993–2001, in many oceanic regions, temperature and salinity contributions compensate each other. It is indeed the net effect that is responsible for the trend patterns seen in Fig. 3.
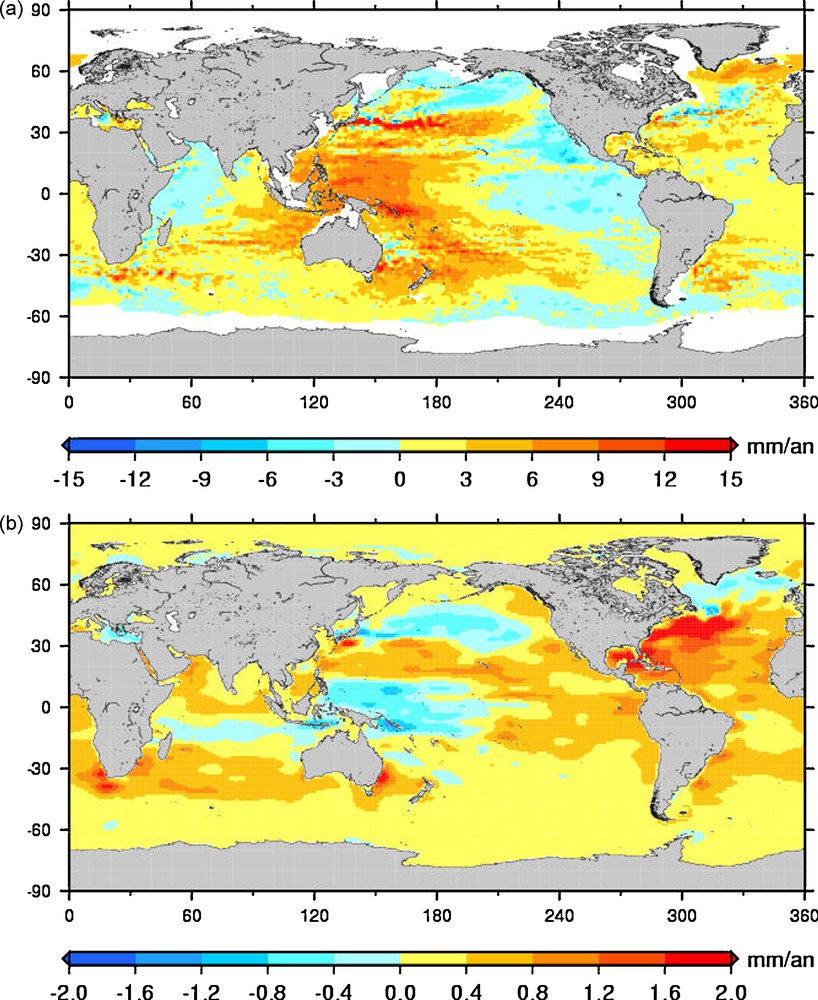
a. Spatial patterns in thermal expansion trends over 1993–2003 (data from [15]). b. Spatial patterns in thermal expansion trends over 1955–2003 (data from [18]).
a. Tendances spatiales de l’expansion thermique sur 1993–2003 (données de[15]). b. Tendances spatiales de l’expansion thermique sur 1955–2003 (données de[18]).
Comparing thermal expansion trends (using in situ ocean temperature data) for 1993–2003 (Fig. 4a) with those computed over a longer period (1955–2003; see Fig. 4b) shows quite different geographical distribution. Lombard et al. [26] showed that the spatial patterns of thermal expansion are subject to strong decadal variability related to ENSO, Pacific Decadal Oscillation (PDO), and North Atlantic Oscillation (NAO) phenomena. This has led to the suggestion that sea level trends distribution observed by satellite altimetry over the recent years is likely nonstationary with time and will certainly evolve in the future towards different geographical patterns.
3.2 Land ice contribution
Change in the volume of land ice results from mountain glaciers melting and change in mass of the ice sheets. Several estimates have appeared in the literature recently. These are summarized below.
3.2.1 Mountain glaciers
Being very sensitive to global warming, mountain glaciers and small ice caps have retreated worldwide in the recent decades, with significant acceleration during the early 1990s. From mass balance studies of a large number of glaciers, Dyurgerov and Meier [14] and Cogley [12] have estimated the glaciers ice melt contribution to sea level over the past four decades. These authors find an average positive contribution to sea level rise of 0.5 mm/yr since 1960, with a significant acceleration during the 1990s. For the period 1993–2003, they estimate the glaciers contribution to sea level to 0.8 ± 0.17 mm/yr (see [21] for a review). Most recent estimates (e.g., [31]) suggest an acceleration in glacier melting since 2003 (see section 4).
3.2.2 Greenland and Antarctica
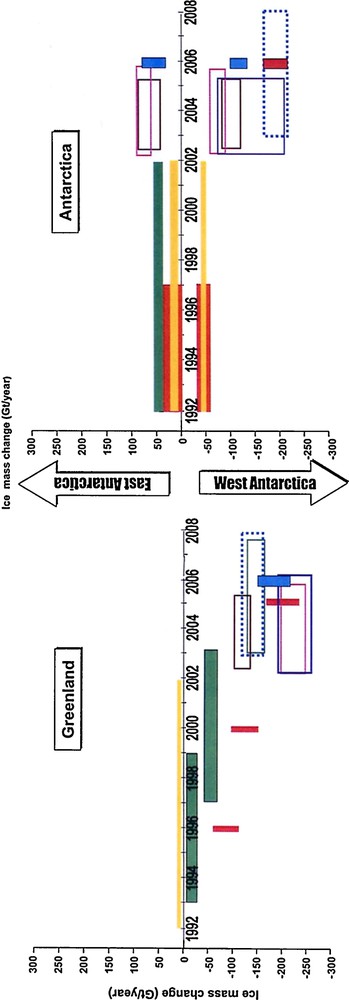
Since the early 1990s, remote sensing observations based on airborne laser and satellite radar altimetry, and Synthetic Aperture Radar Interferometry (INSAR) techniques have provided estimates of the mass balance of the ice sheets. These observations indicate accelerated ice mass loss in the recent years in coastal regions of southern Greenland, about 50% by surface melting and runoff into the sea, and 50% by outlet glaciers motion draining ice from the interior (e.g., [22,37]). In contrast, slight mass gain is reported from satellite altimetry in central high-elevation regions [20,46].
Over Antarctica, remote sensing techniques report accelerated ice mass loss in the western part of the continent (e.g., [39]) while the eastern region is slightly gaining mass as a result of a small increase in snow precipitation [13,46]. Because of these contrasting behaviors (mass loss in coastal regions and mass gain in elevated central regions), the Antarctica ice sheet is nearly in balance, with mass loss slightly dominating mass gain. Thus Antarctica as a whole only slightly contributed to sea level during the last 1–2 decades.
Since 2002, the GRACE mission provides a new tool for directly measuring the mass balance of the ice sheets, with nearly complete coverage of high-latitude regions. The basic quantity measured by GRACE is spatiotemporal change of the Earth’s gravity field, which can be converted, over the ice sheets, into ice mass change, upon the assumption that the observed gravity change results from surface mass change.
Over Greenland, recent GRACE results [9,29,35,40] confirm altimetry results, i.e., net ice mass loss, although quite large dispersion between the different investigations is noticed. Over Antarctica, GRACE observations suggest mass loss on average over the past five years [8,35,41]. These results, however, should be considered as still preliminary considering the very short time span of GRACE observations and the significant contamination of GIA, in particular for Antarctica (GRACE cannot separate ice mass change from solid Earth mass redistribution due to GIA; over Antarctica, the GIA signal is significant).
Fig. 5 presents a synthesis of recent Greenland and Antarctica ice mass changes based on the different remote sensing techniques (updated from Cazenave [5]). For Antarctica, results from Cazenave et al., Luthcke et al., Rignot et al., [29,38] and Velicogna et Wahr [41] are for the whole ice sheet. Other results concern either West or East Antarctica.4 Fig. 5 suggests recent acceleration of Greenland and West Antarctica ice mass loss.
Over 1993–2003, average contributions from Greenland and Antarctica to sea level rise are 0.2 ± 0.04 mm/yr and 0.21 ± 0.17 mm/yr respectively [23].
3.3 Land water storage contribution
Change in land water storage, due to natural climate variability and human activities, is another potential contribution to sea level change. Anthropogenic changes in the amount of water stored in soils, reservoirs and aquifers result from dam building, underground water mining, irrigation, urbanization, deforestation, etc. Model-based estimates of land water storage change caused by natural climate variability suggest no long-term contribution to sea level although interannual/decadal fluctuations may be significant [32,34]. The study of Ngo-Duc et al. [34] reports large decadal fluctuations in sea level of 1–2 mm amplitude, due to change in land water storage. These sea level fluctuations appear highly correlated to detrended thermal expansion variations, suggesting partial compensation between land waters and thermal expansion on decadal time scale.
For the recent years, GRACE observations can be used to estimate the total (i.e., due to climate variability and human activities) land water contribution to sea level. Ramillien et al. [36] estimated the water volume change in the 27 largest river basins worldwide using GRACE data over mid-2003–mid-2006 and found either positive or negative water volume change over that period depending on the location of the river basins. The net water volume change is slightly negative (i.e., water loss) corresponding to 0.2 ± 0.1 mm/yr sea level rise over that period.
In conclusion, land waters have potentially significant contribution to sea level on interannual time scale. On the long term, they play a minor role (at least for the past decades).
3.4 Sea level budget over 1993–2003
Table 1 presents the climate-related contributions discussed above over 1993–2003. Their sum amounts to ≈ 2.7 mm/yr. Although the land waters contribution has been estimated for the recent years only (beyond 2003), we assume that it is also representative of the previous decade. We then obtain for 1993–2003, a total climate-related contribution of ≈ 3 mm/yr, in close agreement of the altimetry-derived rate of rise.
Sea level budget for 1993–2003 and 2003–2008
Bilan des différentes contributions au niveau de la mer pour les périodes 1993–2003 et 2003–2008
| Rate of sea level rise | 1993–2003 mm/yr | 2003–2008 mm/yr |
| 1. Thermal expansion | 1.6 ± 0.3 [4,26] | 0.37 ± 0.1 Argo4 |
| 2. Glaciers | 0.8 ± 0.1 [21] | 1.1 ± 0.25 [31] |
| Greenland | 0.2 ± 0.04 | 0.4 ± 0.05 |
| Antarctica | 0.2 ± 0.17 | 0.55 ± 0.06 |
| 3. Total ice sheets | 0.4 ± 0.2 [23] | 0.95 ± 0.14 |
| Land waters | 0.2 ± 0.1 [36] | |
| Sum of 1 + 2 + 3 + 4 | 3 ± 0.5 | 2.6 ± 0.3 |
| Observed (satellite altimetry GIA applied) | 3.1 ± 0.4 [4,6] | 2.5 ± 0.41 |
4 Recent developments
Since 2003, in situ sea temperature data are mostly based on newly deployed profiling buoys from the international Argo program. Preliminary Argo-based thermal expansion estimates displayed a negative trend since about 2003 [30]. However, instrumental problems were subsequently reported on some Argo buoys (see Argo web site: www.argo.ucsd.edu), giving rise to a cold bias, hence artificial ocean cooling. In addition, difference in data sampling between XBT networks (with very poor coverage of remote southern oceans) largely used until 2003 and global Argo coverage, plus internal systematic bias between the two systems, could explain the sudden change in steric sea level trend. Using corrected Argo data, Willis et al. [43] reestimated the global mean steric sea level since 2003 and found a quasi flat curve, suggesting that ocean warming has stalled since then.
As observed sea level has continued to rise beyond 2003, although at a reduced rate compared to the previous decade (of 2.5 ± 0.4 mm/yr1), this observation is puzzling. Could the recent acceleration in land ice shrinkage account for the recent sea level rise?
GRACE data averaged over the oceans provides an answer to that question, through a measure of the change in ocean mass as a result of freshwater mass increase or decrease [7,27]. Lombard et al. [27] looked at the interannual time scale and estimated the ocean mass change to ≈ 1.3 ± 0.4 mm/yr over 2002–2006. Recently, Cazenave et al.4 revisited the ocean mass component using newly released GRACE data covering a longer time span and obtained an ocean mass increase of 1.9 ± 0.1 mm/yr over 2003–2008 (after applying a GIA correction of 2 mm/yr, as proposed by Peltier et al.2). Thus the mass component now accounts for ≈ 75% of the observed sea level rise, compared to only 40% over 1993–2003. Such an increase in the mass of the oceans can be confirmed by independent estimates of glaciers and ice sheet contributions to sea level over the same time span. For example, Meier et al. [31] report accelerated glacier melting since 2003, leading to 1.1 ± 0.25 mm/yr equivalent sea level rise in year 2006. The mass balance of the ice sheets has been recently reevaluated using GRACE and other remote sensing techniques. For example, Rignot et al. [38] find an Antarctica contribution to sea level of 0.56 mm/yr for year 2006, in good agreement with the GRACE-based estimate (0.55 ± 0.06 mm/yr4). GRACE data also suggest an increased contribution of Greenland (of 0.4 ± 0.05 mm/yr4). Summing all land ice components leads to 2.1 ± 0.25 mm/yr equivalent sea level rise over 2003–2008 (hence ≈ 85% of the observed rate of rise), a value comparable to the GRACE-derived ocean mass over the same time span.
Lombard et al. [27] showed that combining satellite altimetry and GRACE data provides an estimate of the steric component. In effect, satellite altimetry represents the sum of thermal expansion and ocean mass change, while GRACE averaged over the oceans measures the ocean mass change component only. The “altimetry minus GRACE” steric sea level curve over 2003–2008 shows a slightly positive trend of 0.3 mm/yr, in good agreement with the Argo-based estimate over the same period.4 Fig. 6 compares observed sea level over 2003–2008 with total land ice plus land waters and steric components (estimated from Argo data and from the difference between altimetry minus GRACE over the ocean). The 2003–2008 sea level budget is presented in Table 1.
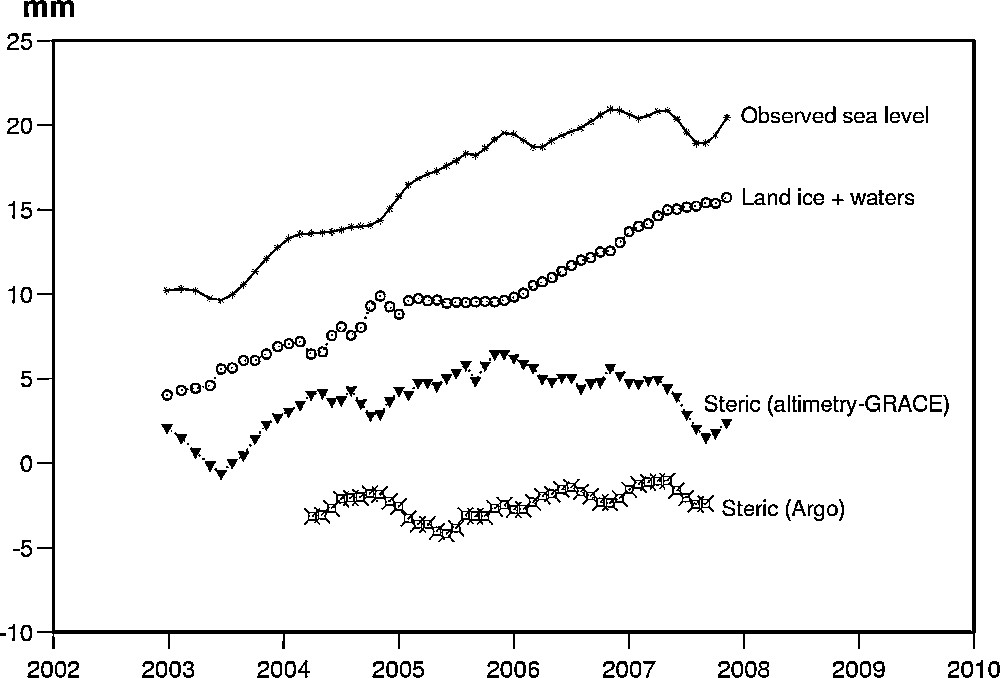
Sea level variations over 2003–2008 (from satellite altimetry: upper curve); sum of land ice plus land water (second curve from top); steric sea level estimated from the difference “altimetry minus GRACE” (third curve from top); steric sea level from Argo (bottom curve).
Variations du niveau de la mer, entre 2003 et 2008, observées par altimétrie spatiale (courbe du haut) ; contribution des glaces et eaux continentales (deuxième courbe à partir du haut) ; contribution stérique obtenue par différence « altimétrie moins GRACE » (troisième courbe à partir du haut) ; contribution stérique d’après Argo (courbe du bas).
5 Conclusion
Most recent developments indicate that sea level is currently rising, slightly faster since the early 1990s than during the previous decades. Owing to the progress realized in the recent years in understanding the causes of present-day sea level rise, we can nearly close the sea level budget. For the 1993–2003 time span, about 50% of the rate of sea level rise is due to ocean thermal expansion in response to ocean warming. Mountain glaciers and ice sheets mass loss plus a small land water contribution appear able to explain another 50%. Since 2003 ocean thermal expansion (based on Argo and other approaches) has significantly reduced while sea level has continued to rise. Direct and indirect estimates of land ice plus land waters contribution indicate that for 2003–2008, the ocean mass component dominates recent years sea level rise, explaining 75–85% of the observed rate. If, as most likely, recent thermal expansion pause is temporary, and if land ice shrinking continues to accelerate, sea level may cause some surprise in the near future. Recently launched Jason-2 satellite, the successor of Jason-1, will provide continuity in the monitoring of sea level variations from space. Ocean temperature and salinity measurements from Argo, mass balance of the ice sheets from GRACE and other remote sensing techniques, GRACE-based land water storage change and in situ and remote observations of mountain glaciers are absolutely crucial for understanding sea level evolution with time and its relationship with climate change. These observations also offer invaluable constraints to the climate models developed for future sea level projections.
1 M. Ablain, S. Guinehut, G. Valladeau, K. DoMinh and A. Cazenave, A new assessment of global mean sea level from altimeters highlights a reduction of global slope from 2005 to 2008 in agreement with in situ measurements, Ocean Sciences, (2008) (submitted).
2 W.R. Peltier, R. Drummond, S. Lutchke, On the origins of Earth rotation anomalies: new insights on the basis of both “old” data and GRACE data, (2008) (submitted). Sea level curve from Topex/Poseidon and Jason-1 satellite altimetry over 1993–2008 (data averaged over 65°N and 65°S; three-month smoothing applied to the raw 10-day data). Black: Topex/Poseidon; red: Topex/Poseidon plus Jason-1; blue: Jason-1. Évolution du niveau de la mer, entre 1993 et 2008, mesurée par les satellites altimétriques Topex/Poseidon et Jason-1 (données moyennes sur le domaine 65°N et 65°S de latitude ; un lissage sur trois mois a été effectué). Noir : Topex/Poseidon ; rouge : Topex/Poseidon plus Jason-1 ; bleu : Jason-1.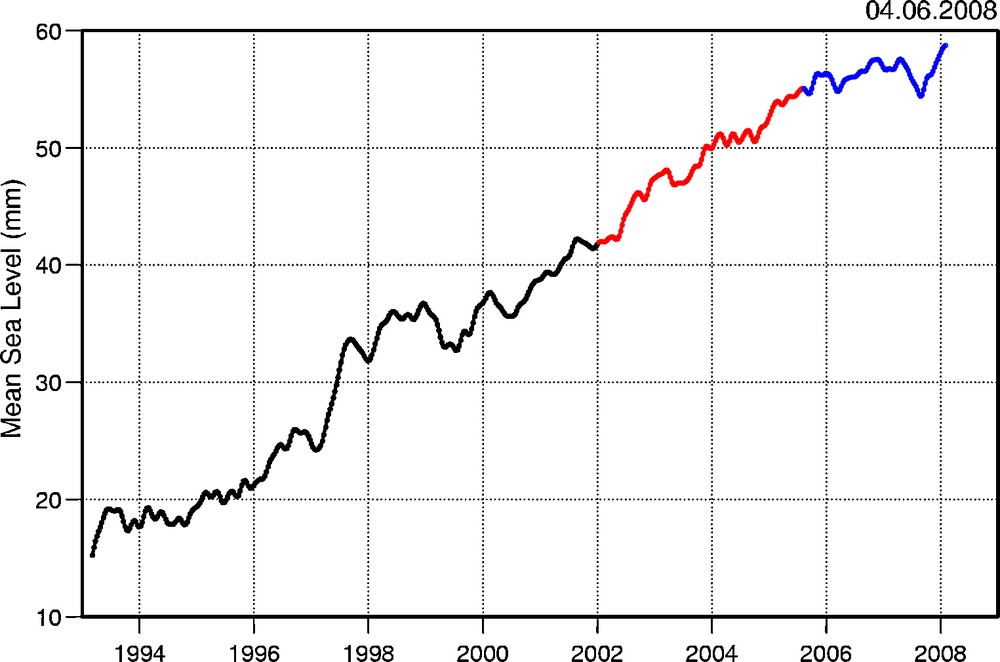
3 W. Llovel, A. Cazenave, P. Rogel, M. Berge-Nguyen, 2-D reconstruction of past sea level (1950–2003) using tide gauge records and spatial patterns from a general ocean circulation model, J. Climate (2008) (submitted).
4 A. Cazenave, K. Dominh, S. Guinehut, E. Berthier,W. Llovel G. Ramillien, M. Ablain, G. Larnicol, Sea level budget over 2003–2008: a reevaluation from GRACE space gravimetry, satellite altimetry and Argo, Global Planet. Change (2008) (submitted). Ice volume change of the ice sheets (in Gt/year) estimated over the recent years from different remote sensing techniques. Left panel: Greenland ice sheet; right panel: Antarctica ice sheet (updated from [5]). Variations du volume de glace des calottes polaires (en 109 tonnes/an), mesurées par différentes techniques spatiales. À gauche : Groenland ; à droite : Antarctique (d’après référence [5] mise à jour).