

Audio-MagnetoTellurics
EDIElectromagnetic Data Interchange file format
DFTDiscret Fourier Transformation
FFTFast Fourier Transformation
HFHigh Frequency band
LF1-5Low Frequency bands
MTMagnetoTellurics
TCPTransmission Control Protocol
TE-modeElectric field parallel to strike
TM-modeMagnetic field parallel to strike
1 Introduction
The Upper Rhine valley reveals favourable conditions for the exploitation of geothermal energy. This is supported by different local heat flow anomalies with a maximum of 140 mW/m2 at the geothermal site of Soultz-sous-Forêts (Schellschmidt and Clauser, 1996) and temperature anomalies at depth (Hurter and Schellschmidt, 2003). Local heat flow and temperature maxima in the Upper Rhine valley originate from a strong convectional heat transport mainly in the granitic basement (Bächler, 2003). Such systems may be exploited using Enhanced Geothermal System (EGS) technology. By definition, these systems are characterized by an appropriate temperature at depth and natural permeability, which is improved by stimulation techniques. The challenge of geothermal prospection is to predict temperature, permeability and stress orientation in the subsurface. In the case of the Soultz reservoir, besides the heat flow anomaly, the temperature conditions with a local geothermal gradient of 100 K/km were known, e.g. to a depth of about 830 m in the well EPS1 before drilling the first geothermal well GPK1. Furthermore, the orientation of faults was known from the sedimentary cover (Genter, 1989). Yet further information was gained after drilling GPK1, the deepening of the EPS1 well to approximately 2000 m, and later the drilling of GPK2-4 to 5000 m. Here should be mentioned, the investigation of the fracture orientation (Dezayes and Genter, 2008; Genter, 1989), which reveals a major change in orientation of the stress field between the sedimentary cover and the granitic basement. On the basis of the vertical temperature distribution of the 5000 m wells, the natural permeability of about up to 3 × 10⁻¹⁴ m2 was inferred (Kohl et al., 2000).
Since magnetotellurics is an electromagnetic method, it is primarily used to detect resistivity differences in the subsurface. It is in the nature of the induction-based method that it may provide a significant response for structures of high electric conductivity (Simpson and Bahr, 2005). Geothermal brine in the Upper Rhine graben reveals considerable high salinity of about 100 g/l at the Soultz site (Pauwels et al., 1992), which results in high mean electric conductivities in the range 10–100 S/m at reservoir temperature of about 200 °C. Furthermore, electric conductivity itself is a temperature dependent parameter, which may be of use for geothermal prospection (Spichak et al., 2007). The relation between porosity and electric conductivity described by Archie's law may also lead to further indication on porosity changes in the subsurface. Magnetotellurics is a passive electromagnetic method, which uses the natural occurring electromagnetic field. The long- and short-periodic signals originate from fluctuations in the intensity of the solar wind and global lightning activity, respectively. The electromagnetic energy released in discharges, propagates with slight attenuation over large distances in a wave-guide between the ionosphere and Earth's surface. At large distances from the source this is a plane wave with frequencies from about 10−5 to 105 Hz. The magnetotelluric fields can penetrate the Earth's surface and induce telluric currents in the subsurface (Telford et al., 1990). The first 1-D magnetotelluric studies performed in the vicinity of GPK1 at the Soultz geothermal site (Marquis and Gilbert, 2002) have indicated the possibility of detection of geothermal brine at Soultz. Two positive conductivity anomalies were interpreted as the Couche rouge layer at a depth of approximately 500 m and a brine bearing fault at approximately 1500 m depth, which is in agreement with the results from 2-D seismic interpretation. Earlier electromagnetic studies refer to the Rhine graben as a conductive regional structure (Albouy and Fabriol, 1981; Babour and Mossier, 1980; Menvielle and Tarits, 1986; Teufel, 1986; Tezkan, 1994). Some of these studies focus on the deep structure of the Rhine graben using long periods with respect to periods used for geothermal prospection (Babour and Mossier, 1980; Tezkan, 1994). Others account for the scale of induction space at defined period ranges and its implication on interpretation in this area (Menvielle and Tarits, 1986). The investigated period range of the study presented here is considered to be even sensitive to the local graben shape.
The aim of the present study was to analyze the potential of 2-D magnetotellurics for the detection of geothermal resources in the Upper Rhine graben in general. Since the Soultz site is the most well-known and investigated site, a first east-west trending profile of an approximate length of 13 km has been investigated across the Soultz horst, approximately on the latitude of the well end of GPK4.
2 Geological setting of the investigation area
The EGS test site of Soultz-sous-Forêts is located at the western border of the Upper Rhine valley, which extends from the eastern Jura Mountains near Basel northwards to the Taunus-Hunsrück fault with an approximate length of 300 km and width of about 30 to 40 km. To the northeast of this fault the volcanic Vogelsberg massif is located. The Upper Rhine valley is part of the European Cenozoic Rift System, which crosscuts the entire central part of the European continent from the Mediterranean to the North seas. This active graben structure developed since about 45 Ma (Dèzes et al., 2004) and is still active. As a consequence, bowing of the MOHO is observed in seismic observations revealing a MOHO depth of about 25 km (Wenzel et al., 1991). Rifting may also be a reaction to the Alpine orogeny, since the northward motion of Adriatic indenter into the European continent led to a reorganization of the regional stress field. The onset of the two tectonic systems is contemporaneous (Illies, 1972; Schuhmacher, 2002). The deepening of the graben, however, was accompanied by constant sedimentation throughout the Middle Oligocene. The deposition of sediments was interrupted in the Upper Miocene, when further bowing and erosion in the middle of the graben occurred. Due to the east–west oriented stress field, the graben developed as extensional structure on the central part of the bowing MOHO. This process was accompanied by sedimentation in the southern part (Illies, 1972). A re-orientation of the stress field 22 Ma ago triggered sinistral transtension by coupling with the former extensional deformation, which is in agreement with left-lateral transform development (Dèzes et al., 2004; Illies, 1975; Schuhmacher, 2002). This process was accompanied by a switch of the sedimentation from south to north and on-setting erosion in the south. Over the last 5 Ma sedimentation extended on the whole graben and the actual NW-SE stress field led to reactivation of earlier faults on the margins. Here as well, left-lateral transforming is predominant. Sediments, deposited in rather shallow depth while the graben development occurred, reveal low mean temperatures and are of limited interest in geothermal prospection. Instead, the underlying Muschelkalk and Buntsandstein formations as well as the crystalline basement are a matter of investigation.
The Muschelkalk covers a total thickness of about 200 m (Griessemer, 1987). The Upper Muschelkalk is built up by massive, oolithic, onkolithic and partly dolomitified, perlsparitic limestone banks (Griessemer, 1987; Hornung, 1999) with the Trochenkalk formation on top and considered as a possible geothermal aquifer. The Buntsandstein represents a thickness of about up to 400 m. The first 100 m of the crystalline basement are found to be particularly altered and fractured (Genter, 1989).
The granitic basement and the overlying sediments at Soultz underwent multi-phase tectonic deformation including the Hercynian and Alpine phases. The main faults in the sedimentary cover of Soultz strike N20°E, i.e. they follow the Rhenish direction. At depth a horst structure is present and the top basement is at 1400 m (Cautru, 1987). Within the horst, seismic sections reveal faults mainly dipping to the west. In the granite the major direction is about N160°E to north–south with steep dipping to the east and west. In the five deep wells at Soultz 39 fracture zones have been determined on three different depth ranges (Dezayes and Genter, 2008). With depth the strike of the main sets is consistent, the dip orientation, however, changes. Between 1420 to 2700 m true vertical depth (TVD), the main fracture set dips to the east. In the sections between 2700 and 4800 m, two conjugate sets reveal fractures dipping to the east and to the west and at a reservoir depth between 4800 and 5000 m the westward dipping set is dominant (Dezayes and Genter, 2008, Valley, 2007).
The geological setting of the Mesozoic and Paleozoic sediments at the surface is shown in Fig. 1.
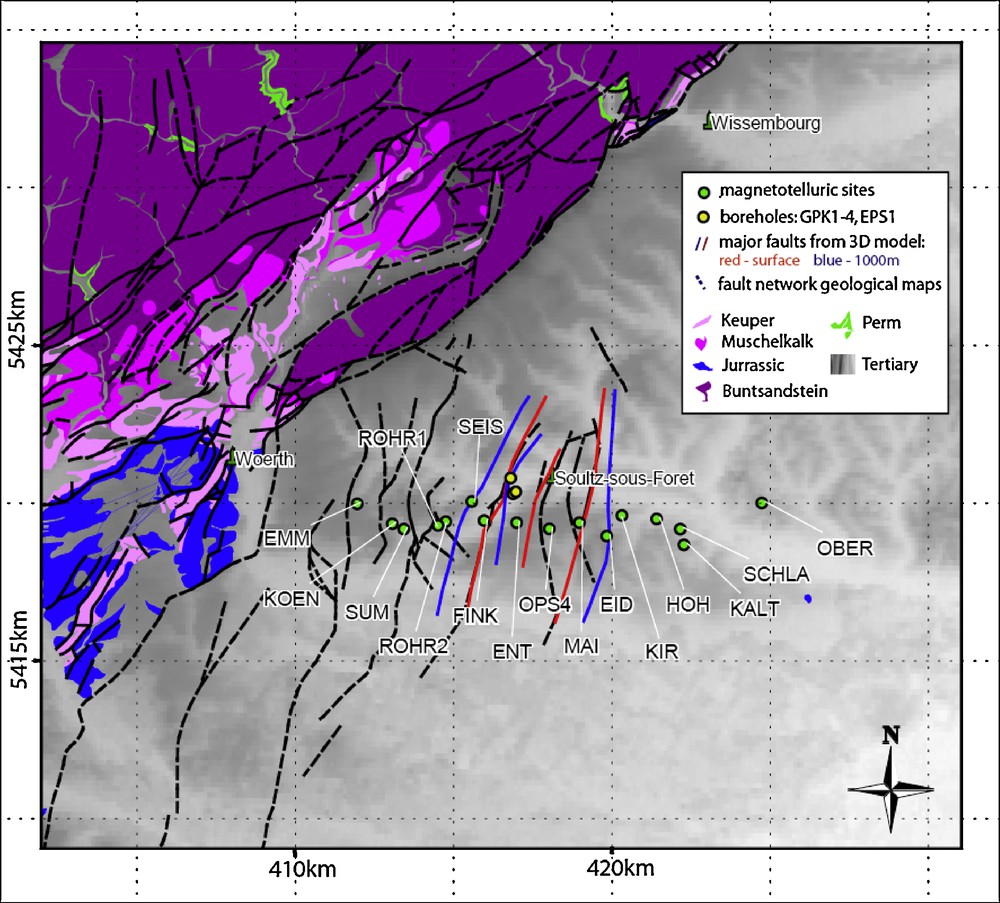
Geological setting of the investigation area at the Soultz geothermal site (Geological map of France, 1:50,000, BRGM, Orleans). The grey-scaled area shows the digital elevation model (GTOPO30, USGS) for the area covered by Quaternary and Tertiary sediments. The major faults of the Soultz horst (blue and red lines) represent the Kutzenhausen-, Soultz, and Reimerswiller-fault, which are taken from a 3D geological model (Schill et al., 2009). The MT measurements were accomplished during the winter survey 2007/08.
Cadre géologique de la zone de recherche sur le site géothermique de Soultz (carte géologique de France à 1/50 000, BRGM, Orléans, France). La zone en niveaux de gris montre le modèle numérique de terrain (GTOPO30, USGS) pour le domaine recouvert de sédiments tertiaires et quaternaires. Les failles majeures du horst de Soultz (lignes bleue et rouge) représentent les failles de Kutzenhausen, Soultz et Reimerswiller d’après le modèle géologique 3-D (Schill et al., 2009). Les mesures MT ont été exécutées pendant l’étude durant l’hiver 2007–2008.
3 Measurements
The 16 sites selected have been investigated on an east–west profile of approximately 13 km length. The site spacing is 0.8 km on average, and varies between 0.5 and 2 km. The profile covers the horst structure limited by the Kutzenhausen and Reimerswiller faults and extends further of about 5 km to the east and west (Fig. 1). The approximately north–south oriented faults indicate a general 2-D subsurface structure and allow for a 2-D magnetotelluric survey as a first approximation.
Measurements have been accomplished using the multichannel geophysical measurement system GMS-06 (Metronix Inc.). The system includes the data logger ADU-06 (DC to 20,000 Hz frequency range, five input channels with a 24 bit A/D converter). Synchronization is accomplished by a GPS clock with ± 130°ns to satellite reference and positioning. Data are stored on an internal hard disk and are downloaded via a TPC connection. Power is supplied by a 12 V external battery. Three magnetometers and two pairs of non-polarizable electrodes are connected to this five-channel data logger. For the registration of magnetic field variations in the range from 10,000 to 0.001 Hz broadband induction coil magnetometers MFS-06 are used. The electric field variations are registered by measuring potential differences with non-polarizable Pb-PbCl-electrodes. The experimental set-up includes four electrodes, which are distributed at a distance of 100 m in north–south and east–west direction. They are buried at a depth of about 45 cm and coupling to the soil is improved using water. The ADU logger and magnetometers are located in the centre, whereas the three induction coils are oriented north–south, east–west and vertical at a distance of 10 m from the data logger and at least 1 m from electric field wires. The vertical coil was buried to 4/5 of its length and covered by a plastic tube in order to prevent recordings from the influence of wind. Conuration of the data logger was carried out using GMS207b software (Metronix Inc.). A self-test including internal calibration is carried out automatically upon starting the measurement. Three frequency bands have been measured at each site: The HF band (sample frequency 40,960 Hz, frequency range 500–20,000 Hz) runs 7 s by default; for the LF1 band (sample frequency 4096 Hz, frequency range DC–1000 Hz) a recording time of 15 min and for the LF2 (sample frequency 64 Hz, frequency range DC–30 Hz) band of two days has been chosen.
Seven stations (ROHR1, ROHR2, OBER, SUM, KOEN, EMM, FINK, Fig. 1) have been operated contemporaneously with a remote reference station at Vogelsberg (Germany) registering the magnetic field variation in north, east, and vertical direction. The distance between the Vogelsberg and the area of investigation is of approximately 200 km.
4 Processing
A coherency analysis was conducted to investigate the potential of remote reference processing (Fig. 2).
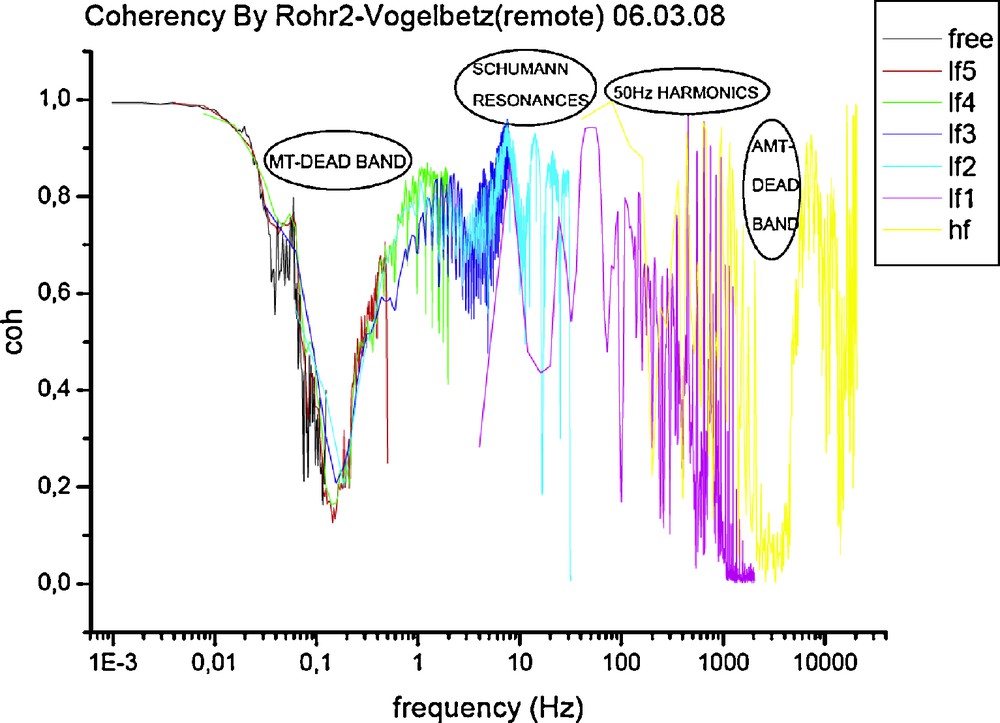
Representative coherency analysis between the magnetic channels of site ROHR2 and the remote site Vogelsberg from the 06/03/2008. Different colours depict overlapping frequency bands.
Analyse de cohérence représentative entre les chenaux magnétiques du site ROHR2 et du site à distance (remote site) de Vogelsberg, le 6 mars 2008. Différentes couleurs représentent le recouvrement des bandes de fréquences.
Below 0.01 Hz the coherency is close to one. Up to a frequency of 0.03 Hz it is greater than 0.8. Between 0.06 and 5 Hz in the MT dead-band the coherency is low. The group of four maxima at 7.6, 14, 20.9 and 26.8 Hz represents the first four Schumann resonances (bright blue in Fig. 2). The coherency of these maxima is between 0.7 and 0.9. Above 30 Hz the coherency decreases superseded by the 50 Hz technical signal and its harmonics, which indicates that coherency-threshold based on rejection schemes combined with remote referencing during processing is not applicable in this band. From 1000 to 5000 Hz the curve reaches the minimum attributed to the AMTdead-band. Generally, the coherency between 0.5 Hz and 5 Hz is higher in the BBy channels compared to the BBx channels among almost all sites.
Processing the recorded time series includes filtering and re-sampling of the time series and the calculation of spectral matrices at determined frequencies. Then the impedance tensor is estimated from the spectra by statistical means. In this study, two independent processing schemes were applied to the data, processing with Mapros (Metronix Inc.) and with WinGLink (Geosystems). Their approach to create a statistical ensemble and the methods to improve the quality of the transfer function are of different natures (statistical ensemble refers to the entity of stacks defining the statistical properties of the estimates). Both allow for remote referencing to reduce the influence of uncorrelated noise. The processing results were stored in Electrical Data Interchange (EDI) format.
First processing with Mapros (Metronix Inc.) has been carried out applying the following criteria. To access and analyze frequencies between 0.4 and 0.001 Hz, subsequent decimation by four of the LF2 frequency bands was performed. Low-quality segments of time series, caused mainly by spikes with duration of less than 1 s, bipolar events with a duration of several seconds both in the LF2 band and steps in electric channels, were rejected manually from further processing. Segments of the time series were cosine tapered with a von Hann-Window before transforming them into the frequency domain. The spectra are obtained by Fast Fourier Transformation (FFT) using a Radix-2 algorithm. By averaging a certain bandwidth into a so-called evaluation frequency using a Parzen window, the signal to noise ratio was improved. Since the time series in Soultz are strongly affected by noise, in most cases for the estimate of the transfer function the largest FFT window of 16,384 points has been used. For the LF5- and the FREE-band a window of 4096 points has been chosen to yield still acceptable amounts of segments to stack. In all frequency bands repeatedly a refined selection of events has been applied, followed by processing with “selective stacking” and “coherency threshold”, including remote referencing whenever possible. Depending on the site, and thus on the nature of the noise, this procedure led to an improvement of the transfer function results. Finally, the smoothest transfer functions from each band were merged into one EDI format.
Additionally processing has been carried out with WinGLink (Geosystem), which provides access to multiple stages of processing. Since information on the target depth is contained in the LF2 band of raw data and test runs revealed no significant improvement in quality of the transfer functions for the others (HF and LF1), only this band was subjected to further processing. Here, a notch filter with a central frequency of 16.69 Hz and bandwidth of 1.02 was applied to eliminate the influences of the 16 2/3 Hz railway power supply. After filtering, the LF2 band was ten times decimated by two into lower frequency bands using a five order Finite Impulse Response filter. At each level, windows of 32 points are cosine tapered (von Hann-Window) and transformed into the frequency domain by computing the 6th and 8th Discrete Fourier Transform (DFT). Applying this technique, one obtains seven frequencies per decade evenly spaced on log scale, representing 25% or 33% bandwidth, respectively. At the higher levels (lower frequencies) the windows are interlaced to double the number of elements for the estimation of transfer functions, although these elements are no longer independent. The estimation of transfer functions is carried out using a modified jack-knife method (Jones and Jödicke, 1984). Further improvement was obtained by rejection of a certain amount of mini-stacks. Each site has been processed using solely single site data on the one hand and using remote reference data on the other. Single site processing was carried out by maximizing the multiple coherencies between one of the outputs and both inputs and by maximizing the partial coherency between one of the inputs and one of the outputs. In case of using a remote reference, the multiple coherencies between one of the local inputs and both remote inputs were used and weighted by both variance and coherency, respectively. The percentage of discarded data was 35, 50 or 80% for the maximization with a threshold value of 0.85, respectively. This yields a set of 24 different settings for each site from which the smoothest result was selected for further editing. Generally, remote referencing yields best results. Single site processing yields best results with maximization of the multiple coherencies between one of the outputs and both inputs. A cross-power editor was used for manual rejection of elements, which deviate from the mean in the period range between 1 and 10 s. This led to more consistent behaviour of the apparent resistivity with respect to the phase.
Two examples of the two different processing schemes are shown in Fig. 3. In the following, the processing results using Mapros will be described and a qualitative comparison after reprocessing with WinGLink will be given. The sites OPS4, ROHR1, KALT and SEIS have been excluded from analysis, since their electric time series are strongly disturbed and do not to allow for further interpretation.

Two representative sites (HOH and SUM) processed using Mapros (left) and reprocessed using WinGLink (right). Mapros processing includes the whole recorded period range, whereas reprocessing was applied only to the LF2 band. Apparent resistivity and phase angle are plotted for the XY- (red) and YX-components (blue) as function of period.
Données de deux sites représentatifs (HOH et SUM) traitées selon Mapros (à gauche) et retraitées selon WinGlink (à droite). Le procédé Mapros comporte l’ensemble de la gamme de périodes répertoriées, tandis que le retraitement n’a été appliqué qu’à la bande LF2. La résistivité apparente et l’angle de phase sont représentés pour les constituants XY (rouge) et YX (bleu), en fonction de la période.
After processing with Mapros three period ranges can be distinguished in the sites. In the first one, from 1.25 × 10⁻⁴ to 0.05 s, the apparent resistivity varies between about 30 Ωm at short periods and 1 Ωm at 0.05 s. A minimum of 0.01–1 Ωm is reached at periods of 10−4 to 10−3 s, where strong scattering and bias can be attributed to low signal in the AMT-dead-band. The phase angle decreases from 90 to 60° in this range. It reveals a strong deviation from the expected surface angle of 45° at highest frequencies, which is attributed to an artifact (Friedrichs, pers.commun.). Scatter between 10−3 and 0.05 s is ascribed to the strong impact of power lines at 50 Hz and its harmonics. The second period range reveals smooth and consistent values in the apparent resistivity and in the phase originating from the first Schuman resonances with good signal to noise ratio between 0.05 and 0.15 s. The apparent resistivity decreases linearly from 10 to 1 Ωm and the phase angle varies between 60° and 45°. However, sites with less data quality show also scattering. From 0.15 s on the apparent resistivity varies between 0.01 and 100 Ωm with strong bias in particular between 1 and 10 s. This can be attributed to the MT-dead-band. The phase is less affected, but the angle decreases to almost 0°. Periods longer than 100 s reveal consistent apparent resistivity and phase (Fig. 3a) at most sites. The sites SUM, KOEN and EMM show no consistency at all in this period range. In this period range the XY- and YX-transfer functions are no longer congruent. The XY component at longest periods shows values, which are of the order of 1 to 2 magnitudes higher compared to YX. In the following, we call this feature splitting. This splitting could not be attributed to strong bias. The large errors are attributed to relatively short recording times. This comes along with a strongly scattered phase, in particular, in the YX-component. In summary, the curves are seriously biased and scattered over a wide range of periods and the Hilbert transformation could not be applied successfully. At frequencies from 1 to 1000 s, corresponding to the target depth transfer functions in terms of dimensionality, could not be analyzed.
Two results of the reprocessed LF2 band using a remote reference are presented as an example in Fig. 3b and d. Except from site OBER, for other all sites the scatter of the phase could be reduced significantly. The phases from 10 s to 100 s at EMM, SUM and KOEN could be recovered. Thus smooth curves with phase angles decreasing from 60° at about 0.06 s to 0° at a few tens of seconds are obtained. Similar to the first processing, it reveals splitting at long periods (larger than 1 s) with an increase in phase up to 30° in the XY-component and up to 60–90° in the YX-component. In a few cases in the MT-dead band also angles close to 0° are observed and attributed to non-inductive mechanisms, which originate from local noise sources. The bias in the apparent resistivity could be reduced significantly applying processing with remote reference. The apparent resistivity is of about 3 to 7 Ωm at 0.06 s, and decreases to about 1 Ωm at a few tens of seconds. Only at sites exhibiting strong bias, for which a remote reference is not available, it decreases to less than 1 Ωm. A splitting of the apparent resistivity for XY- and YX-components is observed at similar frequencies compared to the phase angles. For long periods, values in the XY-component are less than 12 Ωm and in the YX-component larger than 1 Ωm (except for extremely noisy sites). In summary, remote reference processing leads to a significant improvement in both phase angle and apparent resistivity for all sites except OBER. The site HOH, however, reveals consistent results without remote referencing. The overall improvement in the phase angle and apparent resistivity for biased or scattered period ranges allows an interpretation in terms of dimensionality and eventually static shift.
5 Dimensionality analysis and strike determination
At short periods up to a few seconds the phase angle and apparent resistivity are congruent for the XY- and YX-components with a small offset, indicating a small static shift. Generally, rotation of the impedance tensor in small steps from 0° to 180° shows that the congruence of XY- and YX-component in phase and apparent resistivity is rotationally invariant. Hence, the calculated swift angle is of no significance at low periods. At short periods the swift skew is generally smaller than 0.2, except at site EMM (Fig. 4). At site EMM a nearly constant skew of about 0.3 and a small offset between the phases of the XY- and YX-components are observed. This may indicate a surface near body-effect resulting into a static shift at the recorded periods. It can be assumed that, in general, in the short period range a 1-D environment is dominant. In the period range between a few seconds and a few tens of seconds, the onset of the splitting in phase angle and apparent resistivity, which is most prominent at a rotation angle of 52°, is observed around 3 s at EMM (Fig. 4). This is shifting towards longer periods when moving along the profile eastwards. This is attributed to an increasing distance from an adjacent resistivity contrast, which may be related to the graben border. At periods of about 10 s the skew increases to about greater than 0.25 at 40 s. In summary, the maximization of the splitting at rotation of 52° indicates a 2-D environment with a 52°-strike direction. Fig. 5 shows a rose plot of the occurrences of Swift angles averaged in the period range between 4 s and 32 s. Here the predominant direction is close to 50° (140°) as well. The angle of 52° corresponds to the strike of the outcropping Triassic sediments on the graben border, which marks indeed a resistivity contrast. Thus, we have defined TE and TM mode from the XY- and YX-component. The increasing trend in skew is an indication for increasing influences of 3-D effects at depth.
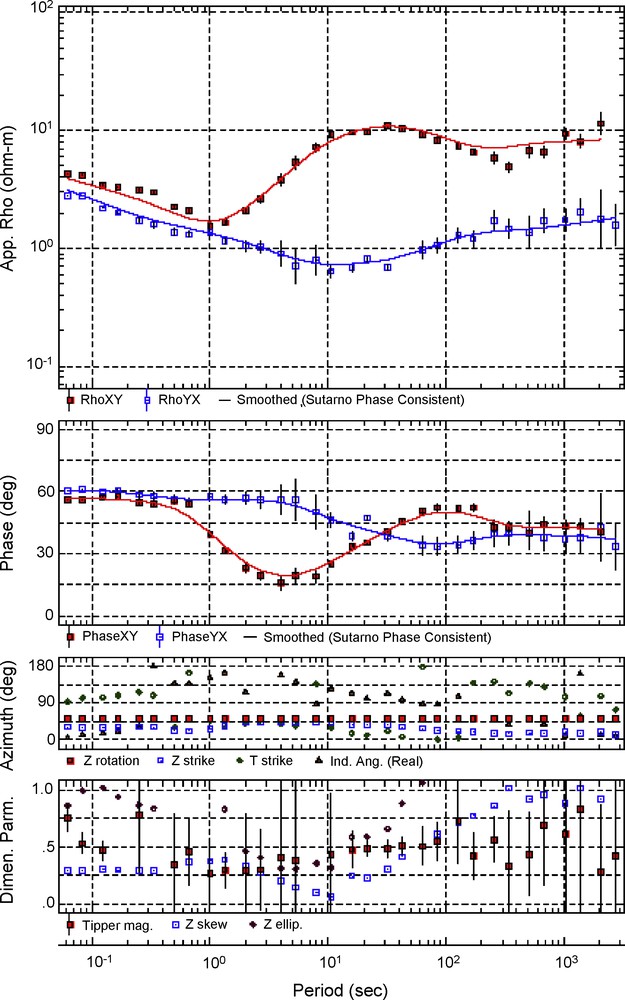
Apparent resistivity, phase angle, swift angle (Z strike), and skew (Z skew) of site EMM reprocessed and rotated to 52° including “Sutarno Phase Consistent Smoothing” for the apparent resistivity and phase (Schill et al., 2010).
Résistivité apparente, angle de phase, angle de Swift droit (Z strike) et oblique (Z skew) du site EMM retraités et tournés à 52°. La résistivité apparente et la phase incluent également le lissage cohérent de phase Sutarno (Schill et al., 2010).
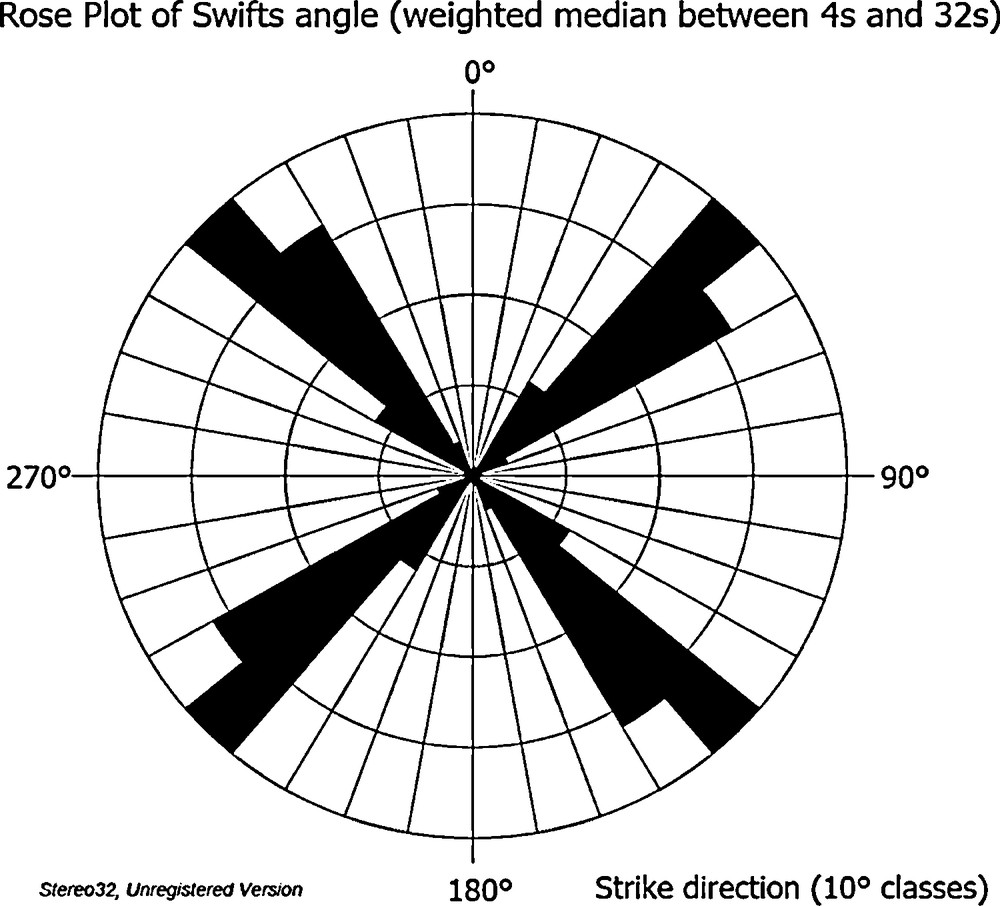
Rose Plot showing the occurrences of Swift Angles among the sites. The data was averaged between 4 and 32 s with centre at 10 s, where the strong splitting of transfer functions is observed. Data showing worse quality has been down-weighted with respect to the others.
Rosace de représentation de l’angle de Swift. Une moyenne pondérée a été effectuée pour les données entre 4 et 32 s, la moyenne a été fixée à 10 s où le fort fractionnement de la fonction de transfert est observé. Les données de mauvaise qualité ont été pondérées négativement, afin d’éviter qu’elles ne perturbent les autres.
At the longest periods the phase angle approaches 45° and the apparent resistivity about 1 Ωm. These are common features at long periods in MT measurements in the Upper Rhine Graben (Tezkan, 1994). In this period range the swift angles drop to 30–20° and at longer periods skew increases to nearly 1. The increasing skew implies a three dimensional environment and reflects the transition from a regime with a strike direction of 52° to a regime with strike direction between 20° and 30°. In summary, the 3-D nature of the subsurface manifested by difference in strike direction with increasing period is evident at all sites. However, the differences between the single sites in the period range around 100 s superimposed on this general trend indicate an anomaly with a lateral extension within the range of the profile.
The transfer function between the horizontal and vertical magnetic field (tipper) is of no use over a broad range of periods. The modulus of the induction arrows is too high and their orientation exhibits no regular pattern. The magnitude of the tipper components is greatest where the MT signal is weakest and shows lowest coherence between the channels (MT-dead band). The tipper is interpretable only in the small frequency range from 0.1 to 0.01 Hz and just at six sites (EMM, KOEN, SUM, ROHR2, ENT, and EID).
In Fig. 6, a rotation of the predominant current flow is indicated by the orientation of the induction vectors in the period range from 10 s to 100 s. This transition supports the assumption, that at short periods the relevant structure is the local graben border whereas with increasing period the magnetotelluric sounding becomes more influenced by the regional graben structure.
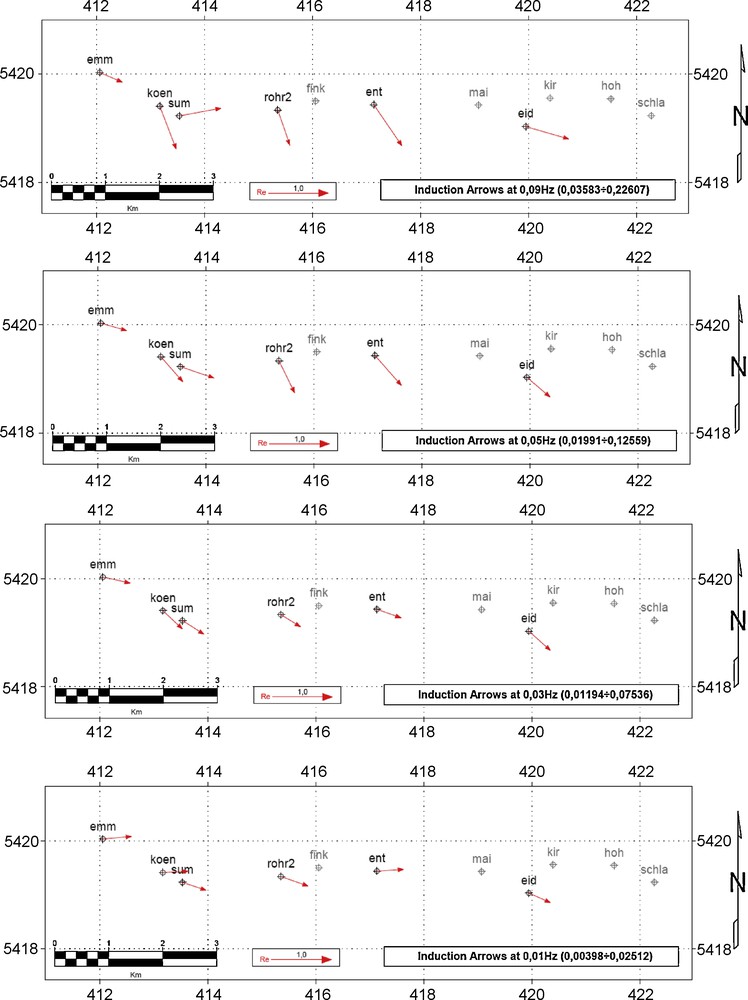
Induction arrows (red) in the period range from 0.1 s (1st frame) to 0.01 s (4th frame) for 6 out of 10 sites. They show a rotation of the predominant current flow from NEE orientation to NNE orientation with increasing period.
Directions d’induction (rouge) dans la gamme de périodes de 0,1 s (premier graphe) à 0,01 s (quatrième graphe) pour 6 des 10 sites étudiés. Elles montrent une rotation du courant prédominant d’orientation NEE à NNE, avec une période croissante.
The dimensional analysis reveals a transition from 1-D to 2-D to 3-D subsurface structures with increasing period. The dominant feature is the 2-D response indicated by splitting between 1 and 10 s attributed to the local graben border striking N52°E (local scale). At larger periods presumably, the regional N20°–30°E strike of the Rhine Graben dominates (regional scale). 2-D inversion is therefore only applicable in the period range from 0.06 to 40 s.
6 Inversion
The inversion algorithm (Rodi and Mackie, 2001) computes solutions to the inverse problem by minimizing an objective function ψ. The solutions are regularized by incorporating smoothness constrains on ψ. This accounts for the smoothness of a magnetotelluric sounding and its insensitiveness to sharp, small-scale contrasts favouring least-structure models. The regularization is implemented by defining the objective function (Tikhonov and Arsenin, 1977).
The inversion was carried out using the sites EMM, KOEN, SUM, ROHR2, FINK, ENT, MAI, KIR, HOH, and SCHLA (Fig. 1) projected on a profile at N142°E an therefore perpendicular to the 52° strike direction. The total mesh is about 240 km large and 120 km deep. The profile extends over 7.2 km. The mesh extension and meshing of the profile area follows the rules preventing the algorithm from numerical instabilities (Rodi and Mackie, 2001). The active mesh area was limited vertically to approximately one skin depth of the lowest period and horizontally to an adjustment length of approximately three skin depths. The 2-D inversion algorithm was applied using Sutarno phase consistent smoothed data after having masked outliners, rotated to N52°E. Periods were limited to 40 s as longest. A regional a priori model accounting roughly for the geometry of the Rhine graben has been used as starting model for the final inversion. Using an a priori model instead of a uniform halfspace was necessary to force the inversion result to a geologically reasonable minimum. Since all sites lie within the graben, the transition over the graben border is not covered by measurements. Therefore, the location of the resistivity contrast, which is essential to cause the observed strong splitting of the transfer functions at all sites, is placed anywhere by the inversion process, if no suited constraints are imposed. Besides the Rhine graben, other hypothesis have been tested, but all changes to the geometry or on the values of the model have been withdrawn. In the inversion procedure regularization was switched to the smoothest variation away from the starting model. TE and TM mode as well as phase and apparent resistivity have been inverted simultaneously with 100 iterations. The error floors were initially set to 25%, then first the phase error floor was reduced to force fitting of the model to the phase angle (final values: 5%), afterwards the error floor for the apparent resistivity was reduced as well. This was done because the phase was generally better estimated by the processing than the apparent resistivity. The trade-off parameter was reduced stepwise to allow for modelling of structures with a relatively small scale (final value: τ = 1). The approximate depth and thickness of the known Couche rouge structure was labelled as a tear zone to omit smoothing-out of this thin, but electrically prominent structure. Introducing this feature into the inversion process led to better resolution of the underlying structures and to a better data fit. In Fig. 7, the prepared transfer functions and their data fit after the final inversion are presented.
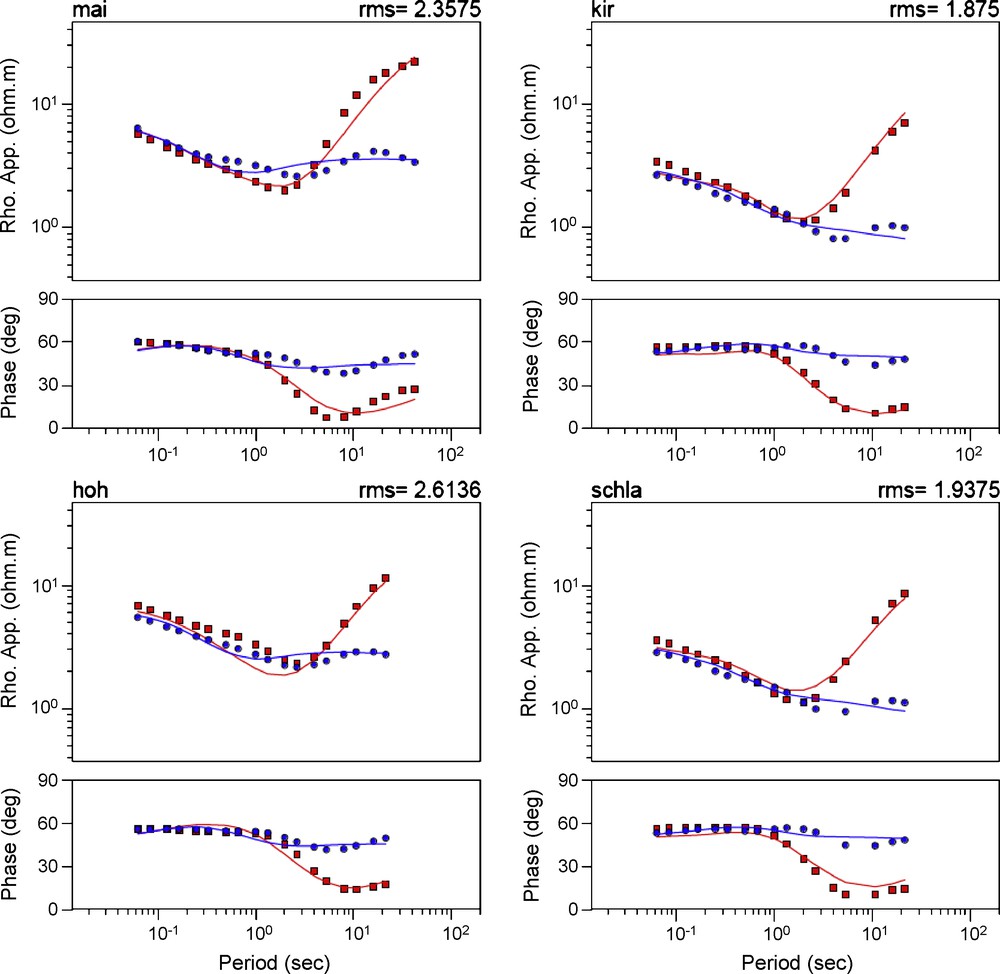
Transfer functions of the ten sites used for inversion (dotted). The data is smoothed; rotated to 52° and truncated at 40 s. Additionally some outliners are masked. The solid lines depict the inversion response.
Fonctions de transfert des 10 sites utilisés pour l’inversion (points). Les données sont lissées ; rotation à 52° et troncature à 40 s. Certains points extrêmes sont masqués. Les lignes solides indiquent la réponse à l’inversion.
The final inversion result is presented in Fig. 8. It has the best data fit and best agreement with geological information. The over-all rms is 2.28 and the individual site-rms is always below 3 (Fig. 7). Generally, the graben model is well accepted. During all inversion steps the boundary between the conducting half layers with resistivity less than 10 Ωm at depth down to about 750 m and the resistive underlying space with resistivity of greater than 1350 Ωm was preserved. A conductive zone between site SUM and site ENT, however, extends vertically to more than 2000 m.
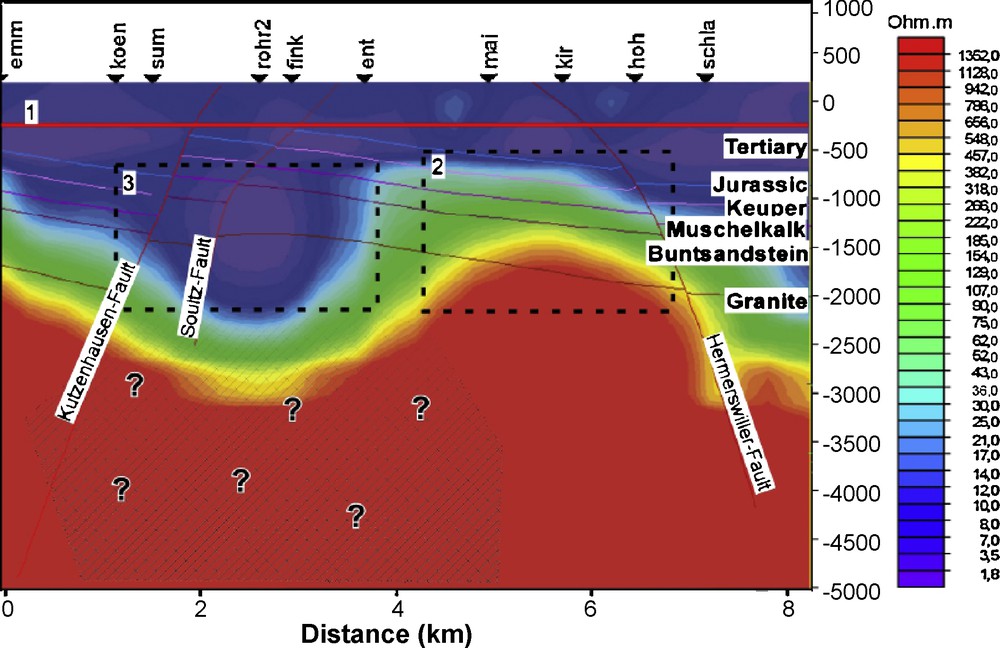
Interpreted section of 2-D inversion of Sutarno phases consistent smoothed data on profile N142°E. Gridding of the inversion result was performed using spline interpolation. Superimposed are the major faults of a 3D geologic model (Schill et al., 2009). The red line marked (1) gives the approximate upper limit of a conducting structure at a depth of approximately 200m (Schill et al., 2010).
Interprétation de la section d’inversion 2-D des données de lissage cohérent de phase Sutarno pour le profil N142° E. Le maillage du résultat de l’inversion a été effectué en utilisant l’interpolation par spline. Les failles majeures d’un modèle géologique 3-D (Schill et al., 2009) sont superposées. La ligne rouge marquée (1) donne la limite supérieure approximative d’une structure conductive, à approximativement 200 m de profondeur (Schill et al., 2010).
The conductive feature (red line labelled 1) below about 200 m can be attributed to the clay-rich Couche Rouge because of the following arguments. A block of 300 m thickness and 8 km length with an average resistivity of about 3 Ωm yields a resistance of 80 Ω. This is equivalent to a block of 100 m thickness with a resistivity of 1 Ωm or a 50 m thick block with a resistivity of 0.5 Ωm. A thickness of 50 m to 100 m would correspond to the reported thickness of the Couche Rouge (Cautru, 1987). Box-2 in Fig. 8 shows a part of the profile, which is in good agreement with the a priori expectation of the subsurface layering. The Triassic sediments coincide with an area of increasing resistivity from some tens to a few hundred Ωm. The top of basement is marked by a strong increase in resistivity to more than 1000 Ωm. At depth of 1000 m soundings of adjacent sites are already interlaced with each other and the adjustment length equals the distance to the N142°E profile. Thus the layering is well constrained. The layering is disturbed by a conductive anomaly (see Box-3). Its center with average resistivity of 3 Ωm extends over the Buntsandstein formation into the granitic basement. It coincides partly with the Soultz- and Kutzenhausen-Fault. Comparison of our results with some electrical logs available from the nearby boreholes showed in some parts good agreement, but discrepancies in others. These discrepancies, which occur primarily for the granitic environment, are mainly attributed to the different physical processes behind the measuring methods. A more detailed discussion can be found in (Schill et al., 2010). Structures, which lie deeper in the granitic basement could not be resolved in 2-D inversion, since 3-D features are indicated at periods greater than 40 s.
7 Conclusion
The discussion of the data shows that remote referencing was crucial for interpretation. Smoothing techniques, like Sutarno phase consistent smoothing, were indispensable for reconstructing consistent transfer functions, especially in the dead band. The inversion results are in good agreement with the geological observation of the target area to the depth of 2000 m. A general condition is the good acceptance and reproduction of the local Rhine Graben structure. In this environment, a clear localization of a conductive anomaly on major fault zones (Kutzenhausen-, Soultz-Fault) could be established. It coincides well with faults of Cluster1 (Dezayes and Genter, 2008) determined by borehole data analysis. This zone is considered as the first of three major, naturally permeable zones, tracing the borehole. The low resistivity, especially in the granitic basement, can be attributed to distinct origins. In geothermal areas conductivity is most probably enhanced by the presence of clay minerals, due to hydrothermal alteration of granite, and by the presence of saline brine by itself. On the one hand, in Soultz up to 30% of plagioclase is altered to clay minerals like Ilite and Smectite among others (Genter, 1989). On the other hand, theoretical considerations suggest that the conductivity anomaly might be correlated with the increase of interconnected pore space (still below 1% of total rock volume) in the bulk rock (Schill et al. 2010), which is also in good agreement with water inflow during drilling in the correspondent depth range. Further, this depth coincides with the decrease in the geothermal gradient, which marks the top of convective heat flow, implicitly fluid motion. In this work no attempt was made towards a quantitative comparison of the two conduction mechanisms, but evidence of both is at hand. No insight could be developed about the deeper lying zone of geothermal production. The influence of 3-D effects renders a 2-D-analysis problematic at that depth. Other magnetotelluric studies conducted at the Coso geothermal field (Newman et al., 2005), at Mt. Amiata (Volpi et al., 2003), and the Pohang low enthalpy area (Uchida et al., 2004), for example, also reveal the need for quiet remote sites to achieve useful data quality in industrialized areas. They also demonstrate the importance to resort to 3-D-methods for investigating geothermal structures. Another example is the German geothermal test site at Groß Schönebeck (Muñoz et al., 2007). For this study a site on the island Rügen served as remote reference, which appears to be a promising place for future magnetotelluric campaigns in Germany. The study presented here shows that magnetotellurics can generally map brine-bearing volumes in low enthalpy areas even under noisy conditions. It also shows that the geological complexity of the target region requires 3-D-analysis techniques to release the full potential of the method.
Acknowledgement
The authors would like to thank the unknown reviewer and A. Gérard and Bano for helpful and constructive reviews. The authors would like to thank the Ministerium für Umwelt, Forsten und Verbraucherschutz Rheinland-Pfalz for funding the project and to A. Genter and N. Cuenot from GEIE “Exploitation Minière de Chaleur”, France for support. We would also like to thank B. Friedrichs from Metronixs and A. Junge for helpful comments during acquisition and processing of the data.