

1 Introduction
Mapping the geometry of permeable and non-permeable zones in crystalline rocks is fundamental in order to: (i) characterise natural fluid flows; and (ii) assess the possibility of making artificial fluid circulations. This is a prerequisite before storage of nuclear waste or geothermal field development. The Soultz-sous-Forêts Enhanced Geothermal System (EGS) is located in Alsace, in the north-east part of France. It has been initiated in the 1980s to develop an artificial heat exchanger in the deep crystalline rocks of the Upper Rhine Graben (Fig. 1). Thanks to many decades of oil exploitation of the Merkwiller-Péchelbronn reservoirs (Schnaebele et al., 1948), a large number of drill holes, numerous seismic surveys of various types and more recent geothermal researches at the Soultz-sous-Forêts site, the geology is fairly well understood (see among others Cautru, 1989; Foehn, 1985; Renard and Courrioux, 1994; Sausse et al., this issue; Total, 1987).
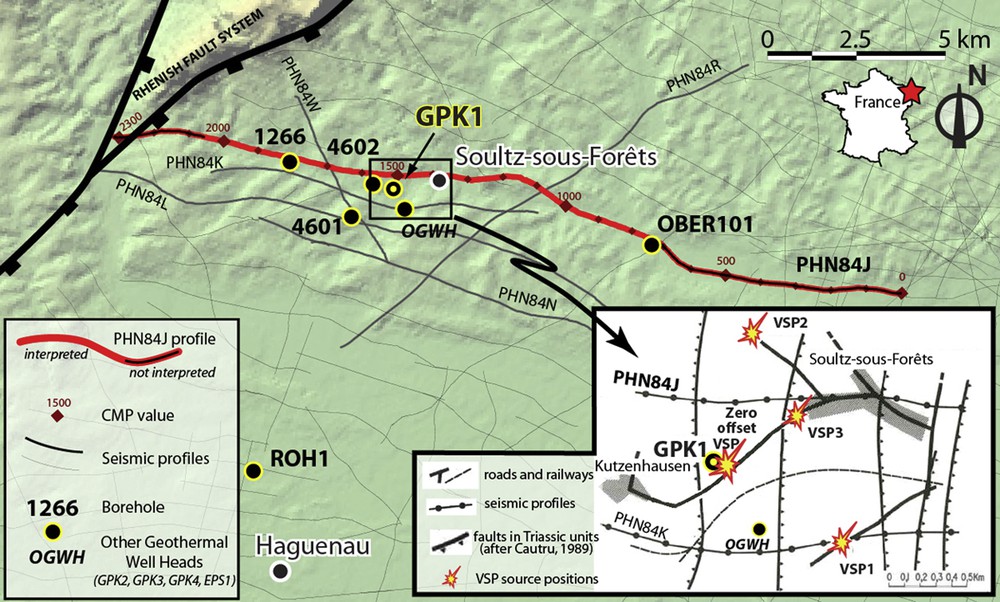
Location map of the PHN84J reflection seismic profile in the Upper Rhine Graben, hundreds of meters north of the Soultz-sous-Forêts EGS well heads. Lower right insert: location map of the zero offset and the three offset-VSPs acquired in 1988 (modified after (Beauce et al., 1991)).
Carte de localisation du profil de sismique réflexion PHN84J dans le fossé Rhénan supérieur, passant à quelques centaines de mètres au nord des têtes des puits du système géothermique de Soultz-sous-Forêts. Encart en bas à droite : positions des sources et du puits GPK1 pour l’acquisition en 1988 d’un PSV à déport nul et trois PSV avec déport (modifié d’après (Beauce et al., 1991)).
Drilling and logging data and later hydraulic tests showed that the main fluid circulations occur at depth levels where the boreholes intersect fractured zones (e.g. Evans et al., 2005; Genter et al., 1997). Consequently, several methods have been used, trying to map the main fractures affecting this geothermal field, and improve its 3D structural model (Sausse et al., this issue). As the outcome of investigation techniques are more or less successful and may impact the environment (Gérard et al., 2006), it is of great importance to use several, and complementary, methods to improve a reservoir model, which is fundamental for helping the heat source management during short and long term exploitation. In this respect, current efforts are made to re-examine several old seismic surveys carried out at the Soultz-sous-Forêts geothermal site.
This article presents a new structural interpretation – particularly of the sedimentary cover – based on a new analysis of a reprocessed reflection profile combined to results derived from old VSP data.
2 Seismic reflection profile interpretation
2.1 Description of the data
Several seismic reflection surveys had been carried out north of Haguenau over the last decades (1955, 1959–1960, 1973–1978, 1981, 1984) targeting the Merkwiller-Péchelbronn oil reservoirs (Dylikowski, 1985; Foehn, 1985; Total, 1987). The last and most extended vintage has been acquired by the Compagnie Générale de Géophysique for Total.
The Kutzenhausen–Soultz-sous-Forêts area is covered by this survey and 6 of these lines (PHN84-x, Fig. 1) have been interpreted at an early stage of the geothermal project (Cautru, 1989). This interpretation led to a good understanding of the sedimentary cover and an accurate positioning of the Soultz-sous-Forêts horst located within a major thermal flux anomaly. This sub-meridian trending basement high is bounded to the west by the Kutzenhausen and the Soultz-sous-Forêts faults and to the east by the Hermerswiller fault (see, for example, Renard and Courrioux, 1994).
2.2 Reprocessing of line PHN84J
The Bureau des Recherches Géologiques et Minières (BRGM) supervised the reprocessing of the PHN84J line in 2007 in the framework of the Soultz-sous-Forêts geothermal project. The work was focused on accurate static corrections and better time migration. As a result, some artefacts disappeared and sedimentary reflectors are better defined (Fig. 2a). The top of the basement and the base of the sedimentary cover (Buntsandstein, and Early Permian) are still not well defined, probably because acquisition parameters were set up to image shallowest sediments (Foehn, 1985). Previous processing and interpretations of this profile are available in Beauce et al., 1991; Cautru, 1989; Foehn, 1985; Total, 1987.
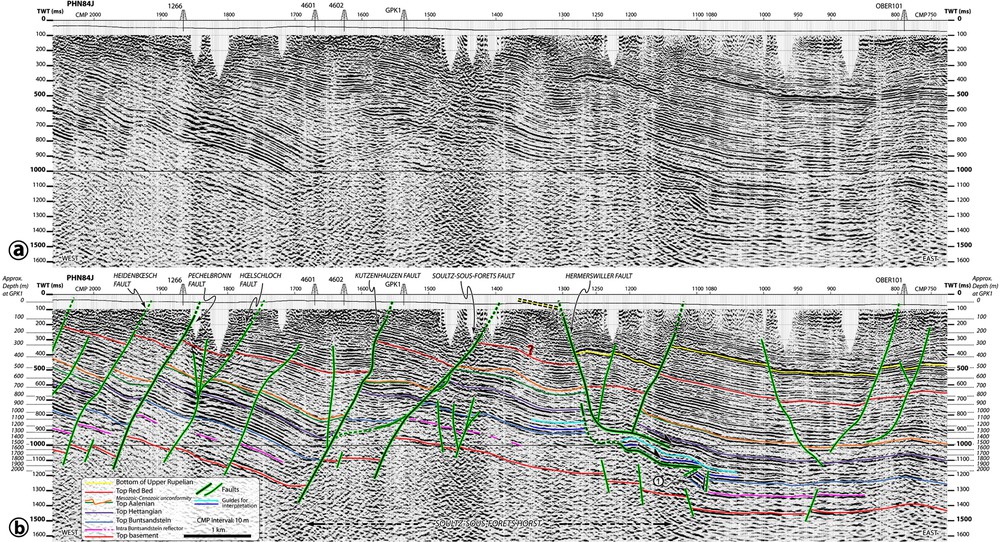
a. PHN84J seismic reflection profile after recent reprocessing. b. Interpretation of the profile.
a. Profil de sismique réflexion PHN84J après son récent retraitement. b. Interprétation du profil.
2.3 Interpretation approach
SeisVision™ (Geographix Discovery) was used for the new interpretation. Due to the large number of wells drilled in the area, many archives were collected at BRGM and the European Economic Interest Grouping (EEIG). Numerous boreholes files gathered in the French BSS (Banque du Sous Sol, managed by BRGM) or in archives allowed us to localise the depth of the sedimentary formations.
Time-depth relations available in GPK1 (1988), GPK4 (2007) and OBER 101 (1987) (Fig. 1) have also been used. A synthetic seismogram based on a VSP-calibrated sonic log is available in GPK1 from the 1988 survey (Fig. 3). The seismogram does not satisfactorily fit the reflection profile at the well location, probably because of the presence of numerous faults reported in driller report and geological investigations, and the distance between the well and the profile (Fig. 1). Nevertheless, in non-faulted domains the fit is satisfactory. In addition, the top of basement seen at ∼900 ms (Fig. 3) is properly positioned in time on the seismic section (see Fig. 8 for a detailed view).
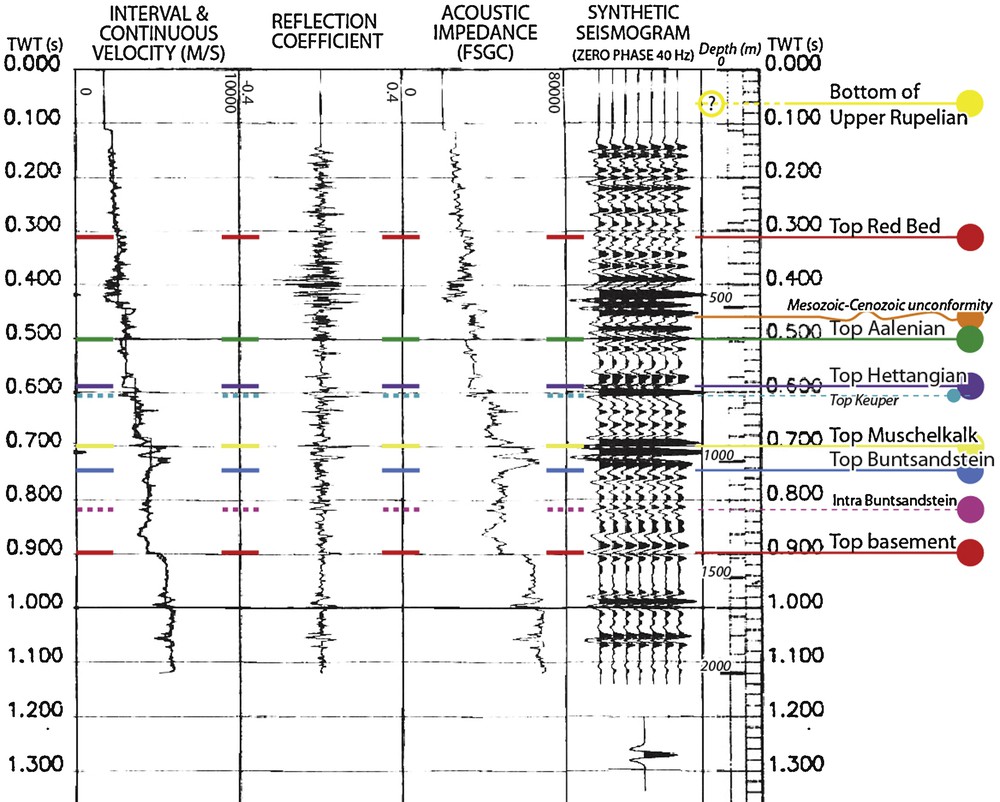
Calibrated sonic velocities, resulting synthetic seismogram, and main reflectors in GPK1 (modified after EEIG “Heat Mining” documents, (Cautru, 1989)).
Vitesses soniques calibrées, sismogramme synthétique en résultant, et principaux réflecteurs au puits GPK1 (modifié d’après documents du GEIE « Exploitation minière de la chaleur », (Cautru, 1989)).
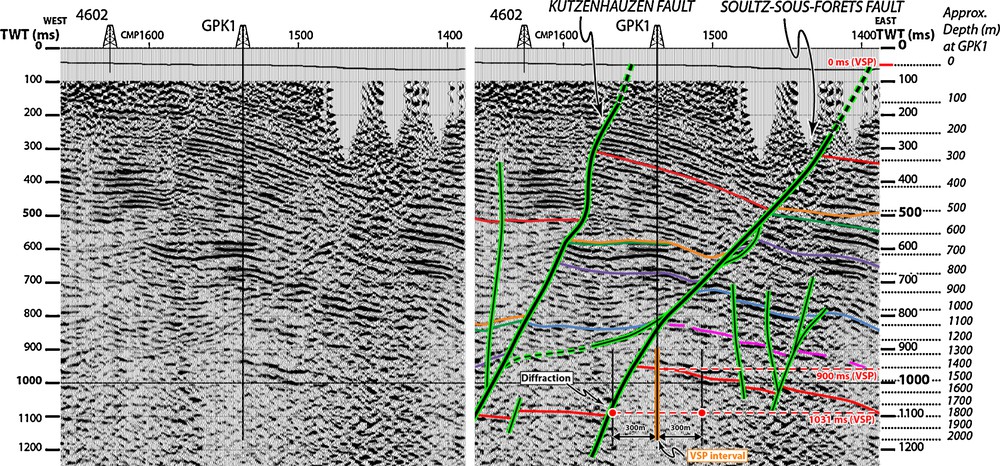
PHN84J seismic reflection profile before and after interpretation in the Soultz-sous-Forêts fault area (color code is given in Figs. 2 and 3). Zero time of VSP, given by the black curve, does not correspond to the zero time of the reflection seismic profile. The top of basement located at about 900 ms by calibrated logs in GPK1 (Fig. 3) fits the corresponding reflector on the seismic section. The diffraction could occur at the two red point locations, but arguments detailed in the text are in favor of the western one.
Profil de sismique réflexion PHN84J vierge et après interprétation dans la région de la faille de Soultz-sous-Forêts (le code de couleur est donné sur les Fig. 2 et 3). L’origine des temps du PSV, donné par la courbe noire, ne correspond pas à l’origine des temps du profil de sismique réflexion. Le toit du socle situé à environ 900 ms sur des logs calibrés dans GPK1 (Fig. 3) est bien ajusté au réflecteur correspondant sur la section sismique. La diffraction observée pourrait se produire au niveau des deux points rouges, mais des arguments détaillés dans le texte sont en faveur de celui situé à l’ouest.
The strongest and imbricated syn-rift reflectors – Rupelian – correspond to the “Couches à Mélettes” formation. A yellow line has been drawn in the negative phase below, corresponding to the “Schistes à Poissons”, base of the Upper Rupelian (at about 30 My after Roussé, 2006; Total, 1987). This clear unit, cropping out west of Hermerswiller fault (see Ménillet, 1970 and yellow dashed line on Fig. 2b), is recognised in the seismic profile only within the basin to the east of the Soultz-sous-Forêts horst. In general, the other syn-rift formations are inherently characterized by different seismic signatures from one fault block to the other. For example, the Red Bed horizon has been identified thanks to borehole data, but could not have been localised without doubt in compartments where well data are missing. The depth of this unit is therefore approximately drawn between the Soultz-sous-Forêts fault and the Hermerswiller fault (see the question mark on Fig. 2). For the same reason, it has also been difficult to localise the Meso-Cenozoic discordance (orange on Fig. 2b) between the wells where it is recognised. The fact that in some places the top of Aalenian (green on Fig. 2b) seems to disappear or seems to present a variable seismic signature could reveal the presence of the unconformity.
2.4 Main observations
A series of tilted blocks is clearly displayed in the western part of the profile after reprocessing, in accordance with previous interpretations (Cautru, 1989; Dylikowski, 1985; Foehn, 1985; Total, 1987). The Heidenbœsch, Péchelbronn, Hœlschloch and Kutzenhausen faults are identified continuously from shallow reflectors down to the basement through the sedimentary cover (Fig. 2). Thickening of some deposits within the syn-rift sequence – especially below the top Red Bed – is observed mainly due to the Kutzenhausen fault activity. This tilted block group, corresponding to the Merkwiller-Péchelbronn oil field, is limited by the Rhenish Fault bordering the Rhine Graben to the west (Fig. 1, outside Fig. 2), and by the Soultz-sous-Forêts horst to the east.
However, the eastern border of the Soultz-sous-Forêts horst and the sedimentary cover exhibit a more complex fault pattern: (i) On the one hand, the Rupelian units identified within the Hermerswiller fault hanging wall outcrop in its foot wall (Ménillet, 1970), leading to an important throw along this single fault (Fig. 2b). On the other hand, the top of basement shows several little steps rather than a major throw along one fault (between CMP 1100 and 1250); (ii) Antiform-shaped sediments in the Hermerswiller fault hanging wall between CMP 1200 and 1300 might be a signature of fault flattening with depth; (iii) A couple of seismic horizons highlighted in dark and light blue (Fig. 2b) above the top Buntsandstein cannot be followed horizontally at about CMP numbers 1080 and 1100, while a similar seismic reflector sequence, labelled (1), is found just below this gap and presents a different apparent dip value; (iv) Slight variations of the seismic signature of the Keuper are identified in the 950–1200 CMP interval; (v) A poor lateral coherence of the seismic signal is observed in the 1200–1250 CMP and 850–1000 ms zone.
These observations show that the continuity of the Hermerswiller fault from the surface to underlying basement faults is not suitable. The deepest subhorizontal level, highlighted in green, acting as a decollement level, could lead to a local thrusting of the little block of Muschelkalk labelled (1) by a sheet of the same unit (Fig. 2b). This interpretation would explain the first three points above. This decollement would occur within the top of Buntsandstein clay units.
The continuity between the Hermerswiller fault and this decollement is not clear, and the two last observations above lead to identify a rooting of the Hermerswiller fault in the Keuper salt series with a possible accumulation of plastic material below the Hermerswiller graben due to back flow. This decollement is represented by the upper subhorizontal green line in the 1100–1200 CMP interval on Fig. 2b.
At the western border of the horst, the Soultz-sous-Forêts fault exhibits a complex fault pattern (Figs. 2 and 8). A continuous fault segment is recognised through the whole sedimentary sequence by reflector terminations. The top of basement is also shifted, as its position can be inferred from a diffraction event observed on VSP (see Section 3) despite it being not clearly identified in the hanging wall by seismic reflection. Between 600 and 900 ms, an interface limiting laterally the reflectors is clearly resolved and presents a decrease of its dip value with increasing depth. This curved fault is connected in its upper part to the Soultz-sous-Forêts fault and is lost while it becomes subhorizontal within the Upper Buntsandstein. A connection of this fault to the Kutzenhausen fault is unclear.
2.5 Discussion
The fault pattern is complex at the eastern boundary of the Soultz-sous-Forêts horst but it can be easily explained in the light of previous works. A plastic layer between a basement and its cover sequence submitted to extension lead to extensional forced folds as described by analogue modelling (Withjack and Callaway, 2000). A detached horst near the hanging wall hinge may also result from this bending, that explains the individualisation of the block labelled (1) (Fig. 2) in an early stage of the Tertiary extension. Then, higher displacement caused a local thrust of the block resulting in a pop down with a subsequent slight clockwise rotation. Such thrusting in extensional contexts has been reported by Vendeville (1987).
In the western border of the horst, the Soultz-sous-Forêts fault presents a second branch that becomes sub-horizontal with depth, but no salt rollers characterized by low seismic signal coherence can be identified in this zone. The thickness of the prerift sequence in the two Kutzenhausen fault compartments is quite well preserved. Evidence of decollements is therefore not as clear as in the Hermerswiller area. The curved branch of the Soultz-sous-Forêts fault may be a relay segment linked to the Kutzenhausen fault.
The Tertiary east-west extensional stress regime (Schumacher, 2002) led to classical normal faulting and blocks tilting in the western part of the profile as previously described (Cautru, 1989; Dylikowski, 1985; Foehn, 1985; Total, 1987). However, more complex deformation accommodations at the Soultz-sous-Forêts horst location are now identified: clay and salt units of the top of Buntsandstein to Middle Muschelkalk, and Keuper formations may act as decollements. The flattening of faults in the Keuper units is a phenomenon already observed in the Rhine Graben (Maurin, 1995; Nivière, 1998).
The only principle to be respected in an intraplate continental extension is an accommodation of a same extension rate by the basement and its cover. In the case of an overburdened basement, the normal faults can be continuous in depth, if the materials are entirely brittle. If ductile layers are present within the sediments, decollements and decoupling can occur. Such a decoupling layer may allow a sedimentary cover to develop structures orthogonally to the main extension direction whatever the direction of the probably reactivated faults of the basement (Higgins and Harris, 1997).
The Tertiary east-west extension – triggering north-south normal faulting – could have been superposed to the inherited Hercynian structural gain – striking N40°– of the basement (Edel et al., 2007). Main fault trends at either N0° or N30° values, identified from the top of Triassic deposits to the surface, are in agreement with such a decoupling (see Cautru, 1989; Foehn, 1985; Ménillet, 1970; Total, 1987 and insert in Fig. 1).
Borehole imagery and core analysis in the EPS1 geothermal well showed that the fractures in the Permian and Triassic sandstones present a N0° to N170° trend, whereas this value is N20° to N40° within the crystalline basement (Genter et al., 1997). Decollements may explain this discrepancy, occurring in centimetric to pluri-decimetric thick clay levels in the sandstones.
The east-west 2D approach taken in this article is too limited for further interpretation. Other 2D lines parallel to the present profile, or other geophysical data are necessary to measure the azimuth of the faults.
Some features not directly linkable to the Tertiary extension might be the consequences of Late and post-Oligocene strike - slip movements documented in the region (Schumacher, 2002). Even if no clear strike - slip features have been identified, the Hœlschloch fault system looks like a flower structure. The antiform shaping of the sediments in the Hermerswiller fault hangingwall could be related to this tectonic regime as well.
3 3C VSP interpretation applied to diffraction
3.1 Description of the data
In the Soultz-sous-Forêts project, the first exploration borehole called GPK1 has been drilled in 1987 down to 2002 m; in this vertical well, the granite is encountered at 1377 m under Permian to Oligocene sediments. Several seismic surveys have been carried out in this well (for example Beauce et al., 1991; Le Bégat et al., 1994). In this article, we focus on a three-component (3C) VSP campaign acquired in 1988 in this borehole around the contact between the sediments and the basement. This 3C VSP data set is composed by a zero-offset VSP recorded at 27 receiver positions between 1250 and 2000 m (30 m spacing) and 6 check shots at 100, 300, 500, 700, 900 and 1050 m (Figs. 1 and 4). Also, three offset VSPs have been acquired at 17 receiver levels (30 m spacing) between 1250 and 1730 m in depth, with source offsets between 500 and 900 m. A conventional VSP processing – consisting in a sonic log calibration and computing a synthetic seismogram (Fig. 3) – had been applied by Schlumberger on these data in the 150–2000 m depth interval. The pre-processed sections and the processing results are available only on paper.
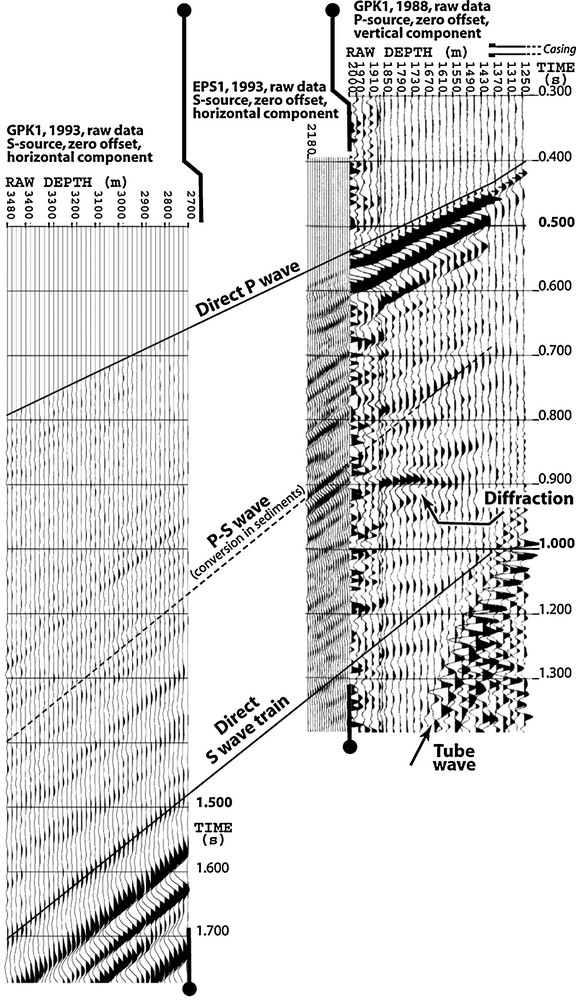
Selected time-depth domain of the vertical component of the zero offset VSP acquired in 1988 in GPK1 exhibiting a highly energetic diffraction. Additional VSP records from the 1993 acquisition in GPK1 and EPS1 (located ∼500 m southeast of GPK1, labelled OGWH in Fig. 1) are represented at the same time and depth scales to illustrate the occurrence of S direct and P-S converted arrivals.
Composante verticale du PSV à déport nul acquis en 1988 dans GPK1 (domaine de profondeur et de temps restreints) montrant une diffraction de forte énergie. D’autres enregistrements issus des acquisitions de 1993 dans les puits GPK1 et EPS1 (situé ∼500 m au sud-est de GPK1, noté OGWH sur la Fig. 1) sont représentés aux mêmes échelles de temps et de profondeur pour montrer l’arrivée directe S et des arrivées P-S converties.
3.2 VSP arrivals identification
The vertical component of the zero-offset VSP GPK1 shows three main events between 1250 and 2000 m (Fig. 4). The first one is the P wave direct arrival, presenting an apparent higher amplitude in the open hole section (the casing shoe was located at 1420 m at this period) than in the cased section. Then, a clear line up appears on the three components at 900 m (0.75 s) and is strongly attenuated with depth until about 1610 m (1.2 s). Its regular attenuation with depth indicates that the propagation of this wave does not depend on the tool position in the cased or open hole section, as observed for the P direct arrival. Thus, this wave is identified as the downgoing branch of a tube wave. Its velocity of about 1500 m/s is consistent with P wave velocity in water. After the P direct arrival, a strong event is observed in the 1580–1880 m depth interval, occurring at about 900 ms (Fig. 4). At greatest depth, this signal and the direct P wave are lost because of the high level of noise. This arrival presents a hyperbolic pattern denoting a diffraction with an apex located at about 1745 m. This signal is obvious on the vertical component but is not visible on the horizontal components; as the well is almost vertical, the seismic energy of this diffraction event is vertically polarised. Since the diffracted wave propagates almost horizontally from the diffracting structure to the well, this diffraction event is attributed to an S wave, vertically polarised. In addition, the very strong amplitude of this signal on the vertical axis represents about 30–40% of the amplitude of the P wave direct arrival.
3.3 Interpretative exploitation of diffracted events
A single step formed by a vertical fault affecting a horizontal or subhorizontal reflector is the basic model usually studied to describe the diffractions occurring in faulted horizontally layered media. Waveform, frequency content, amplitudes of the diffracted waves, and other interpretation problems like overlapping of the waves, localisation of the fault, multiple effects… are largely documented in numerous papers (e.g. Angona, 1960; Berryhill, 1977; Harper, 1965; Hilterman, 1975; Rieber, 1937; Trorey, 1977; Zhang et al., 1990). All these works, applying seismic reflection can be transposed to VSP only after necessary adjustments. In particular, an approach was proposed in Grad and Perchuc (1978) to deduce the average velocity of the media and the position (offset and depth) of the diffracting body from the least square method applied to diffractions. However, if the geometry of acquisition is different from this case study (see an illustration in Dinstel, 1971), an error is introduced in the results that has been successfully solved by Schilt et al. (1981) to locate deep diffracting heterogeneities in the crust. Nevertheless, concerning the diffractions on VSP data sets, it is often possible to determine the P and S interval and sonic velocities.
In our case study, no clear signature of the diffraction is visible on the VSP horizontal components, which prevents any determination of the azimuth of the diffracted arrival. Nevertheless, it is possible to estimate the shorter distance between the borehole and the diffracting structure (called D in the following paragraphs) from the vertical component only using two complementary methods, basically illustrated in Fig. 5.
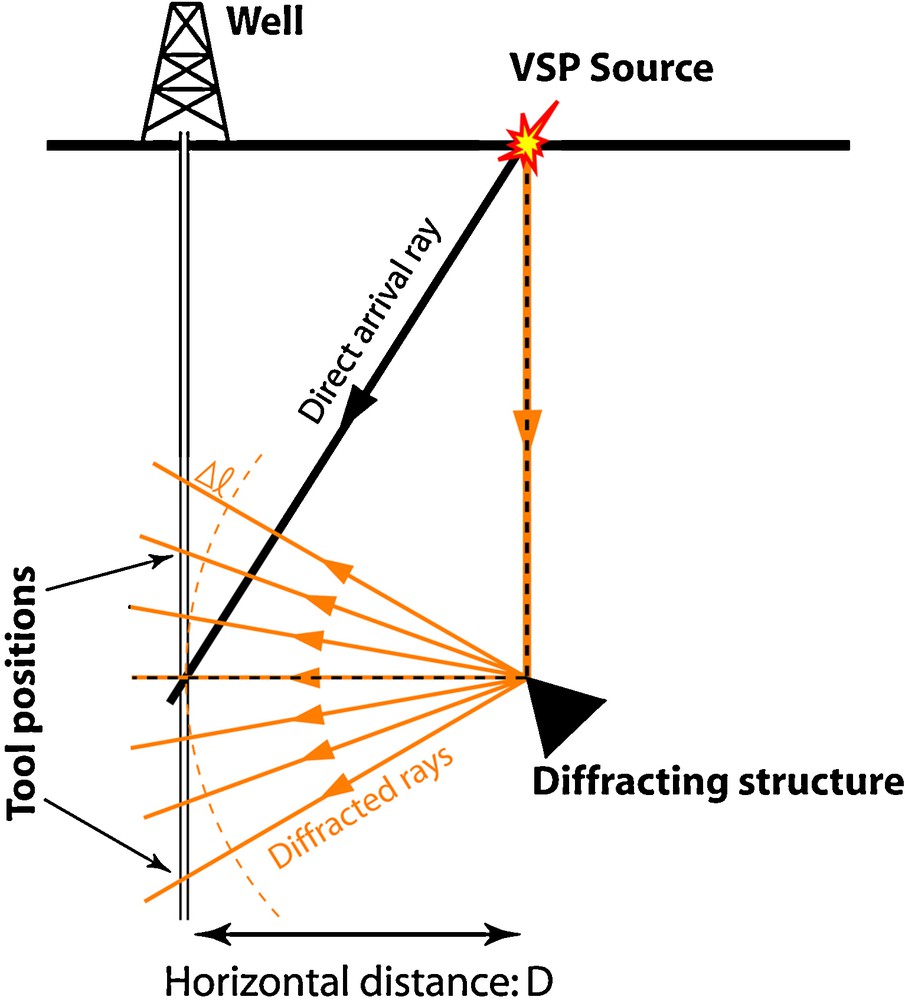
Sketch of the ray path recorded in a VSP survey when diffraction occurs (side view of the rays contained in a vertical plane). Two types of data allow one to determine the distance D between the diffracting structure and the well: (i) The difference in arrival time of the diffracted wave due to the length variation Δl of the path occurring at different depth levels (in orange); (ii) The time difference between the direct arrival (in black) and the diffracted wave at apex depth (dotted path) related to the velocity of the diffracted wave.
Schéma de propagation de rais diffractés enregistrés par PSV (vue latérale d’un plan vertical). Deux éléments permettent de déterminer la distance D qui sépare le puits du diffracteur : (i) La différence de temps d’arrivée enregistrée à chaque niveau d’enregistrement liée à la variation de longueur de propagation Δl (en orange) ; (ii) La différence de temps entre l’arrivée directe (en noir) et l’onde diffractée à la profondeur de l’apex (en pointillés) liée à la vitesse de l’onde diffractée.
The first method is based on the curvature of the hyperbolic arrival: the larger the distance of the diffracting structure from the borehole, the flatter the hyperbolic pattern. This hyperbolic shape is due to a difference in the distance between the diffracting body and the well at different depth levels (annotated Δl on Fig. 5). Thus, knowing the mode and the velocity of the diffracted wave from the direct VSP arrivals, it is possible to derive the distance D. The second approach uses the travel time difference between the direct and diffracted arrivals at apex depth, related to the velocity of the diffracted wave. The travel paths of the incident arrival generating the diffraction is represented by black and dotted lines in Fig. 5.
An illustration of their application to a sedimentary context from four-component VSP field data or from elastic wave modelling is proposed by Place et al. (2007). As these two methods are not limited to a specific geological environment, we illustrate in the present article their detailed application to crystalline rocks overlain by sediments.
3.4 P and S wave velocities
The velocities of seismic waves are required to apply these methods. On the 1988 VSP records, the P direct arrival is clear, so that the P wave velocity can be easily calculated (Vp = 5660 m/s). However, no direct S wave is visible on the zero offset VSP (Fig. 4) and offset VSPs, even on horizontal components. As P and S direct arrivals are observed in the VSP survey carried out in 1993 in a deeper part of the same well (Fig. 4), and assuming that the Vp/Vs ratio is constant in the basement (1.63), a value of Vs = 3470 m/s is deduced within the 1400–2000 m depth interval.
3.5 Estimation of distance D by curvature
The results of the estimation of the distance D by the first method are gathered in Fig. 6. The seismic traces focused on the hyperbola are shown. Four depth levels highlighted in red have been selected for the quality of their signal, allowing precise time picking. The computation of D results in values matching to each other at about 310 m (Fig. 6). The computed distance is highly sensitive to the precision of the time difference picking, since a variation of ±1 ms generates at maximum an error of ±80 m. The sensitivity to the velocity of diffracted S wave is about 10 m for ±100 m/s. Assuming that the well is vertical at the hyperbola depth (the average inclination is about 1.8° at this level), the diffraction structure is located at about 1745 m in depth (i.e. the apex depth), 310 m away from the GPK1 well. Reasonable errors intervals for this location are ±20 m in depth and ±50 m in the calculated horizontal distance.
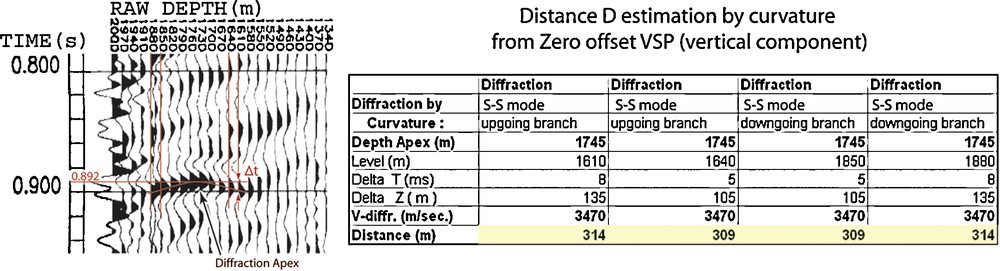
Precise time picking of the diffraction event allowing one to assess the distance D from the curvature of the hyperbola. A coherent estimation of the distance D is about 310 m from time picks positioned at the maximum of the phase. Similar results are obtained from time picks positioned on the zero.
Pointé précis de l’arrivée diffractée permettant d’estimer la distance D à partir de la courbure de l’hyperbole. Une estimation cohérente de cette distance D est d’environ 310 m à partir des pointés du maximum de la phase. Des valeurs similaires sont obtenues à partir des pointés du zéro de la phase.
3.6 Estimation of distance D by travel time
The incident wave which generates the diffraction cannot be subjected to multiple reflection because of its strong energy. Only a direct travel path between the source and the diffracting structure has to be considered. Then, the identification of the elastic mode of this downgoing wave can be deduced from first order travel time computations. A simple velocity model has been built: it is composed by two layers – representing the sediments and the granite – separated by a horizontal contact at 1377 m depth (Fig. 7). P and S wave velocities are already known in the granite (see above); in the sedimentary cover the P wave velocity is chosen to verify the travel time of the direct wave, leading to Vp sediments = 3090 m/s, which is of course consistent with the value given by the velocity survey. To simplify the calculations, all the travel paths are considered to be linear, and the direct travel path is considered to be vertical. The results of the computation are (Fig. 7):
- (i) A P wave then diffracted in S mode arrives at too early time (0.608 s);
- (ii) The conversion of a P wave to S wave at the interface between the two layers infers a travel time of about 0.649 s, still too short;
- (iii) As the direct S wave arrives much later than the diffracted wave (Fig. 4), the diffraction cannot be generated by this S wave either.
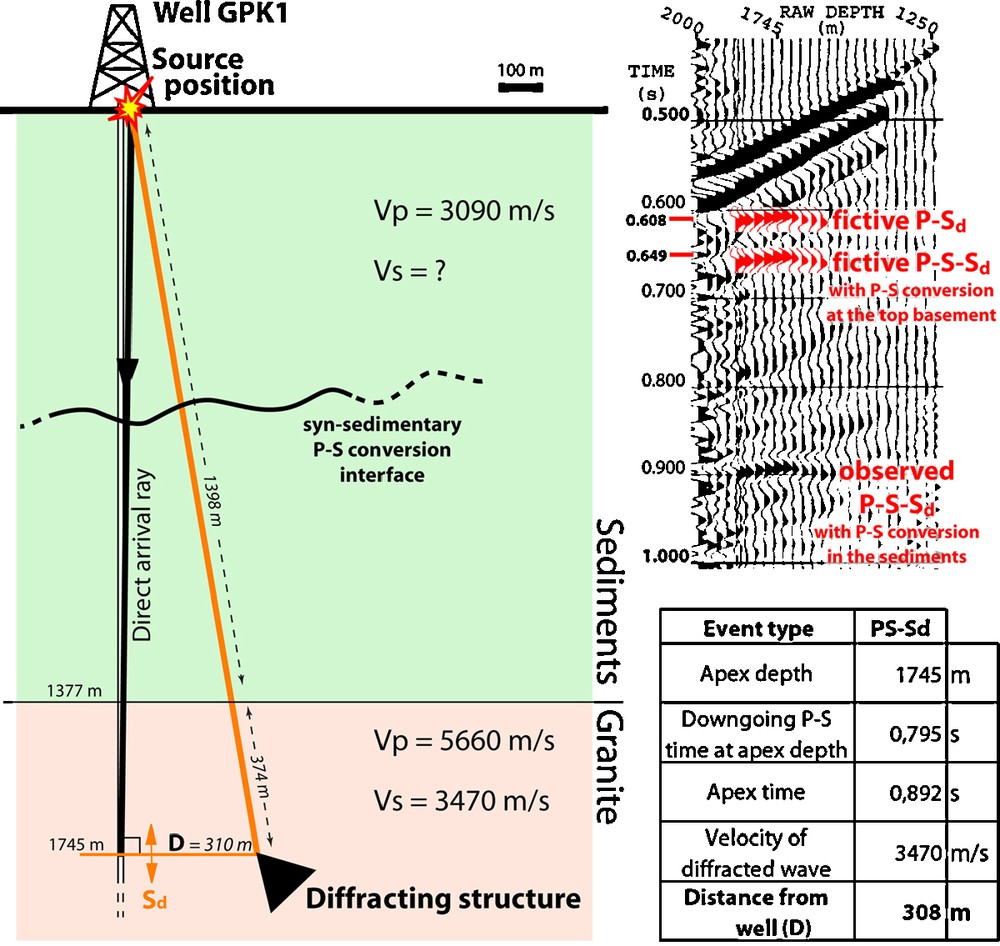
Diffracted propagation in a simplified model (at scale). A P-S downgoing arrival, converted in the sedimentary overburden, propagates from the source and generates a diffracted S wave toward the well (left side sketch). The computation of D from the travel time computation method (table) is applied to the P-S converted arrival observed in EPS1 at diffraction apex depth.
Illustration de propagation diffractée dans un modèle de vitesse simplifié (à l’échelle). Une propagation de type P-S convertie dans la section sédimentaire entre la source et le diffracteur génère une arrivée diffractée de type S vers le puits (schéma de gauche). Le calcul de la distance D d’après la méthode des temps de trajet (tableau) est appliqué à l’onde convertie incidente P-S observée dans EPS1 à la profondeur de l’apex de diffraction.
A velocity value of 2000 m/s is required to fit the observed travel time, thus being interpretable only as a partitioning of P and S propagations with a conversion occurring in the overburden. The travel time method applied to the high energy P-S converted arrival observed in EPS1 considered at apex depth (Fig. 4) leads to a D value of 308 m (table of Fig. 7).
3.7 Discussion
The diffracted S wave observed in GPK1 can be considered with confidence as generated by a clear P-S downgoing arrival converted in the sedimentary overburden, as illustrated by the 1993 data set acquired in GPK1 and EPS1 (Fig. 4). The distance of the diffracting object to the well is estimated to ∼300 m by two methods. However, no clear P-S arrival is observed on the 1988 GPK1 data set.
Previous seismic studies (Cautru, 1989; Foehn, 1985; Total, 1987) showed that no major faults offsetting the sediments and the top of basement with approximate east-west azimuth values are identified in the Soultz-sous-Forêts region. Consequently, the PHN84J is orthogonal to the most important Tertiary faults of the area, and the major structures able to generate a strong diffraction are probably imaged in the seismic section (Fig. 2). Thus, the GPK1 well has been represented on Fig. 8 after an orthogonal lateral projection. Two red points representing two possibilities of the diffractor position are plotted at 300 m laterally from the well at the 1745 m depth value, converted into time (1031 ms) according to the time-depth curve derived from the GPK1 VSP (Fig. 3). The red point to the west of GPK1 is located right on the concave corner of sediments brought into contact with the basement by the Soultz-sous-Forêts normal fault (Fig. 8). The eastern point, located inside the basement, can be rejected as a major diffracting structure.
Fig. 8 illustrates that the downgoing P-S wave generating the diffraction propagates entirely in the sediments. This implies only minor changing in travel time results of Fig. 7. In addition, the onset of the direct S wave cannot be as precisely picked as the P direct wave (Fig. 4); thus the interface where the P to S mode conversion occurs cannot be identified within the sedimentary cover by upward continuation of the time-depth curves (Fig. 4).
The generation of diffractions by fault steps is well documented, but their study is often applied to wave propagation in P mode and restricted to the upper (convex) corner especially in seismic reflection (e.g. Angona, 1960; Berryhill, 1977; Harper, 1965). Our case study is more similar to the results obtained by multi-component VSP field records and/or elastic wave modelling analysis, (Levander, 1988; Place et al., 2007; Virieux, 1986), showing that diffractions may occur both at concave and convex fault corners. This similarity strengthens our interpretation of the diffracting fault edge located on the western side of the GPK1. The present P-S-S diffraction by an elongated fault corner exemplifies another seismic response of this kind of structure.
The slight discrepancy observed between the position of the diffractor (western red point in Fig. 8) and the corner imaged by seismic reflection can result from several causes: (i) the GPK1 well is located about half a kilometre south of the seismic line (Fig. 1); (ii) time-depth relation in the GPK1 well is not perfectly representative at the seismic line position, especially due to the Soultz-sous-Forêts fault position; and (iii) the deep part of the GPK1 well is slightly deviated, in contrast with the sketch on Fig. 8.
Curiously, no other diffraction in P or S mode can be observed at the concave or convex Soultz-sous-Forêts fault corners on the zero offset VSP or on the three offset VSPs. Therefore, a minor variation of the seismic source position at the surface (about 15°–30° seen from the diffractor) does not result in diffraction in the GPK1 well, even with lower amplitude. It emphasises the complex elastic behaviour of diffracting objects, in particular their radiation patterns, as already observed in previous case studies (Naville et al., 2004; Place et al., 2007). The theoretical aspects of diffraction is poorly documented, except some attempts regarding basic fault step geometry (Berryhill, 1977; Grad, 1984) or cracks (e.g. Coutant, 1989; Kawahara and Yamashita, 1992; Liu et al., 1997; Tan, 1977; Van der Hijden and Neerhoff, 1983; Wu and Aki, 1985). Such approaches should be continued to more accurate fault step geometries to address their very erratic and anisotropic radiation patterns. One issue of such studies would be to assist the diffractions to occur, by accurately positioning the sources and receivers around possible diffractors. Nevertheless, it is noteworthy that the exploitation of diffractions is mastered enough for structural geology applications, helping the interpretation in various geological contexts. For example, such an analysis could be applied to the VSP data set presented in Marti et al., 2006 where a nice diffraction probably marking fault intersection is neglected (Fig. 3 of their paper).
4 Conclusion
The updated interpretation of the PHN84J seismic line confirms that no important Tertiary throw occurred on the faults that are intersected within the basement by the geothermal wells. In addition, possible decollements occurring in Triassic formations may decouple deformation between the basement and the cover, leading to complex fault patterns, such as the Hermerswiller fault. Thus, the exact location of the basement faults in the Soultz-sous-Forêts area cannot be inferred from mapping only syn-sedimentary faults.
Even after a successful reprocessing, leading to improved 2D seismic images, the lower part of the sedimentary cover and the top of the basement are still not clearly highlighted everywhere along the line. Faulting and low fold 2D seismic imaging possibly explain the local blurring of the seismic image. However, the top basement interface can definitely be tracked as a discontinuous reflecting horizon all along the line. This constitutes an encouraging prospect for successful 3D surface seismic imaging surveys in area similar to the Soultz-sous-Forêts geological setting for defining the well placement and trajectory.
Post drilling, the VSP processing method using the oriented three components can complement the structural interpretations, as shown by the present delineation of the Soultz-sous-Forêts horst from a diffraction analysis. Polarity analysis on 3C records and travel time computations may be carried out to locate the diffracting heterogeneity without specific data processing. Moreover, only P-S-S diffraction is observed from only one source position and no other diffraction of other modes are recorded on the whole VSP data set. This illustrates the complex seismic response of diffracting corners.
Acknowledgements
We would like to gratefully thank Franck Hanot (BRGM) for supervising and taking an active part in the processing of the PHN84J line, and Isabelle Thinon (BRGM) for her helpful assistance in its interpretation. EEIG “Heat mining” members are thanked for providing the VSP data and for their kind help. Thanks also to the reviewers, Thomas P.-O. Mauduit and one who remains anonymous, for their constructive comments on the manuscript. The authors gratefully acknowledge the EEIG “Heat mining”, ADEME (Agence de l’environnement et de la maîtrise de l’energie) and EIfER (European Institute for Energy Research) organisations for funding this study.