

1 Introduction
Improving knowledge on the factors controlling the variability of water resources on inter-annual to multi-decadal time scales is of major importance in a context of global climate and environmental change. This may help explain observed hydrometeorological/hydrological events such as floods, exceptional storms and sustained droughts (Hurrell, 1995); many studies are currently underway in this field (Chaouche et al., 2010; Jhajharia et al., 2012).
In Europe, approximately 50% of winter climatic variability is explained by the North Atlantic Oscillation (NAO) (Cassou et al., 2003; Hurrell and Deser, 2009; Hurrell and Van Loon, 1997). Several studies have investigated the variability of the NAO either with Fourier spectral analysis (Fernández et al., 2003; Pozo-Vasquez et al., 2000) or continuous wavelet transform (CWT) analysis (Appelenzeller et al., 1998; Higuchi et al., 1999; Labat et al., 2005; Loboda et al., 2006; Massei et al., 2007). In the latter, the different modes of variability defining the time-varying structure of the NAO signal were delineated. The NAO corresponds to a north-south oscillation, formed by the interaction of the Icelandic low and Azores high. The NAO index (NAOI) is calculated from the difference of standardized sea level pressure (SLP) between these two atmospheric centres of action. In this study, we used NAOI data defined by Li and Wang (2003) as “the differences of normalized SLP regionally zonal-averaged over a broad range of longitudes 80°W–30°E”. In previous studies (Massei et al., 2007), we investigated long-term variations in the Seine River flow and precipitation at a daily time step and attempted to relate these to large-scale climate fluctuations, taking the annual NAO as a reference. The results showed that inter-annual spectral components common to river flow, precipitation and NAO may relate this large-scale climate pattern to hydrological variability. However, bivariate analysis (using wavelet coherence or cross-spectral analysis) was not possible because of different time step. Although a daily NAOI is available, this indicator of North Atlantic climate is associated with much more complex patterns than the annual winter-months (December-March/DJFM) NAOI time series, which more clearly captures the Icelandic low/Azores high oscillations on inter-annual time scales. We then preferentially focused on the winter NAO to investigate the origin of the inter-annual variability of precipitation. Here, we focus on the annual time steps in order to conduct continuous wavelet bivariate analyses between precipitation on the Seine River watershed and the annual winter-months NAO.
In this article, we investigate the winter-months precipitation inter-annual to pluri-decennial variability in the Seine River watershed and its relationships with the North Atlantic climate variations, using the NAOI as a reference. We first briefly analyse nine selected station-based precipitation records on the Seine watershed, focusing on the 1951 to 2004 period: this time period is also the same as that of the Seine River flow measurements at the most downstream station on the watershed before the estuary. Several weather stations in the area are used in order to check whether large-scale temporal variations are well recorded on the whole watershed, which might not be as straightforward, especially when comparing the most eastern and western stations of the basin. Taking the example of the Paris station, we then investigate the linkages between the two centres of action upon which the NAO index is determined, so as to obtain slightly more physical insight into the links between precipitation and climate oscillations. Finally, we use one long-term precipitation time series (Paris, 1873–2004) to investigate the evolution of precipitation on a secular scale in relation with the long-term NAO index. This will allow replacing in the long-term the evolution observed over short-term periods for precipitation or river discharge on the Seine watershed, for which long time series (i.e. longer than a few decades) are most often unavailable.
2 Data and methods
The climate in the area studied is of the oceanic type (Champeaux and Tamburini, 1995). The winter monthly average range of precipitation data is relatively homogeneous, corresponding to a winter average ranging between 184.3 mm (Chartres) and 264.1 mm (Chatillon-sur-Seine), and with a standard deviation ranging between 57.4 mm (Bretigny-sur-Orge) and 90.6 mm (Chatillon-sur-Seine).
Nine precipitation time series on the Seine watershed are used in this study (Fig. 1). Data were obtained from the database compiled for the European Climate Assessment (ECA) as presented in Klein Tank et al. (2002), who demonstrated in this paper the quality of the ECA data sets. The maximum variability of NAO occurs in winter (Hurrell et al., 2003), which is why we used cumulated winter-months (DJFM) precipitation data to evaluate the covariation between NAOI and NW European rainfall. The NAOI data used in this study were defined by Li and Wang (2003) for the 1873 to 2004 period.
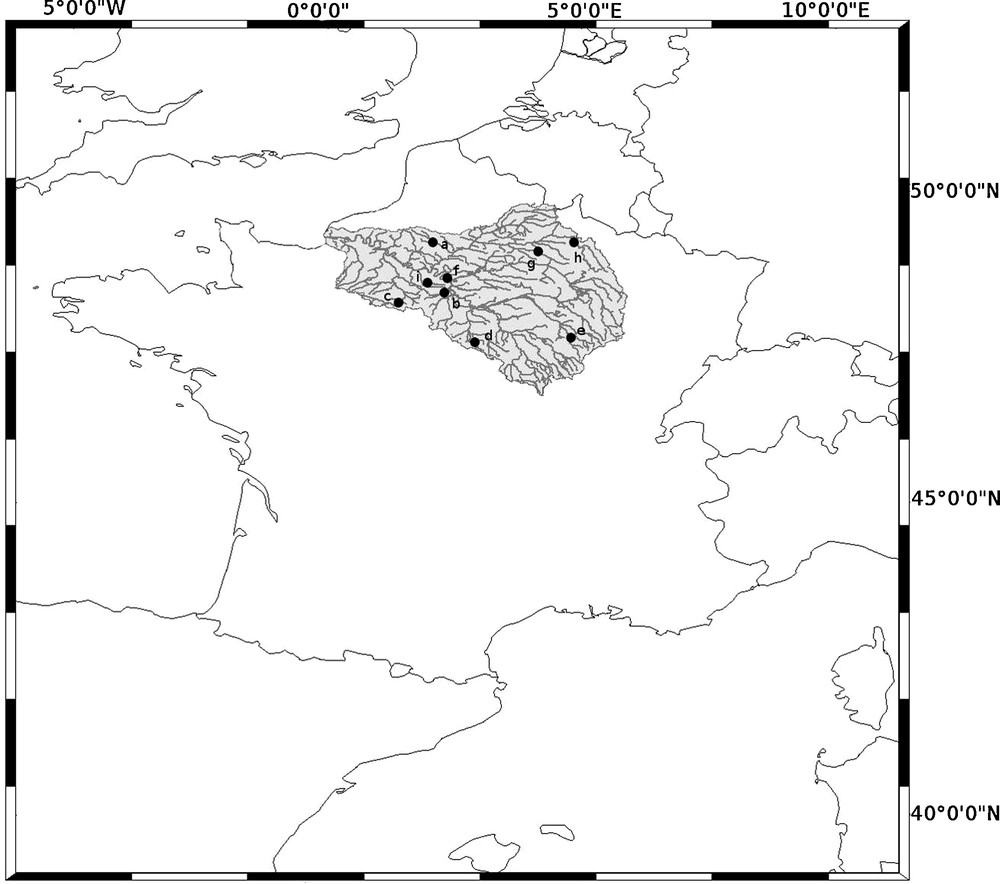
Seine River watershed identification and stations of precipitation identification. a: Beauvais-Tille; b: Brétigny-sur-Orge; c: Chartres; d: Chatillon-Colligny; e: Chatillon-sur-Seine; f: Paris; g: Reims; h: Trappes; i: Vouziers.
Délimitation du bassin-versant de la Seine et emplacement des stations de précipitations utilisées. a : Beauvais-Tille ; b : Brétigny-sur-Orge ; c : Chartres ; d : Chatillon-Colligny ; e : Chatillon-sur-Seine ; f : Paris ; g : Reims ; h : Trappes ; i : Vouziers.
As a first step, in order to identify the trend in the short-term 1951 to 2004 precipitation time series, a LOESS local polynomial regression was used, as proposed by Cleveland (1979) and developed by Cleveland and Devlin (1988). LOESS combines much of the simplicity of linear least squares regression with the flexibility of non-linear regression. At each point in the data set, a low-order polynomial is fit to a subset of the data, with explanatory variable values taken near the point whose response is being estimated. The polynomial is fit using weighted least squares, giving more weight to points near the point whose response is being estimated and less weight to points further away. The value of the regression function for the point is then obtained by evaluating the local polynomial using the explanatory variable values for that data point. A user-specified input to the procedure called the “smoothing parameter” determines how much of the data is used to fit each local polynomial. In this study, the smoothing parameter was set to 100%, which allows the lowest frequencies in the data to be detected.
In addition, segmentation was also undertaken to identify change points in terms of mean and/or variance that may be present in the data. In short-term series, classical binary segmentation is applied to the characterization of potential changes in the mean from 1951 to 2004, and compared to the variations that can be shown by LOESS smoothing. As for the long-term series, segmentation was undertaken as well to detect change points in the mean and variance, to be compared to the analysis by CWT. Here, the Pruned Exact Linear Time (PELT) method developed by Killick et al. (2011) based on the algorithm of Jackson et al. (2005) was used to detect the changes in the mean and variance through time.
CWT analysis is designed to identify the spectral structure of transient signals. It is particularly appropriate for assessing the dominant modes of variability, potentially changing through time, that characterize natural geophysical signals. Detailed explanations of the CWT methodology and its application to hydrometeorological or climatic time series are now widely documented in the literature (Anctil and Coulibaly, 2004; Labat et al., 2005; Torrence and Compo, 1998). The analysis of NAO and precipitation time series by CWT was used to compute the wavelet coherence (WCO) and phase, to highlight the relationships between the two signals using the Sowas R package by Maraun and Kurths (2004). Component extraction and reconstruction were also performed in R by wavelet multi-resolution analysis using order 18 Daubechies wavelets (Labat et al., 2000, 2002).
3 Changes in the evolution of precipitation on the Seine watershed and relation with the North Atlantic Oscillation pattern from 1951 to 2004
In the first part of this section, nine weather stations in the Seine watershed are briefly analysed in order to assess the influence of large-scale climate oscillations on the inter-annual variability of precipitation and to ensure that no local effects alter this variability.
3.1 Characteristic time scales of the North Atlantic Oscillation index/precipitation relationship
The study of short-term precipitation data highlighted two main periods that can be distinguished by a significant change in the mean with a change point located in the mid-1970s. Indeed, binary segmentation identified one change point in most precipitation series, emphasizing the existence of a period of higher winter precipitation after the mid-1970s (Fig. 2). On the other hand, LOESS smoothing also identified the existence of such a change point, but instead indicated that this corresponded to a longer-term trend involving a decrease in precipitation until the end of the study period (2004). Both segmentation and LOESS also revealed a different pattern for one weather station (Fig. 2d), emphasizing a change point in the late 1980s instead of the mid-1970s, which might be due to local effects. However, this last change point was also found in the daily precipitation data of the study area (Massei et al., 2007) as well as in the Seine flow series (Massei et al., 2009). In these studies, it was suggested that both the mid-1970s and late 1980s change points were related to changes in the time/scale variability of the NAO pattern: ∼18-year and ∼ 6-year inter-annual to pluri-decennial scales of variability were found to characterize periods covering the mid-1970s to early 2000s and late 1980s to early 2000s, respectively. It then seems useful to compare the evolution of the NAOI and changes in precipitation through wavelet coherence analysis in an attempt to better identify their degree of correlation.

Winter-months (December to March) precipitation data (grey dotted line). a: Beauvais-Tille; b: Brétigny-sur-Orge; c: Chartres; d: Chatillon-Colligny; e: Chatillon-sur-Seine; f: Paris; g: Reims; h: Trappes; i: Vouziers. LOESS smoothing (grey long-dashed line) and segmentation (black line) for the 1951 to 2004 period.
Précipitations cumulées sur les mois d’hiver (décembre à mars) (en lignes grises pointillées). a : Beauvais-Tille ; b : Brétigny-sur-Orge ; c : Chartres ; d : Chatillon-Colligny ; e : Chatillon-sur-Seine ; f : Paris ; g : Reims ; h : Trappes ; i : Vouziers. Leur lissage par LOESS (en ligne tirets longs gris) et les résultats de la segmentation (en ligne continue noire) pour la période 1951 à 2004.
The correlations between NAOI and precipitation by wavelet coherence analysis (Fig. 3) point out that most stations were characterized by three time periods of inter-annual variability, i.e. before the mid-1970s, from 1970 to 1990 and after 1990. These periods can be distinguished by the presence or absence of significant correlations on the ∼6-year variability scale. For most stations, the periods before the mid-1970s and after 1990 are characterized by a statistically significant correlation between NAOI and winter precipitation for the ∼6-year variability scale. However, no such correlation is observed at this scale for the period between the mid-1970s and 1990. These observations are similar to the results obtained by CWT and reinforce the presence of a NAOI/precipitation relationship for these scales of variability. We also note the presence, for all these periods, of a statistically significant correlation between NAOI and winter precipitation for the ∼18-year variability scale for most stations. For the time period considered, however, this low-frequency scale of variability must be interpreted with caution, more specifically in terms of variance estimation, and it falls into the cone of influence of the continuous wavelet spectrum. Nevertheless, results from the long-term analysis provided hereafter still validate at least the existence of this ∼18-year component. The phase diagram of the wavelet coherence analysis gives more information on the NAOI/precipitation relationship (Fig. 4). It appears that the two signals are out of phase over the ∼18-year variability scale. For the ∼6-year variability scale, we show a quadrature phase before the mid-1970s and since 1990. These dissimilar phase lags suggest that the NAOI/precipitation relation is more complex than a simple and stationary correlation at these scales.
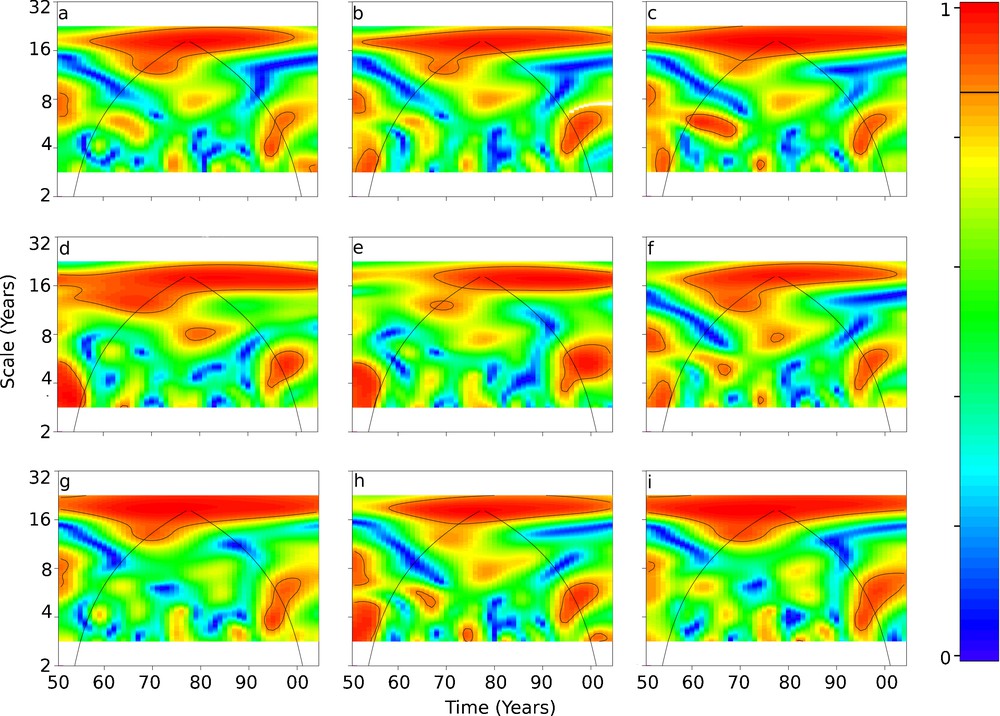
Winter-months North Atlantic Oscillation Index/winter-months precipitation wavelet coherence analysis diagrams for: a: Beauvais-Tille; b: Brétigny-sur-Orge; c: Chartres; d: Chatillon-Colligny; e: Chatillon-sur-Seine; f: Paris; g: Reims; h: Trappes; i: Vouziers for the 1951 to 2004 period. Solid black lines represent the 95% confidence limit.
Analyses des cohérences par ondelettes entre l’indice de l’Oscillation Nord Atlantique et les précipitations en hiver pour les stations : a : Beauvais-Tille ; b : Brétigny-sur-Orge ; c : Chartres ; d : Chatillon-Colligny ; e : Chatillon-sur-Seine ; f : Paris ; g : Reims ; h : Trappes ; i : Vouziers pour la période 1951 à 2004. Les lignes noires continues représentent une limite de confiance à 95 %.
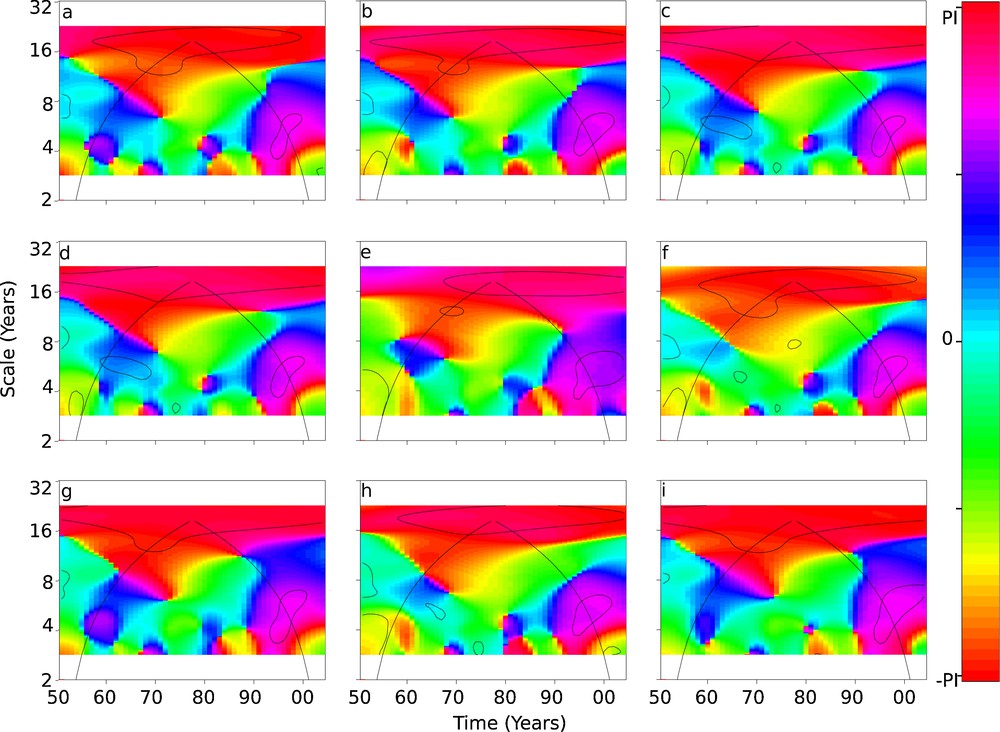
Winter-months North Atlantic Oscillation Index/winter-months precipitation wavelet coherence phase analysis diagrams for: a: Beauvais-Tille; b: Brétigny-sur-Orge; c: Chartres; d: Chatillon-Colligny; e: Chatillon-sur-Seine; f: Paris; g: Reims; h: Trappes; i: Vouziers for the 1951 to 2004 period. Solid black lines represent the 95% confidence limit.
Analyses des phases des cohérences par ondelettes entre l’indice de l’Oscillation Nord Atlantique et les précipitations en hiver pour les stations : a : Beauvais-Tille ; b : Brétigny-sur-Orge ; c : Chartres ; d : Chatillon-Colligny ; e : Chatillon-sur-Seine ; f : Paris ; g : Reims ; h : Trappes ; i : Vouziers pour la période 1951 à 2004. Les lignes noires continues représentent une limite de confiance à 95 %.
3.2 Relationships between precipitation, Azores high and Icelandic low
The observation of dissimilar phase lags depending on the variability time scale previously identified led to the investigation of the relationships between precipitation and the climatic variables upon which the calculation of the NAOI is based. To some extent, it is an attempt to provide a more physical understanding of the corresponding climate–hydrology relationships.
The Icelandic low, represented by the Reykjavik SLP/Precipitation relationship, can be essentially characterized by the ∼18-year variability scale (Fig. 5A). The phase diagram of Icelandic low/precipitation wavelet coherence points out that the two signals are in phase (Fig. 5C). This result shows the presence of a good relationship (the two signals are in phase) between precipitation and the Icelandic low for the ∼18-year variability scale, and a weaker relationship (quadrature phase) between these signals for the ∼6-year and ∼11-year scales.

Wavelet coherence analysis diagrams with the Paris winter-months precipitation and winter-months Sea Level Pressure (SLP) in Reykjavik (A and C) or winter-months SLP in Ponta Delgada (B and D) for the 1951 to 2004 period. Solid black lines represent the 95% confidence limit.
Analyses des cohérences par ondelettes entre les précipitations de Paris et la pression au niveau de la mer (SLP) à Reykjavik (A et C) ou à Ponta Delgada (B et D) en hiver pour la période 1951 à 2004. Les lignes noires continues représentent une limite de confiance à 95 %.
The Azores high, represented by the Ponta Delgada SLP/Precipitation relationship, can be described by two variability scales: the ∼8- to 15-year scale, statistically significant for the period between 1960 and 1990, and the ∼6-year scale, the latter also characteristic of the NAOI/Precipitation relationship (Fig. 5 B). On this ∼6-year scale, the phase diagram of the Azores high/precipitation wavelet coherence indicates a close to quadrature phase since 1990 (Fig. 5 D).
On the ∼6-year variability scale, precipitation and NAOI indicate a close to quadrature phase. Since 1990, this variability scale seems to be related to the Azores high but with a 6-year lag. It is interesting to note here that the ∼6-year scale expressed since the beginning of the 1990s could be related to warming of the North Atlantic Ocean, also affecting the Atlantic Multi-decadal Oscillation (AMO), as mentioned by Delworth and Mann (2000).
On the ∼18-year variability scale, precipitation and NAOI are out of phase. This variability scale seems to be mainly related to the Icelandic low. According to these results, the precipitation trend over the last six decades appears to be strongly related to Icelandic low variability.
4 Long-term evolution of precipitation and of the North Atlantic Oscillation/precipitation relationship: 1873 to 2004
In order to explore the long-term evolution of precipitation variability and compare it to that of NAO, we used one long-term precipitation station (Paris) for the 1873 to 2004 period. In view of previous results, which indicate the same evolution for all the precipitation stations studied at inter-annual scales, these results are expandable to the entire Seine River watershed.
The long-term NAOI analysis by the PELT segmentation method (Fig. 6A) shows three major change points during the 1910s, the late 1930s and from the early 1960s, separating periods with a significantly different mean and variance. The main result emphasized by the PELT segmentation is that the period starting in the early 1960s is characterized by high variability of the NAOI signal. Well-known abnormally positive NAO phases during the 1990s are recovered. On the other hand, the PELT segmentation of long-term precipitation (Fig. 6B) shows two major change points (around the late 1910s and in the late 1970s). Although precipitation after 1980 is generally higher than the mean precipitation over the entire 1873 to 2004 period (significantly during the 1980s), it is not clear whether a relation can be established between NAO phases and precipitation anomalies (taking the 1873–2004 mean as a reference). The 1930s change point was only detected in the long-term NAOI and has also been reported in the SLP-SST Atlantic data (Tourré et al., 1999).
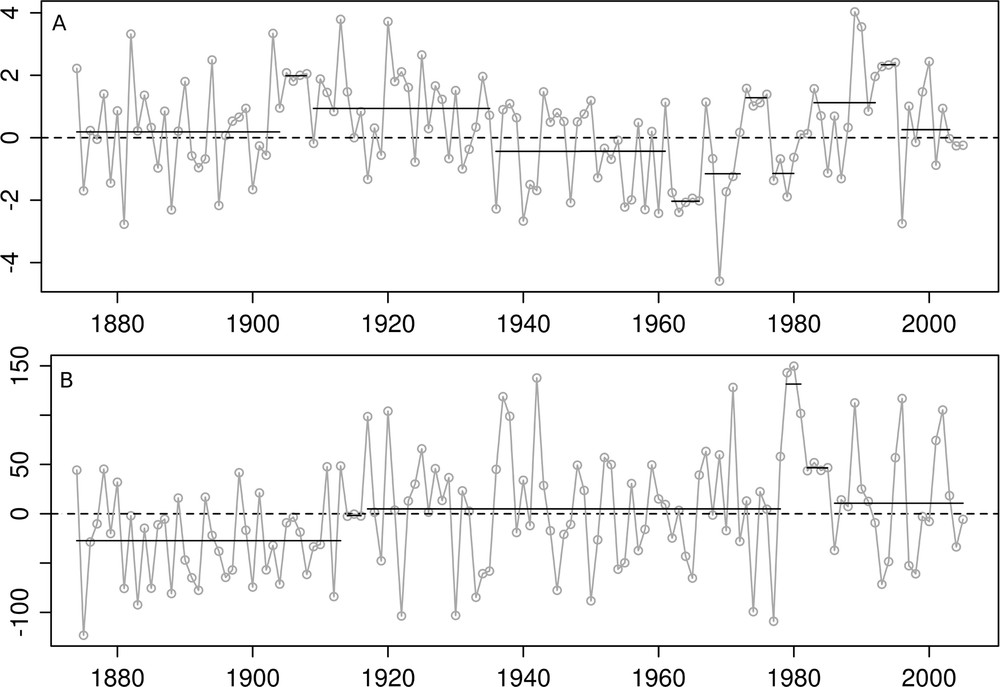
Winter-months North Atlantic Oscillation Index (A) and Paris precipitation data (B) (grey dotted line) and segmentation (black line) for 1873 to 2004 period.
Indice de l’Oscillation Nord Atlantique (A) et précipitations de Paris (B) en hiver (décembre à mars) (en lignes grises pointillées) et résultat de la segmentation (en ligne continue noire) pour la période 1873 à 2004.
The long-term NAOI analysis by CWT (Fig. 7A) shows enhanced amplitudes for most inter-annual scales since 1960 (∼4- to 5-year, ∼8-year, ∼20-year, ∼40-year and ∼ 84-year). The NAOI spectrum also emphasizes a clear lack of energy before 1910. These results seem consistent with those obtained by the PELT segmentation. Only the ∼8-year peak, spanning the 1970 to 2000 period, appeared statistically significant between ∼1975 and 1985, although the spectrum highlights the presence of energy peaks between the ∼4- to 5-year scale and slightly higher than the 8-year scale; however, the high intermittence of energy within this scale range results in the presence on the global wavelet spectrum of a peak at ∼8 years, which is barely distinguished from the rest of the spectrum in the ∼4- to 5-year scale range. The long-term precipitation analysis by CWT (Fig. 7 B) highlights two time periods, before and after 1910, characterized by different scales of variability. The period after 1910 is clearly associated with an increase in the energy at most scales. Peaks around ∼4- to 7-year and ∼11-year are the highest in energy and statistically significant and are very localized in time, although energy is also present between the ∼21-year, ∼35-year and ∼62-year scales. In sum, continuous wavelet analysis of NAOI and precipitation for both signals highlighted a general increase in amplitude of most of their characteristic time scales, but delineating any obvious common oscillations between the two signals is not straightforward.
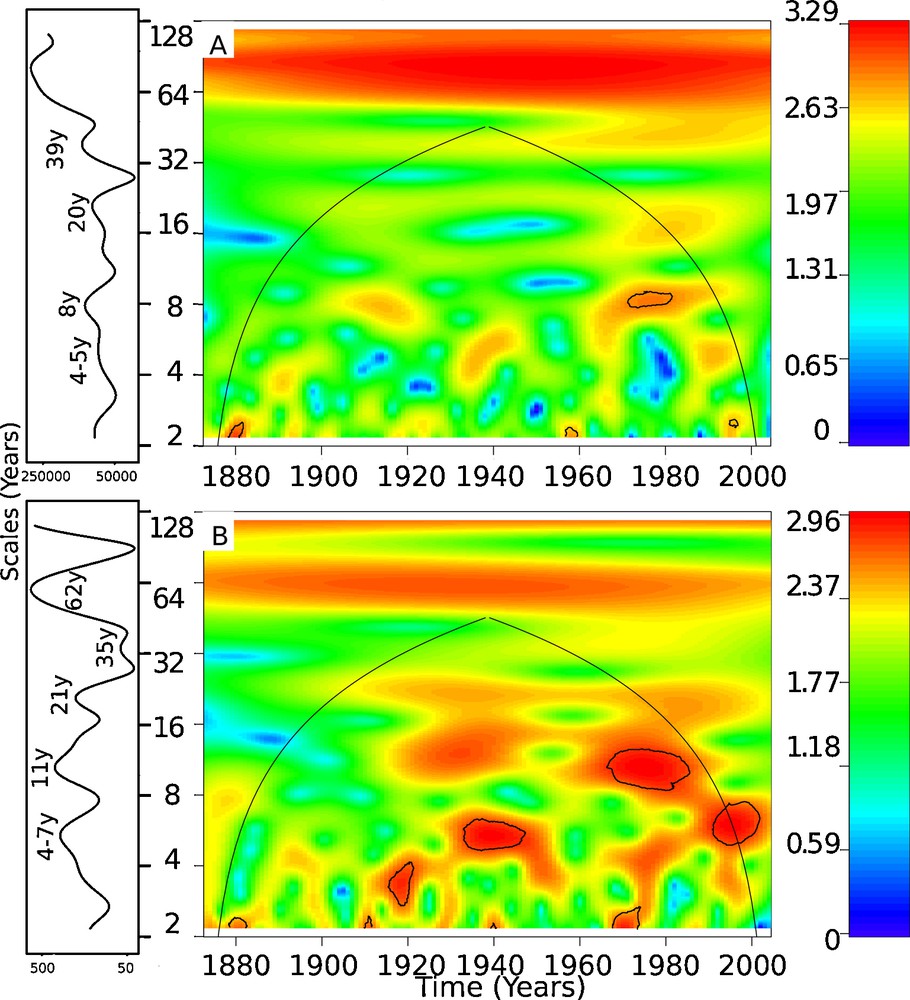
Winter-months Paris precipitation (A) and winter-months North Atlantic Oscillation Index (B) continuous wavelet transform (CWT) analysis diagrams and global spectrum for the 1873 to 2004 period. Solid black lines represent the 90% confidence limit by Monte-Carlo test.
Analyse en ondelettes continue (CWT) et spectres globaux des précipitations de Paris en hiver (A) et de la NAOI en hiver (B) pour la période 1873 à 2004. Les lignes noires continues représentent une limite de confiance à 90 % par test de Monte-Carlo.
Wavelet coherence analysis between long-term NAOI and precipitation series was then undertaken in order to investigate the time evolution of their relationship more accurately. The coherence spectrum between NAOI and Paris precipitation (Fig. 8) displays coherent structures with peaks around ∼4.5, ∼12, ∼21 and ∼55 years, as summarized by the global wavelet coherence spectrum. A clear lack of coherence shows up for scales higher than 8 years, emphasizing the intermittence of the NAOI/precipitation relationship at these scales. For the smallest scales less than 8 years, coherence appears much more sporadic, displaying coherent structures before ∼1895, between ∼1935 and ∼1955, and after 1990. Obviously, the same time evolution as for the 1950 to 2004 period (Fig. 4) is recovered, and the ∼18-year scale of variability that previously fell into the cone of influence in short-term series is now interpretable, corresponding to the ∼21-year peak in the coherence spectrum. Our results join those of Labat et al. (2005), who reported the same scales of variability in the long-term oscillation of river discharge at the pan-European scale over the last century. Hence, our results confirm the consistency of a large-scale climatic control on hydrology. According to our analysis, the NAOI/precipitation relationship seems to have undergone a weakening between ∼1910 and ∼1950, especially on the 21-year scale, while during this period a strengthening of the 4.5-year oscillation was observed.
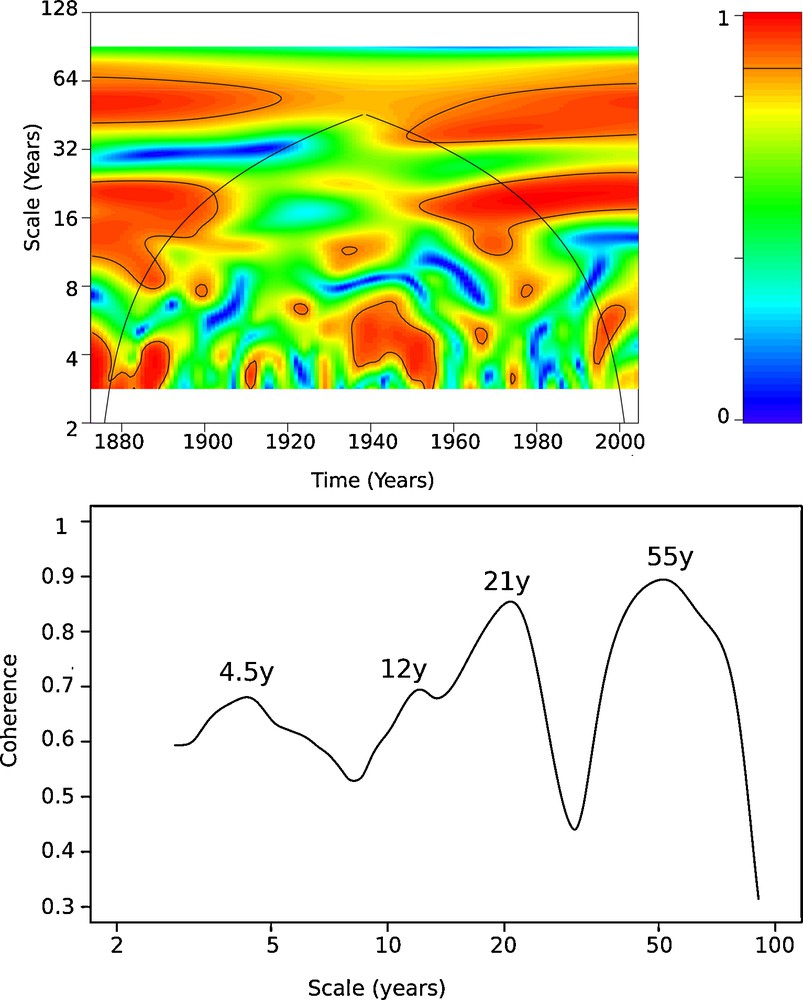
Winter-months North Atlantic Oscillation Index/winter-months precipitation wavelet coherence analysis diagrams and global spectrum for the Paris station for the 1873 to 2004 period. Solid black lines represent the 95% confidence limit.
Analyses des cohérences par ondelettes et spectre global entre l’indice de l’Oscillation Nord Atlantique et les précipitations de Paris en hiver pour la période 1873 à 2004. Les lignes noires continues représentent une limite de confiance à 95 %.
Precipitation components coherent with NAO can then be extracted and reconstructed from the long-term precipitation time series based on NAOI/precipitation wavelet coherence analysis (Fig. 9), which provides a time-domain visualization of the different modes of precipitation variations. Here, wavelet multi-resolution analysis was used to separate the signal into constitutive components according to the wavelet scales. Details from the multi-resolution analysis can be compared to the energy bands (from CWT) and coherent scales of variability (from WCO) detected previously. Six scale levels of decomposition were obtained using a maximum level chosen so as to consider wavelet interior coefficients only (i.e. those coefficients not subject to circular filter operations for boundary treatment). Among those six details, D1, D2 and D3 + D4 corresponded to ∼4.5-year, ∼12-year and ∼21-year scales, respectively, defined previously based on continuous wavelet analysis. On the other hand, D5 and D6 correspond to the ∼55-year scale of variability. From the wavelet reconstruction, it seems that the amplitudes of components D2–D5 increased across the period of study, more particularly since ∼1910 to 1920, which would be in accordance with the change in mean and variance detected using the PELT segmentation. Also, some periods seemed more particularly affected by an increasing variance (e.g. ∼1915–1955 and ∼1980–2004 for D2). The ∼55-year (D5 + D6) component also closely corresponds to the trend that was detected using LOESS smoothing in 1951 to 2004 (Paris station, Fig. 2 F and Fig. 10), hence showing that the trend for this period actually corresponds to this low-frequency oscillation characterizing both precipitation and NAOI. Finally, it is worth noting here that the extracted components are not necessarily associated with a significant coherence with NAO, which questions the capability of NAO to capture the climate oscillations that are actually related to precipitation fluctuations. In other words, although the NAO seems to remain a good reference for investigating links between climate oscillations and winter precipitation fluctuations in the region of interest, it is not the best climate predictor characterizing hydrological winter precipitation variations.
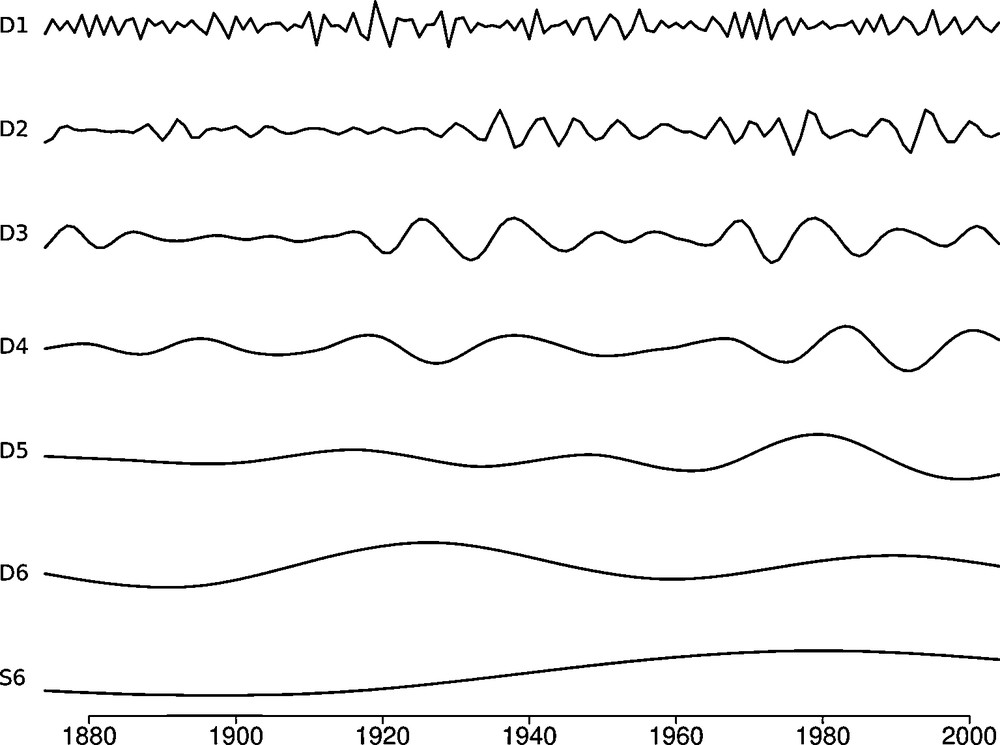
Winter-months Paris precipitation component reconstruction by multi-resolution analysis (order 18 Daubechies wavelet) for the 1873 to 2004 period. Dotted black lines represent winter-months Paris precipitation.
Reconstruction des composantes des précipitations de Paris en hiver (par analyse multirésolution (ondelette Daubechies d’ordre 18) pour la période 1873 à 2004. Les lignes noires pointillées représentent les précipitations de Paris en hiver.
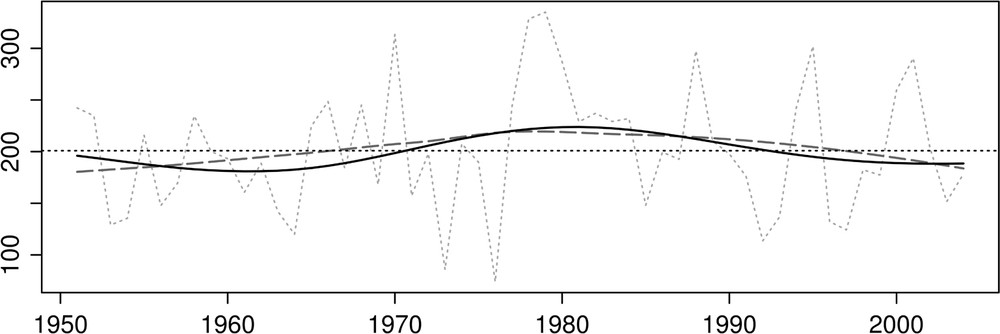
Winter-months Paris precipitation data (grey dotted line), LOESS smoothing (grey long-dashed line) and “D5” + “D6” component reconstruction (solid black line) by multi-resolution analysis (order 18 Daubechies wavelet) for the 1951 to 2004 period.
Précipitations de Paris cumulées sur les mois d’hiver (décembre à mars) (en ligne grise pointillée), son lissage par LOESS (en ligne à tirets longs gris) et somme de la reconstruction des composantes « D5 » et « D6 » (en ligne continue noire) par analyse multirésolution (ondelette Daubechies d’ordre 18) pour la période 1951 à 2004.
5 Conclusion
In this study, we investigated the inter-annual to multi-decadal variability of winter-months precipitation in the Seine River watershed (north-western France) and its potential relationships with the North Atlantic climate variability using the NAOI. We first demonstrated the presence of two change points around the mid-1970s and 1990 in the precipitation on the Seine River watershed. The first change point corresponded to a trend in the 1951 to 2004 period that separated below-average (negative anomalies) and above-average (positive anomalies) precipitation amounts compared to the 1951 to 2004 mean. For all the precipitation time series among the nine series selected in the watershed, wavelet coherence emphasized the correlation between precipitation and NAOI for variability scales of about ∼18-year as well as an inter-annual scale of ∼6-year over most of the 1951 to 2004 period, demonstrating a large-scale origin of regional and local climate variability. It is worth noting here that the same change points and/or scales of variability were also identified by many authors in other climatic or hydrological processes on a global scale (a quasi-decadal in the NAO since 1980 (Hurrell and Van Loon, 1997): global scale inter-decadal (12-year) and 6- to 7-year period fluctuations of SST and SLP in the North Atlantic and the Intertropical Convergence Zone (Grötzner et al., 1998; Tourré et al., 1999; Venegas et al., 1997) and in the Northern Oscillation Index (Schwing et al., 2002); a noticeable increase in annual minimum and median daily stream flow around 1970 (Mc Cabe and Wolock, 2002); a pronounced winter and spring warming over northern continents since about 1970 (Serreze et al., 2000), which have often been related to the observation of global environmental changes (a ∼40% reduction in plankton biomass during 1977 to 1988 relative to 1970 to 1976 in the central Gulf of Alaska (Alexander et al., 2008); a rather warm period from 1970 to 1985 was characterized by sardine dominance (Alheit and Niquen, 2004); and a rise in fish productivity after 1970 (Daskalov, 2003). According to our observations, the ∼18-year scale appeared to be related only to the variability of the Icelandic low, whereas the ∼6-year decadal fluctuation seemed mostly related to the Azores high.
A long-term analysis was made based on the availability of a 1873 to 2004 time series of both precipitation in Paris and NAOI winter (DJFM). Change points were identified during the 1910s for both signals, denoting changes in the mean and variance. The relationships between NAOI and precipitation over the long-term seemed to evolve with time, although present throughout almost the entire period, according to the scale of the internal fluctuations decomposed by multi-resolution analysis. However, the coherence decreased significantly between 1900 and 1930. The general trend in precipitation as detected by LOESS smoothing for the 1950 to 2004 period, which looked like an increasing trend, could actually be related to a longer-term ∼55-year fluctuation recorded in the longer precipitation and NAOI series, hence denoting an oscillating, pseudo-periodic feature. However, in both the NAOI and precipitation signals, a general increase in variability was determined for all characteristic time scales across the last century, which would deserve to be considered in the present context of climate change. Finally, the lack of coherence during some periods suggests that although the NAO is a good reference for characterizing the evolution of the North Atlantic climate, it is too rough to be the best predictor for local or regional hydrological variations.
Acknowledgements
The authors would like to thank the Seine-Aval Regional Scientific Program for financial support. The comments received from three anonymous reviewers on an earlier version of this article are also acknowledged.