

1 Introduction
A thunderstorm is defined as a meteorological phenomenon in which one or more sudden electrical discharges manifested by a flash of light (lightning) and a sharp rumbling sound (thunder) occurs from a cloud of vertical development (India Meteorological Department (IMD), 2012). Pre-monsoon (March–May) thunderstorms, locally known as Kal-baishaki or Nor’westers affect the eastern and northeastern (NE) parts of India, i.e. Assam, Orissa, Gangetic West Bengal, Jharkhand, Bihar and other parts of NE states. Being largely from north-west (NW) direction, such thunderstorms are known as Nor’westers (Tyagi et al., 2011). These severe thunderstorms associated with lightning and hail cause extensive losses in agricultural, damage to structure and also loss of life. The casualty due to lightning associated with thunderstorms in this region is the highest in the world (Science Plan, 2005). During pre-monsoon period, local convection and circulations have greater influence on local weather when synoptic influence is relatively weak (Murthy et al., 2011). All meteorological conditions gradually become favorable in a time span of a month from May for the onset of SW monsoon in June viz., increase in wind speed and strengthening of westerly flow with more moisture input. Incoming solar radiation is high in May with advancing summer month and humidity level increasing as the month progresses (Murthy et al., 2011). The hails associated with these severe thunderstorms cause huge damage to crops; in particular it affects mango production and summer paddy production. The strong wind produced by the thunderstorm down drafts after coming in contact with the earth surface spreads out laterally and is referred as downbursts, which is a real threat to aviation (Science Plan, 2005). The highest numbers of aviation hazards are reported during occurrence of these thunderstorms. The synoptic setting for the genesis of such type of hazardous weather event is contributed by the warm, moist, southerly low-level flow from the Bay of Bengal and a cool, dry, westerly or North West (NW) upper-level flow existing over the said region during pre-monsoon and superposition of these favorable upper and lower tropospheric conditions will result in generally widespread outbreaks of Nor’westers (Srinivasan et al., 1973). Further, the associated mesoscale structure may achieve a speed in the range 130–150 km/h, which may even reach tornadic violence causing considerable damage to property and loss of life (Ghosh et al., 2008). Nearly 72% of tornadoes in India are associated with Nor’westers (Goldar et al., 2001). Troubles faced by the scientists in predicting this severe weather phenomenon have been emphasized in Litta and Mohanty (2008) who identified small spatial and temporal extension and the inherent nonlinearity of their dynamics and physics as the prime causes behind the complexity in its prediction. Statistical forecasting of pre-monsoon thunderstorms over NW India has been discussed in Dhawan et al. (2008). Litta and Mohanty (2008) attempted to identify the occurrence of thunderstorm based on few thermodynamic indices available in the literature. Objective forecast of daily thunderstorm occurrence/non-occurrence over NE India has been studied by Mukhopadhyay et al. (2003). Considering the catastrophic consequences of the severe pre-monsoon thunderstorms, the Department of Science and Technology and Ministry of Earth Sciences, Government of India, launched a multi-institutional program named “Severe Thunderstorms – Observations and Regional Modelling (STORM)” over Gangetic West Bengal and northeastern parts of India. An extensive study of the thermodynamic indices in forecasting pre-monsoon thunderstorms over Kolkata (belonging to Gangetic West Bengal) during STORM pilot phase 2006–2008 has been carried out by Tyagi et al. (2011). Other significant works describing the outcomes of the STORM project include the extensive studies by Mohanty et al. (2006, 2007).
For the last few decades, Markov chain approach (Wilks, 2006) is being adopted to analyze discrete time series with entries pertaining dichotomous (yes/no) random variable (Varotsos et al., 2005; Villarini et al., 2009). This approach has been frequently applied by the researchers in the fields of climatology. Previously this approach has been adopted for the studies of rainfall (e.g. Little et al., 2009; Mimikdu, 1983; Wilks, 1998, 1999), wind speed (Kantz et al., 2004; Shamshad et al., 2005; Song et al., 2011), global solar irradiation (Biga and Rosa, 1981; Muselli et al., 2001; Varotsos et al., 2003, 2007; Varotsos and Kirk-Davidoff, 2006) etc. In the study of pre-monsoon thunderstorms over different regions of India, the application of Markov chain approach is not new. Earlier, Dasgupta and De (2001) implemented Markov chain for forecasting the pre-monsoon thunderstorm over Kolkata, a station of eastern India. Kulkarni et al. (2002) carried out a Markov chain analysis for pre-monsoon thunderstorms over Pune, a station belonging to the western India.
The present article deals with pre-monsoon thunderstorms over Bhubaneswar belonging to the state of Orissa. Several local storms, including tornadoes, damaging hail and wind gusts, frequently occur in eastern parts of India particularly West Bengal and Orissa during the period from March to May resulting in extensive damage to property and huge loss of life (Goldar et al., 2001; Gupta and Ghosh, 1982; Litta et al., 2011). The detailed characteristic of the pre-monsoon thunderstorm over Bhubaneswar is described in the following section. We apply Markov chain (MC) models on pre-monsoon thunderstorms over Bhubaneswar for analysis of thunderstorm occurrence in the present study. The present study is a systematic study of MC where we introduce a dichotomous random variable based on the occurrence or non-occurrence of thunderstorms over Bhubaneswar. At this juncture, the perspectives of the work may be stated clearly that whenever a time series pertaining to a chaotic geophysical event is the subject of research, the various aspects of its intrinsic intricacy are required to be explored. An investigation on the serial dependence of a time series helps us understand how the present state of the system depends up on the previous state(s) of the system. The pre-monsoon thunderstorm being a perennial weather phenomenon of study zone, and the loss associated with it being significantly high, it may be explored whether it is possible to generate any idea about its occurrence based on its previous occurrence. Keeping these in mind, the MC was adopted in the present study. Details of the implementation procedure would be presented in the subsequent sections. The present study deviates from the earlier relevant works in the following aspects:
- • this study carried out chi-square tests to investigate the serial dependence or independence on the time series before implementing MC;
- • in the present work, instead of combining the dichotomous time series, we have carried out the test for Markovian dependence against serial independence for different years. Also, we have studied the n-step transition probabilities for every year characterized by Markovian chain-dependence;
- • using transition probabilities, climatological probabilities occurrence of pre-monsoon thunderstorms have been calculated. These probabilities are validated by the observed relative frequencies of occurrence of pre-monsoon thunderstorms.
Section 2 of this article gives brief description about the study area, the proposed models and the data used for this study. Short discussion on Markov chain approach is presented in Section 3. Section 4 deals with the result and discussion part. In this section, a detailed description on the selection of study year and order of MC is presented. Also, in this section, descriptions of transition, steady-state and climatological probabilities are presented. The paper is concluded in the last section. Before passing on to the methodological details, it may be clearly stated that the primary endeavor of the paper is not to provide a predictive tool but to explore the inherent behavior of the time series.
2 Study area and data
Bhubaneswar, which is in the state of Orissa in the eastern part of India, is prone to severe thunderstorms and the causality due to thunderstorms is also high. National Crime Record Bureau, India reported that there were 900 deaths because of thunderstorms in the state of Orissa during 2001–2004. In which 300 deaths alone were due to lightning strikes in 2004. This high number of causality could be attributed to the moderately high number (60–80 days) of thunderstorm days in a year in Orissa (Tyagi, 2007). In particular, thunderstorm climatology of Bhubaneswar indicates that annually there are 77.4 thunderstorm days (Tyagi, 2007). Although the thunderstorm days (49.8) are more during the summer months, the severity of this weather phenomenon is more in the pre-monsoon months, in which the squalls occur with wind speeds in excess of 100 km/hr causing wide spread devastation. The synoptic features which give rise to such intense weather have been well documented (Science Plan, 2005). The nor’wester type of thunderstorm which form a majority of the weather events during the pre-monsoon months generally originate over Bihar plateau, southeast Madhya Pradesh or west Orissa, travel east or southeastwards towards Gangetic West Bengal or head Bay of Bengal with a speed of 50 to 60 km/hr. The presence of a stable layer of transition between the moist southerlies/southwesterlies from Bay of Bengal in the lower levels and dry westerlies of continental origin in the upper levels inhibits the growth of convective clouds. But this stable layer, which at times has an inversion in temperature, increases the moisture in the lower levels helping the buildup of convective available potential energy (CAPE) enormously which is a conducive environment for nor’wester outbreak (Science Plan, 2005).
These data were obtained from the IMD, Pune. After transformation of the original data into a time series of daily observations in which the thunderstorm and non-thunderstorm days have been labeled as (1, 0), taking into consideration the convention of World Meteorological Organization that a thunderstorm day is defined as a day on which thunder is heard. In this study, the month of March has not been considered for the low (3.5) number of thunderstorm days which would be insignificant for the fact that the number of samples should be more for any mathematical/statistical analysis. Therefore, in the present study, daily thunderstorm data at Bhubaneswar (20.15N, 85.5 E) (location given in Fig. 1), 1 April to 31 May for a period of 11 years (i.e. 1998–2008) have been used. Fig. 2 shows the number of thunderstorm days in each of the 11 years during the months of April (climatological number of thunderstorm is 5.7) and May (climatological number of thunderstorm is 8.5) in which there are a total of 5 years where the number of thunderstorm days were above the climatology of April–May thunderstorm days (14.4) (Tyagi, 2007).
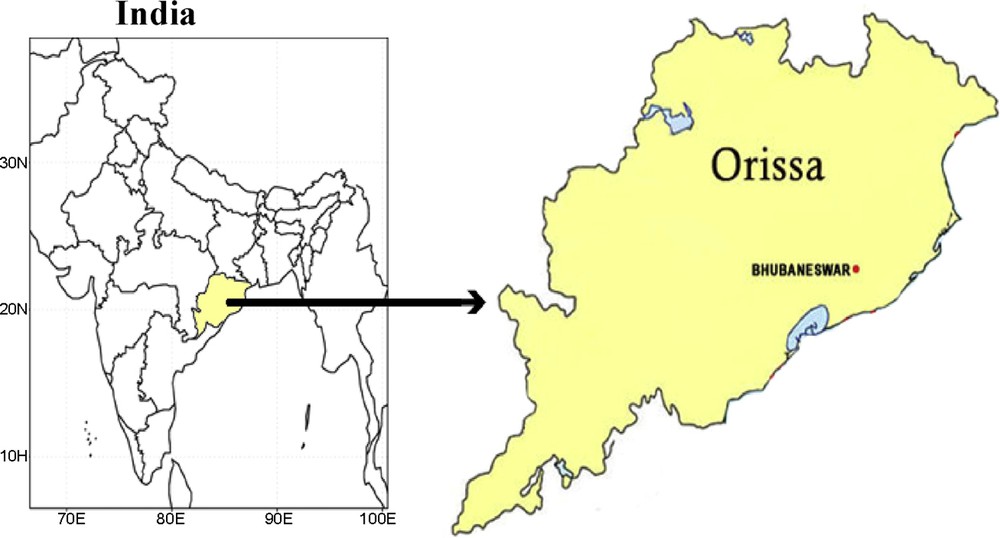
The study area Bhubaneswar is represented by the red dot within the state Orissa of India.
La région de Bhubaneswar étudiée, représentée par le point rouge dans l’état d’Orissa, Inde.
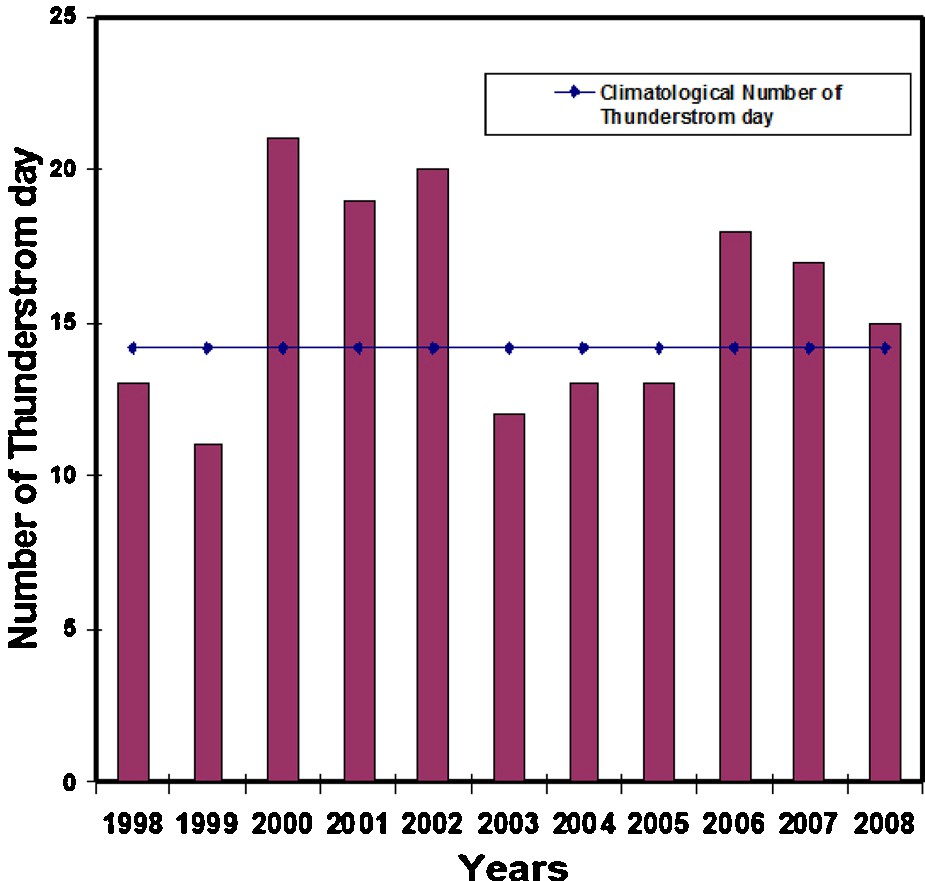
The vertical columns indicate the number of pre-monsoon thunderstorm day (April–May) of Bhubaneswar where the horizontal line indicates the climatological number of thunderstorm day of the same region.
Les colonnes verticales indiquent le nombre de jours d’orages pré-mousson (avril–mai) à Bhubaneswar, où la ligne horizontale représente le nombre climatologique de jours d’orage de la même région.
3 Markov chain approach
In the present work, the dichotomous random variable Xt based on the occurrence/non-occurrence of severe pre-monsoon thunderstorm has been defined as follows:
| (1) |
An elaborate theoretical discussion on Markov chain is available in Wilks (2006). The most common class of model, or stochastic process, used to represent time series of discrete variables is known as the Markov chain. A Markov chain can be imagined as being based on collection of states of a model system. Each state corresponds to one of the elements of the mutually exclusive and collectively exhaustive (MECE) partition of the sample space describing a random. For each time period, the length of which is equal to the time separation between observations in the time series, the Markov chain can either remain in the same state or change to one of the other states. Remaining in the same state corresponds to two successive observations of the same value of the discrete random variable in the time series, and a change of state implies two successive values of the time series that are different (Wilks, 2006).
The behavior of a Markov chain is governed by the set of transition probabilities that correspond to the probability of transition of the system from a given state to any one of the other states pertaining to the random variable under consideration. The most common form of Markov chain is the first-order Markov chain, where the transition probabilities controlling the next state of the system depend only on the current state of the system. This characteristic of first-order Markov chains is known as the Markovian property, which can be expressed more formally as (Wilks, 2006):
| (2) |
Three orders of Markov chain (MC) are examined in this work. By order of a MC, we mean the number of time steps on which the current state of the time series is depending. The first-order Markov chain, for which the transition probabilities controlling the next state of the system depend only on the current state of the system (Wilks, 2006). Similarly, second and third orders of MC mean that the transition probabilities controlling some given state of the system depend only on the immediately two and three previous states respectively. It is already stated in the previous section that the random variable Xt under consideration realizes only two values “0” and “1”. Thus, for any order of the MC, there would be two states of the MC. The first, second and third orders of the MC are abbreviated as FOTSMC, SOTSMC and TOTSMC respectively. The transition probabilities that characterize the MC are basically conditional probabilities, where the conditioning events are the states controlling the current state of the system. For FOTSMC, SOTSMC and TOTSMC the transition probabilities are:
| (3) |
The criterion that is in common use for choosing among alternative orders of Markov chain models is the Akaike Information Criterion (AIC) (Akaike, 1974) that is based on the log-likelihood functions for the transition probabilities of the fitted Markov chains. These log-likelihoods depend on the transition counts and the estimated transition probabilities. The log-likelihoods for s-state Markov chains of order 0, 1, 2, and 3 are (Wilks, 2006):
| (4) |
The AIC attempts to find the most appropriate model order by striking a balance between goodness of fit, as reflected in log-likelihoods, and a penalty that increases with the number of fitted parameters. For each trial order m, the AIC statistic is computed using:
| (5) |
The order m is chosen as appropriate that minimizes Eq. (5). The entire methodology adopted in this work is summarized as a flow chart in Fig. 3.
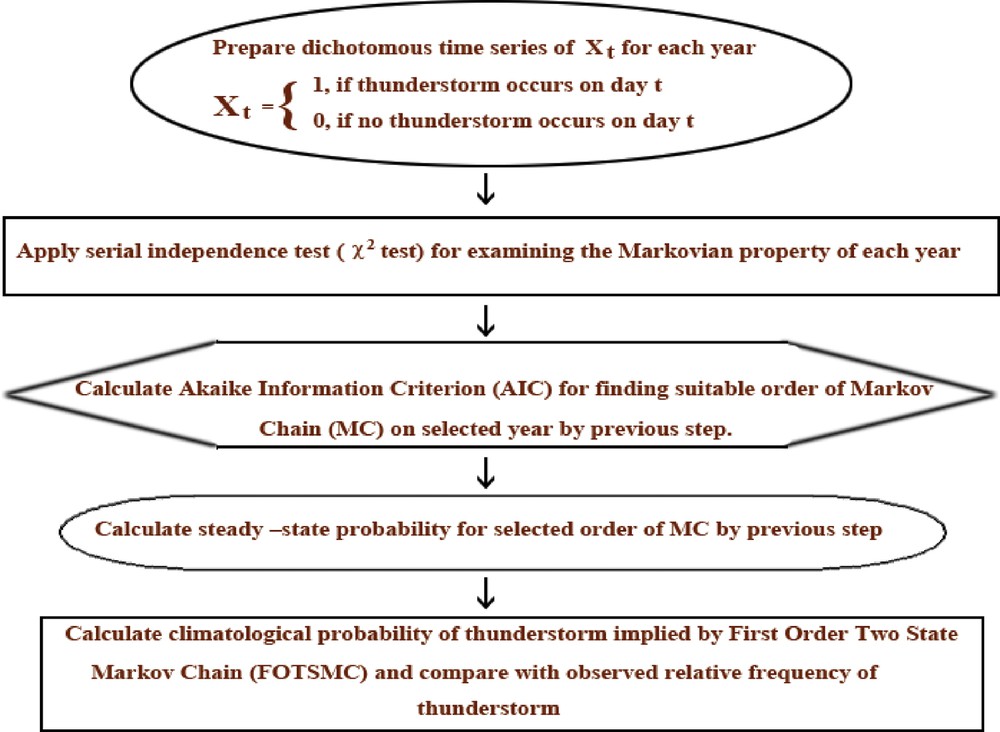
Schematic representation of implementation procedure of MC model of the present study.
Représentation schématique de la procédure d’implémentation du modèle MC dans la présente étude.
4 Results and discussions
4.1 Selection of study year
In this work, we are considering the severe thunderstorm occurrence/non-occurrences for the pre-monsoon seasons of the years 1998 to 2008. For each pre-monsoon, there are 92 days. However, March being excluded, the study is based on 61 days. Thus, for every year, there is a time series with 61 entries of “0” and “1”. Before applying MC model on a dichotomous dataset, one has to examine whether this data is following the Markovian property by the serial independence test (Wilks, 2006). But earlier study on MC analysis for pre-monsoon thunderstorm (Dasgupta and De, 2001; Kulkarni et al., 2002) did not discuss this issue. In this present study, for each time series, the following hypotheses are framed:
- • null hypothesis H0: the time series
- • alternative hypothesis H1: the time series
At this juncture, it should be mentioned that the atmospheric variables often exhibit statistical dependence with their own past or future values. In the terminology of the atmospheric sciences, this dependence through time is usually known as persistence. Persistence can be defined as the existence of (positive) statistical dependence among successive values of the same variable, or among successive occurrences of a given event. In the present work, for each year, the value of the chi-square χ2 statistic is computed based on the null hypothesis H0. The method of computing the χ2 for testing serial independence against Markovian property is extensively discussed in Wilks (2006). Since in each case, the total number of transitions is greater than 50, therefore χ2 test is valid for the present study. For FOTSMC, the number of cells in the contingency table would be four and the degrees of freedom would be (2–1) × (2–1) = 1. The computed χ2 are plotted as bar diagram in Fig. 4, where the horizontal line corresponds to the tabular value of χ2 with degree of freedom 1 at 95% level. For this level, the tabular value is 3.841. The null hypothesis is rejected whenever the computed χ2 exceeds the tabular χ2. From Fig. 4, we observe that excepting in 2000, 2001, 2004 and 2006, the pre-monsoon thunderstorm occurrence/non-occurrence time series are characterized by serial independence. This is concluded because only in the aforementioned years, the computed values of χ2 exceed the tabular value with appropriate degree of freedom.
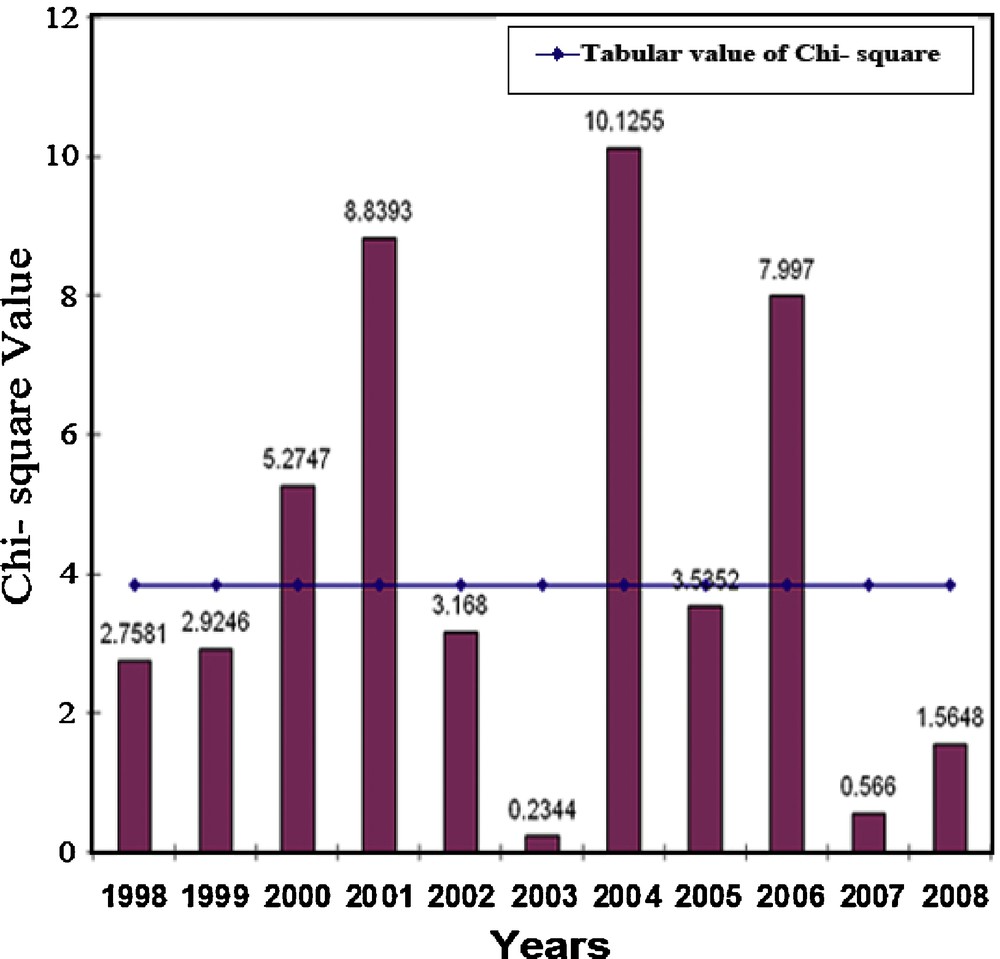
The vertical columns indicate the computed values of chi-square based on the null hypothesis of serial independence of the binary time series. The horizontal line indicates the tabular chi-square. In this case, the tabular value is 3.841.
Les colonnes verticales indiquent les valeurs calculées de chi au carré, basées sur l’hypothèse nulle d’indépendance sériée des séries temporelles binaires. La ligne horizontale représente le chi au carré tabulaire. Dans ce cas, la valeur tabulaire est 3,841.
4.2 Selection of order of MC
Thus, in the rest of the paper, we shall examine the pre-monsoon thunderstorm occurrence/non-occurrence time series for suitable orders of Markov chain. Suitable order of Markov chain is decided by means of Akaike Information Criteria (AIC) (1974) discussed in Wilks (2006). According to this criterion, for a given state a Markov chain of order m is the most appropriate model if it minimizes AIC. At this juncture, it may be stated that in the present problem, while computing the transition probabilities for the TOTSMC, we found significant number of transition counts to be equal to 0 and consequently the transition probabilities were 0. In such cases, the logarithms do not exist. Hence, no AIC is available for the TOTSMCs pertaining to the years 2000, 2001, 2004 and 2006 for which we are investigating the chain-dependency. In all of the years, it is found that FOTSMC is producing minimum AIC. This leads us to proceed further with FOTSMC and to discard SOTSMC and TOTSMC models. The AICs are presented in Table 1. Following Kulkarni et al. (2002), the n-step probabilities are now obtained by FOTSMC for the years 2000, 2001, 2004 and 2006 and are presented in Tables 2–5. These n-step probabilities are the elements of a matrix of the type Pn, where P is the one-step transition matrix. The general form of the transition matrix P is:
| (6) |
Les AICs et les ordres de la chaîne de Markov pour différentes années.
| Year | Order of Markov chain | Value of AIC |
| 2000 | 1 | 76.5124 |
| 2 | 77.7167 | |
| 3 | Various transition counts being 0, AIC is not available | |
| 2001 | 1 | 70.3363 |
| 2 | 73.4122 | |
| 3 | Various transition counts being 0, AIC is not available | |
| 2004 | 1 | 57.8447 |
| 2 | 59.5233 | |
| 3 | Various transition counts being 0, AIC is not available | |
| 2006 | 1 | 69.6313 |
| 2 | 72.4613 | |
| 3 | Various transition counts being 0, AIC is not available |
Probabilités de transition à n étapes de MCM du 1er ordre pour l’année 2000.
| n | P n | |
| 1 | 0.750 | 0.250 |
| 0.450 | 0.550 | |
| 2 | 0.675 | 0.325 |
| 0.585 | 0.415 | |
| 3 | 0.652 | 0.347 |
| 0.625 | 0.374 | |
| 4 | 0.645 | 0.354 |
| 0.637 | 0.362 | |
| 5 | 0.643 | 0.356 |
| 0.641 | 0.358 | |
| 6 | 0.643 | 0.356 |
| 0.642 | 0.357 | |
| 7 | 0.642 | 0.357 |
| 0.642 | 0.357 | |
| 8 | 0.642 | 0.357 |
| 0.642 | 0.357 | |
| 9 | 0.642 | 0.357 |
| 0.642 | 0.357 |
Probabilités de transition à n étapes de MCM du 1er ordre pour l’année 2001.
| n | P n | |
| 1 | 0.804 | 0.195 |
| 0.421 | 0.578 | |
| 2 | 0.73 | 0.27 |
| 0.582 | 0.417 | |
| 3 | 0.701 | 0.298 |
| 0.644 | 0.355 | |
| 4 | 0.690 | 0.309 |
| 0.668 | 0.331 | |
| 5 | 0.686 | 0.314 |
| 0.677 | 0.322 | |
| 6 | 0.684 | 0.315 |
| 0.681 | 0.318 | |
| 7 | 0.683 | 0.316 |
| 0.682 | 0.317 | |
| 8 | 0.683 | 0.316 |
| 0.683 | 0.317 | |
| 9 | 0.683 | 0.316 |
| 0.683 | 0.316 | |
| 10 | 0.683 | 0.316 |
| 0.683 | 0.316 | |
| 11 | 0.683 | 0.316 |
| 0.683 | 0.316 |
Probabilités de transition à n étapes de MCM du 1er ordre pour l’année 2004.
| n | P n | |
| 1 | 0.872 | 0.127 |
| 0.461 | 0.538 | |
| 2 | 0.819 | 0.180 |
| 0.651 | 0.348 | |
| 3 | 0.798 | 0.201 |
| 0.729 | 0.271 | |
| 4 | 0.789 | 0.210 |
| 0.761 | 0.239 | |
| 5 | 0.785 | 0.214 |
| 0.774 | 0.225 | |
| 6 | 0.784 | 0.215 |
| 0.779 | 0.220 | |
| 7 | 0.783 | 0.216 |
| 0.781 | 0.218 | |
| 8 | 0.783 | 0.216 |
| 0.782 | 0.217 | |
| 9 | 0.783 | 0.216 |
| 0.783 | 0.216 | |
| 10 | 0.783 | 0.216 |
| 0.783 | 0.216 | |
| 11 | 0.783 | 0.216 |
| 0.783 | 0.216 | |
| 12 | 0.783 | 0.216 |
| 0.783 | 0.216 |
Probabilités de transition à n étapes de MCM du 1er ordre pour l’année 2006.
| n | P n | |
| 1 | 0.809 | 0.190 |
| 0.444 | 0.555 | |
| 2 | 0.74 | 0.26 |
| 0.606 | 0.393 | |
| 3 | 0.714 | 0.285 |
| 0.665 | 0.334 | |
| 4 | 0.705 | 0.294 |
| 0.687 | 0.312 | |
| 5 | 0.701 | 0.298 |
| 0.695 | 0.304 | |
| 6 | 0.700 | 0.299 |
| 0.698 | 0.301 | |
| 7 | 0.700 | 0.299 |
| 0.699 | 0.300 | |
| 8 | 0.700 | 0.299 |
| 0.699 | 0.300 | |
| 9 | 0.700 | 0.300 |
| 0.699 | 0.300 | |
| 10 | 0.700 | 0.300 |
| 0.700 | 0.300 |
4.3 Discussion on transition probabilities
Table 2 shows the FOTSMC for the year 2000. It is seen that the probability (0.25) of thunderstorm day (TD) followed by non-thunderstorm (NTD) day is less than the probability (0.55) of thunderstorm day followed by thunderstorm day, whereas the probability (0.75) of NTD followed by NTD is significantly higher than the probability (0.45) of NTD followed by TD (0.45). Like the year of 2000, FOTSMC for 2001, 2004 and 2006 are shown in Tables 3–5 respectively. Hence, like the year 2000, for all of the remaining three years probability of TD followed by TD is much higher than probability of TD following NTD. Similarly, the probability of NTD followed by NTD is greater than that followed by TD. Therefore, it is observed that the probability of occurrence or non-occurrence of thunderstorm is getting higher if the state of the previous day stayed in a similar state. It is further observed that probability of getting NTD followed by NTD is much higher than the probability of getting TD followed by TD. It is also found that for all of the years, the probability of getting NTD followed by TD is higher than probability of getting TD followed by NTD.
4.4 Steady-state probabilities
Markov chain has a unique property that the difference between the elements of the transition probabilities after a number of transitions tends to be zero. In other words, all the transition probabilities tend towards a common limit as the number of transition increases (Sheskin, 1985). This probability often called as steady-state probability. Steady-state probabilities are used to describe the long-run behavior of a Markov chain. For getting the steady-state probability of being in state 0 (NTD) and in state 1 (TD), For the year 2000, (Table 2) FOTSMC model has been carried out up to step 9 and it has been found that the values of probabilities become nearly constant (0.642, 0.357) after step 7 onwards. Table 3 shows that after step 9, the probabilities become almost constant (0.683, 0.316) for the year 2001. For the year 2004 and 2006 after 9 and 8 steps, probabilities become constant (Tables 4 and 5). This constant value of transition probabilities implies that the probability of occurrence of a state of thunderstorm (1) or no thunderstorm (0) are independent from its initial state (either 0 or 1).
4.5 Comparison of the transition probabilities by FOTSMC with climatological probabilities
Certain properties are implied for a time series described by a Markov chain. These properties are controlled by the values of the transition probabilities, and can be computed from them. First, the long-run relative frequency of the events corresponding to the two states of the Markov chain is called the stationary probabilities (Wilks, 2006). In this step, the (unconditional) climatological probabilities of occurrence of severe pre-monsoon thunderstorms are computed using (Wilks, 2006):
| (7) |
Based on transition probability matrix given in Eq. (6), the climatological probabilities are calculated and presented in Table 6 for the year 2000, 2001, 2004 and 2006. The observed relative frequencies of pre-monsoon thunderstorms over the study zone for the same years are also presented in the Table 6. It is found that there is a close association between the observed relative frequencies of occurrence of pre-monsoon thunderstorms and the climatological probabilities implied by FOTSMC.
Probabilités climatologiques d’occurrence d’orages pré-mousson sévères, impliqués par FOTSMC.
| Year | Climatological probability π1 of thunderstorm implied by FOTSMC | Observed relative frequency of thunderstorm |
| 2000 | 0.357 | 0.344 |
| 2001 | 0.316 | 0.311 |
| 2004 | 0.216 | 0.213 |
| 2006 | 0.300 | 0.295 |
5 Concluding remarks
The study presented above leads us to some notable conclusions regarding the occurrence of severe pre-monsoon thunderstorms over Bhubaneswar, India that is one of the zones of eastern India that suffer a lot because of this hazardous weather phenomenon. The conclusions are enumerated as follows:
- • most of the pre-monsoon seasons over the study zone are characterized by serially independent discrete time series in the context of the occurrence/non-occurrence of severe thunderstorms. This has been confirmed by a chi-square test based on the null hypothesis of serial independence within a dichotomous binary time series. Seven, out of eleven years under consideration have exhibited serial independence with respect to the occurrence/non-occurrence of severe pre-monsoon thunderstorms;
- • of the three orders of Markov chain tested for the two-state time series pertaining to the binary random variable defined by means of the occurrence or non-occurrence of the severe weather phenomenon under study, only two orders have produced non-zero counts for all transitions within the contingency table that led to finite values of AIC computed using Eq. (4) and (5);
- • based on the minimization of AIC, the first-order two-state have been found to characterize the binary time series defined in this study for the years of 2000, 2001, 2004 and 2006 that have already shown serial-dependence based on the chi-square test;
- • the rigorous study presented in this work leads us to observe that for all the above stated years, probability of occurrence or non-occurrence of thunderstorm is getting higher if the state of the previous day is similar to that of the current day. Furthermore, the probability of getting NTD followed by NTD is higher than the probability of getting TD followed by TD;
- • it is also found that for all years, probability of getting NTD followed by TD is higher than the probability of getting TD followed by NTD for all the selected years;
- • based on the n-step transition matrices for the years of 2000, 2001, 2004 and 2006, the steady state transition probabilities have been obtained and it has been confirmed that the occurrence of a severe thunderstorm on a given day is statistically independent of whether there was a severe thunderstorm on the immediately previous day;
- • it has been observed that the unconditional climatological probability of the occurrence of severe pre-monsoon thunderstorm implied by the first-order two-state Markov chain is closely in agreement with the observed relative frequencies of the occurrence of the said weather event.
Vous devez vous connecter pour continuer.
S'authentifier