

1 Introduction
Increasing global population, estimated to reach 9 billion by 2050, is placing ever-increasing pressure on natural resources, soils being no exception (Banwart, 2011), with the need to feed, clothe and shelter so many. Traditionally, soils have been largely managed with a single use in mind, primarily for food, feed or fibre production. However, soils provide other important functions (Blum, 2006) including supporting and sustaining our terrestrial ecosystems, regulating the atmosphere through carbon storage, filtering water, recycling waste, preserving heritage, acting as an aesthetic and cultural resource, whilst maintaining a vital gene pool and biological resource from which many of our antibiotics have been derived (D’Costa et al., 2006). The increasing intensity of land use means greater demands on the services that soils deliver, compounded by soil degradation worldwide. Increasing pressures mean that solutions to land management that can be sustained beyond the next generation will require far more optimal use of soils to deliver multiple functions simultaneously, while avoiding and reversing land degradation.
The European Union has recognized the vulnerability of the soil resource that needs to be protected (Blum et al., 2004) through the ‘Soil Thematic Strategy’ regarding soil protection (COM(2006) 231). The communication (COM(2006) 231) sets the framework explaining why further action is needed at EU level, and provides the overall objective of the Strategy. It is considered that within this common framework (COM(2006) 232), the EU Member States will be able to decide how best to protect their soil in a sustainable way. The Soil Thematic Strategy identifies eight major threats to soils based on the impact assessment. The threats are estimated, on an annual basis, to cost the EU billions of Euros: erosion (€0.7–14.0 billion), organic matter decline (€3.4–5.6 billion), compaction (no estimate possible), salinization (€158–321 million), landslides (up to €1.2 billion per event), contamination (€2.4–17.3 billion), sealing (no estimate possible), and biodiversity decline (no estimate possible).
Common to all of these soil threats is that their cause, impact, remediation and management go beyond the confines of the classically defined 1–2 meter soil profile used for inventories. The Thematic Strategy includes within the definition of soil the full depth of unconsolidated material below the ground surface to the bedrock. This draws strong parallels with the concept of Earth's Critical Zone (NRC, 2001), defined as the terrestrial environment extending from the top of the vegetation canopy to the bottom of drinking water aquifers (Fig. 1). Critical Zone science addresses the environmental processes that are linked “from tree-top to bedrock”. It provides an integrating framework to both understand, and better manage, the Critical Zone, including its vital soil layer.
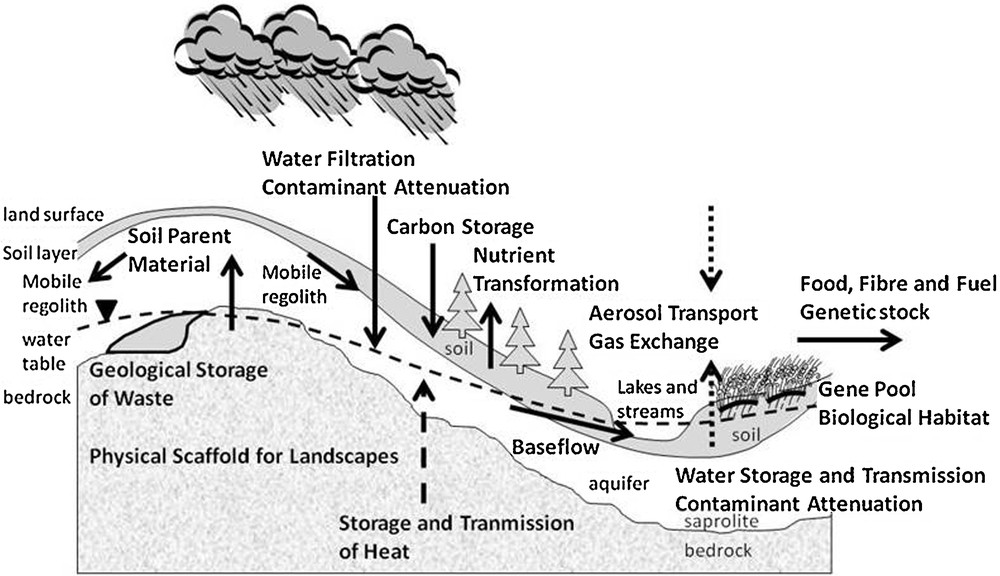
A Critical Zone hillslope profile. This diagram represents the material and energy flows that arise from environmental processes of the Critical Zone and that supply goods and services for human benefit. The large arrows represent material and energy flows and the resulting goods and services are listed in large, bold type. Light type lists the main environmental components of the Critical Zone (adapted from Banwart et al., 2012).
Zone critique de profil de haut de pente. Le diagramme représente les flux de matériaux et d’énergie qui résultent des processus environnementaux de la zone critique et qui produisent des biens et services au bénéfice de l’homme. Les grandes flèches correspondent aux flux de matériaux et d’énergie et les effets et services qu’ils génèrent sont listés en caractères gras. Les caractères maigres représentent les principaux composants environnementaux de la zone critique (adapté de Banwart et al., 2012).
A central issue addressed by the Soil Thematic Strategy revolves around the need for closer links between science, management and policy for decision making. The proposed DPSIR framework (Fig. 2, Blum et al., 2004) outlines the impact chain that occurs due to environmental change. It considers how socio-economic driving forces (D), develop pressures (P) on the environment, resulting in a change in the state (S) of the environment, which creates impacts (I) that give rise to unintended or managed responses (R) from the population who are affected. Analysis of this impact chain requires substantial scientific evidence from studies of Earth surface and ecosystem processes, and helps identify where in the chain to adapt human activity to mitigate or manage the effects of environmental change.
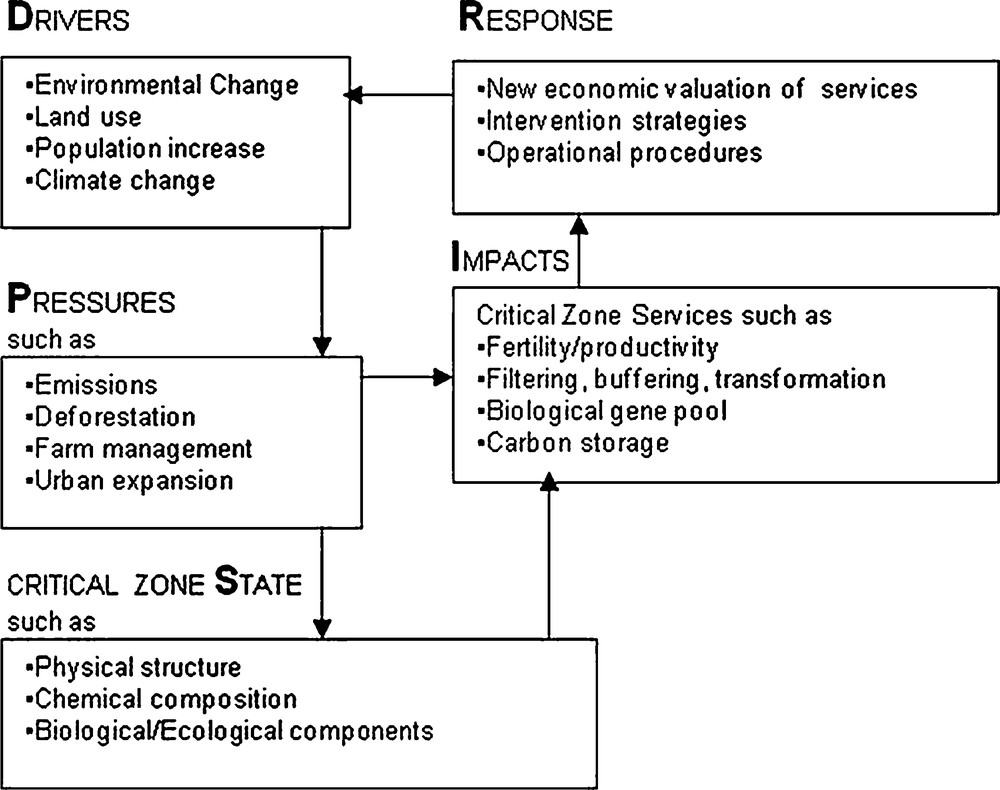
Drivers-Pressures-State-Impact-Response (DPSIR) impact chain for policy intervention to sustain Critical Zone goods and services using examples arising from soil. Scenario analysis of CZ State and impacts arising from environmental change can be used to assess trade-offs between various policy and management options for intervention within the DPSIR impact chain.
Chaîne d’impact Causes–Pressions–État–Impact- Réponse (DPSIR) afin que les interventions de type politique soutiennent les biens et services utilisant des exemples tirés de sols. L’analyse du scénario relatif à l’État de la zone critique (CZ) et aux impacts dus aux changements environnementaux peut être utilisée pour l’évaluation de la balance des charges entre les options variées de politique et de gestion, en vue d’une intervention dans la chaîne d’impact DPSIR.
The actions of the Thematic Strategy for Soil Protection include conducting scientific research that develops the evidence base for effective policy to protect and enhance soil functions. One strand of current research includes the development of Critical Zone Observatories, i.e. research field sites for the multidisciplinary study of soil processes and their impact chain linkages within Earth's Critical Zone (the SoilTrEC project, Banwart et al., 2011). The overarching hypothesis for this research is that the development of soil functions, which include a range of economic services, occurs within a conceptual life cycle of soil functions (Fig. 3).
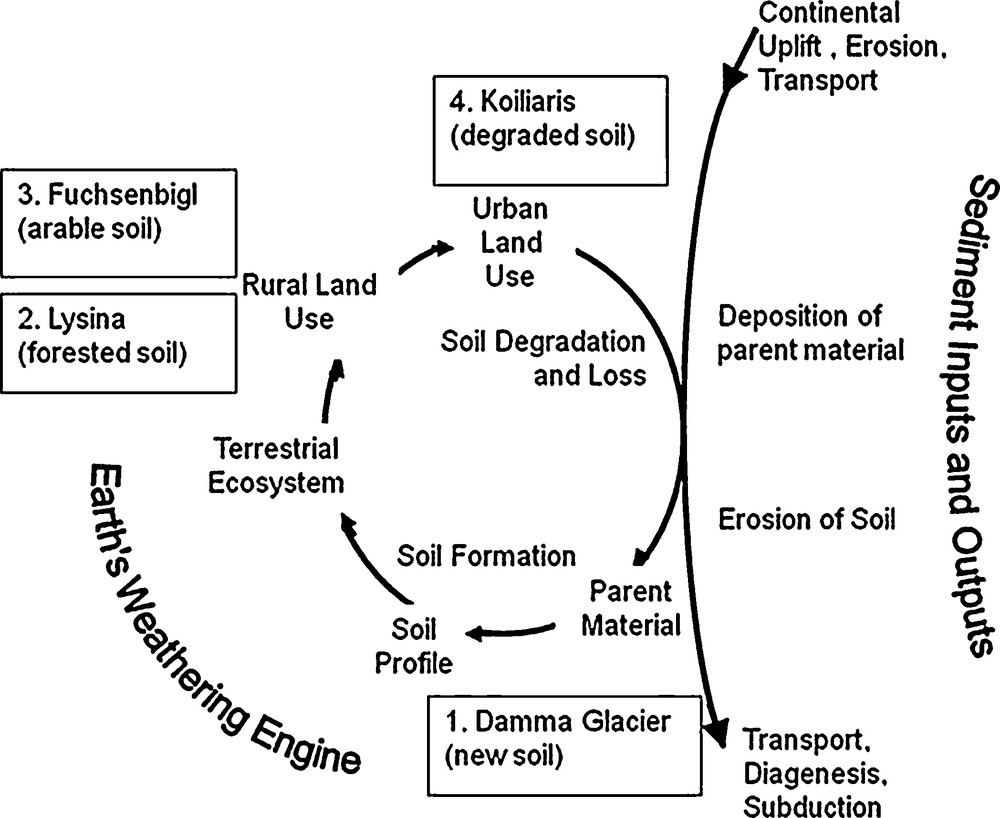
The life cycle of soil functions and four main CZOs selected to represent key stages around the cycle. The Damma Glacier site provides a chronosequence of newly forming young soil as it develops from bedrock and glacial outwash deposits that are exposed during the retreat of the glacier; this has occurred over the past two centuries. The Fuchsenbigl-Marchfeld and Lysina CZOs represent currently productive arable farmland and plantation forest, respectively. The Koiliaris River Basin CZO represents mature, intensive agricultural land management over periods of centuries to millennia and is under threat from modern climate change predicted for the Mediterranean Basin.
Déroulement du cycle de vie du sol et quatre CZOs principales, sélectionnées pour représenter les étapes clé au long du cycle. Le site de Damma Glacier fournit une chronoséquence de sol jeune nouvellement formé, tel qu’il se développe à partir de la roche mère et de dépôts glaciaires exposés lors du retrait du glacier ; ceci s’est produit lors des deux derniers siècles passés. Les CZOs de Fuchsenbigl-Marchfeld et Lysina représentent généralement des terres productives pour la culture et la plantation forestière, respectivement. La CZO du bassin de la rivière Koiliaris représente une terre mature, cultivée de manière intensive sur des périodes s’étalant de plusieurs siècles à plusieurs millénaires; elle est sous la menace du changement climatique moderne, prédit sur le Bassin méditerranéen.
This cycle starts with the exposure of rock or deposition of sediment as parent material at the land surface where weathering and pedogenesis occur. Soil development progresses but is modified by human activity (Richter et al., 2011) or environmental change that drives Earth surface conditions to a point where changes of soil functionality occur. This change is often detrimental to human sustainable development; potentially including complete loss of the bulk material through physical erosion. The experimental design to test this hypothesis is to quantify soil processes and functions throughout the soil life cycle; from the earliest stages of soil formation to soils that have been heavily impacted by millennia of intensive human activity.
A more detailed extension of this hypothesis is that the development of soil structure is a key determinant of soil processes and soil functions, at the different stages of the soil life cycle (Banwart et al., 2011). Soil structure is characterised by the particle size mass distribution of soil aggregates. As rock breaks down physically and dissolves during soil formation, fragments of primary rock particles and secondary mineral precipitates bind together with decaying biomass and living microbes to form soil aggregates. Empirical evidence suggests that agronomically productive soils coincide with conditions where greater than 60% of the dry soil mass occurs as aggregates with a relatively greater size, i.e. above 250 μm (Shein, 2005). This favourable soil state can similarly be characterised by the inflection point on the water retention curve (Dexter, 2004a, 2004b, 2004c).
A conceptual model for this soil state includes capillary pore space within aggregates to hold sufficient moisture to support microbial activity for nutrient transformations, also sufficient capillary pore space between aggregates to supply plant roots with water, but with sufficient macropore space between aggregates to otherwise allow the soil to drain and allow ingress of O2 to support root and microbial respiration (Victoria et al., 2012). Larger aggregates also coincide with young organic matter that provides a reservoir of N and P nutrients, and a carbon and energy source for microbial activity that degrades the organic matter and transforms the N and P for plant availability (see e.g. Tisdall and Oades (2012) and included references). Secondary clay and oxide minerals within aggregates can adsorb and maintain a reservoir of inorganic phosphorous, preventing its loss to groundwater recharge and runoff. The mineral surfaces can also sequester and reduce the bioavailability of heavy metals and organic pollutants as potentially toxic contaminants that may adversely impact microbial activity and plant productivity.
The main objectives of the research are to:
- • provide a fundamental description of how soil structure impacts processes and functions at soil profile scale;
- • establish Critical Zone Observatories to focus the study of soil and related processes at field scale;
- • develop a CZ integrated mathematical model of soil processes and functions;
- • create a GIS-based modelling framework to delineate soil threats and assess mitigation at EU scale;
- • demonstrate how environmental change can impact soil function and ecosystem services;
- • form with international partners a global network of CZOs for soils and related research;
- • design a future experiment to quantify soil processes and rates along global environmental gradients of climate, lithology and land use.
The overarching method for this experimental design is described below, together with a range of initial results and discussion of how this type of multidisciplinary research can be integrated to create interdisciplinary solutions to global soil threats.
2 Summary of experimental method and data analysis through mathematical modelling
The observatory method applied here has several key features in common with other Earth/ecological observatory approaches in natural sciences research. These include being strongly hypothesis driven with coupling in experimental design between mathematical modelling, particularly numerical simulation, and experimental observation. Measurements including observations from a range of spatial scales from molecular, through those of microbial populations, soil grains, soil profiles, catchments and river basins, to whole continents (Anderson et al., 2004; Brantley et al., 2006). Observations also span a large range of temporal scales. These include rapid (seconds–minutes), real-time sensing of fluctuations in environmental variables such as meteorological conditions, water flow, solute composition and transport. Measurements that are not made in real time include daily - decadal field sampling campaigns to retrieve and study samples. The measurement of proxy variables captures long-term geological changes in regolith composition and movement, and the biological evolution of Earth's surface, often employing the study of geological chronosequences (Brantley et al., 2007).
In order to test the overarching hypothesis, this study selected four principal CZOs at different stages along the Soil Life Cycle (listed in Fig. 3):
- • Damma Glacier Forefield CZO, Switzerland. The initial stages of soil formation are studied along a chronosequence established by retreat of the glacier during the past 150 years. Bedrock and deposited parent material are exposed at the ice face, with soil profiles established over increasingly longer time periods along a transect away from the glacier (Bernasconi and BigLink Project Members, 2008; Bernasconi et al., 2011);
- • The Lysina Catchment CZO, Czech Republic. The monoculture spruce forest plantation is actively managed for timber production and has been heavily impacted by acid deposition during the latter half of the 20th century with ongoing recovery due to decreasing acid loading during the past 2 decades (Kram et al., 2012);
- • The Fuchsenbigl-Marchfeld CZO, Austria. Long-term soil development under various land use including forest, grassland and cropland is studied through a chronosequence of fluvially deposited sediments, from currently ongoing deposition and erosion near the river channel to fluvial terraces formed during the Holocene some km away from the river (Fiebig et al., 2009; Lair et al., 2009);
- • The Koiliaris River Basin CZO, Crete, Greece. The impact of century- to millennia- long intensive land use for grazing and arable farming is studied at elevation stages from arable land in the coastal zone to grazing in the uplands reaching peaks of > 2000 m (Moraetis et al., 2010). These soils are under threat from both long-term intensive agriculture and also desertification pressure due to the anticipated effects of modern climate change in the Mediterranean basin (IPCC, 2007).
Additional sites are included in the experimental design, as an international network of CZOs. This second tier of sites expands the range of environmental conditions for the field data, and provides additional data sets to test new integrated mathematical models of soil functions that are developed from observations at the four main sites. The additional sites have been previously described (Banwart et al., 2011) and include The Red Soil Experimental Station CZO (Jiangxi, China), The Plynlimon Experimental Catchments CZO (Wales, UK), The Strengbach Catchment CZO (France), The Kindla Forest CZO (Sweden), The Shale Hills Catchment CZO (Pennsylvania, USA), and The Clear Creek Watershed CZO (Iowa, USA). The 1st-tier, four main CZOs are summarized in Table 1.
Sol TrEC CZO : descriptions des sites.
| Bedrock and soil | Geochemistry | Meteorology and hydrology |
| Damma Glacier Forefield CZO, Switzerland | ||
| Coarse-grained greeenschist facies metamorphic granite of the Aare massif Various metagranites with variations in the relative mineral proportions and grain size are also present The composition of the bedrock and soils along the chronosequence is relatively constant Soils classified as hyperskeletic leptosols Soils forming over bare rocks and till are 50–80% sand, 10–50% silt, < 4% clay, poorly structured with vertical zoning only in the older soils |
Dominant minerals: quartz, plagioclase, potassium feldspar, biotite and muscovite; epidote is present in significant amounts, also as inclusions in plagioclase Accessory minerals include magnetite chlorite and apatite Soil pH in 0.01 M CaCl2 decreases with soil age from pH 5.5 in young soils to pH 3.6 in the older soils Base saturation varies greatly, broadly decreases from 70–80% to 40–50% from younger to older soils Soil mineralogy closely reflects parent bedrock Reference soils outside the glaciated forefield: typically up to 10 wt.% TOC, 500–750 ppm Total P, 0.6–0.8% Total N |
Average precipitation 2300 mm yr−1 water equivalent, about half of which falls as snow; surface runoff 2700 mm yr−1, augmented by glacial meltwater; estimated evapotranspiration 70 mm yr−1 Snow cover c180 days of per year Mean air temperature 2.2 °C, annual maximum temperature 21.5 °C, annual minimum temperature −21 °C |
| Lysina Experimental Catchment CZO, Czech Republic | ||
| Base-poor, coarse-grained leucogranite Dominant soil type is folic albic skeletic podzol Mean soil depth 1 m Leucogranite dominated by feldspars and quartz, low biotite content |
Soil minerals: quartz, albite, orthoclase, amorphous Al, and muscovite Minor minerals: topaz, anatase, chlorite, hematite, tourmaline, and apatite Concentrations of organic C in the albic eluvial (E) horizon are low, higher concentrations are in the spodic B horizon, and lower concentrations in the C horizon Soil concentrations of N within horizons have a similar trend with depth as organic C Soil pH in water decreases with depth from 3.4 to 4.2 |
Average precipitation 980 mm yr−1, surface runoff 460 mm yr−1, estimated evapotranspiration 520 mm yr−1 Snow cover c120 days per year Mean air temperature 5.3 °C, mean maximum temperature 10.1 °C, mean minimum temperature 1.4 °C |
| Fuchsenbigl-Marchfeld Agricultural Field Station CZO, Austria | ||
| Incised basin fill and alpine meltwater terraces Up to 20 m of gravel covered in places by several meters of fine sediments, mainly silt and fine sands Soils classify mainly as fluvisols close to the river and chernozems with increasing distance from the river Soil ages include fresh sediments to sediments deposited more than 6000 years ago (Lair et al., 2009) |
Soil mineralogy of calcite, dolomite, quartz, plagioclase, K-feldspar and mica Clay mineralogy dominated by illite and chlorite (Lair et al., 2007) Soil carbonate contents and particle size distributions are similar along the soil chronosequence (Lair et al., 2007) Soil pH varies in a narrow range above neutral Organic carbon contents in the topsoil are strongly influenced by soil age and land use (Zehetner et al., 2009) |
Average precipitation 531 mm yr−1; no surface runoff with infiltration 25–75 mm yr−1; evapotranspiration potential 566 mm yr−1 Annual average days of snow cover: 33 days per year Mean air temperature 9.4 °C, annual maximum temperature 35 °C, annual minimum temperature −12 °C |
| Koiliaris Experimental Watershed CZO, Greece (Crete) | ||
| 71.8% of watershed on limestones, dolomites, marbles, and re-crystallized limestones with cherts (Plattenkalk, Tripolis, Trypali series), 9.5% calcaric marls in Neogene formations, 6.1% marls in Neogene formations; 6.1% schists and 6.4% Quaternary alluvial deposits Thin poorly developed soils follow regional lithology Soils in limestones correspond to alpine humic Ranker type and Podzols mixed with forest acid red soil with calcaric Lithosols at higher altitudes Soils in Neogene and Alluvial formations are thicker than on other formations with profiles of calcareous rendzines soil Calcaric regosols are developed in Neocene and Alluvial formations at low altitude Thin horizons of Eutric lithosols with mainly coarse texture are developed in schists |
Dominant mineral phases are illite, muscovite, kaolinite, paragonite, quartz, feldspars, calcite, chlorite and hematite/goethite, with about 30% clay mineral abundance Soil pH 7.6–7.9 pH range of 7.6–7.9 typifies Karstic groundwater Karstic groundwater with D.O. 6.3–7.8 mg/L and +300 mV Eh 2–4 m well in neogene deposits pH 7.2, D.O. 4.9 mg/L, 15 mg/L NO3−N |
Watershed altitude increases from sea level to 2500 m Average precipitation 1363 mm yr−1, surface runoff 621 mm yr−1, estimated evapotranspiration 455 mm yr−1 Snow cover 100–140 days/year, varying with altitude Mean air temperature at sea level 18.8 °C, mean minimum air temperature 15.2 °C, mean maximum air temperature 22.5 °C, with a temperature gradient with altitude of −5.6 °C/1000 m |
The methodology to test the role of soil structure in the development of soil processes and soil functions is based on measurements on new soil cores obtained at the four CZOs. The selected measurement methods have been summarized previously (Banwart et al., 2011), and include analysis of a range of physical, geochemical and biological soil properties. This data is used to parameterise a series of mathematical models of soil processes, which include:
- • water flow and solute transport;
- • geochemical speciation and physical-chemical aggregate stability;
- • weathering kinetics and acid-base dynamics of mineral dissolution;
- • carbon dynamics, nutrient transformations and bioavailability of C, N and P;
- • soil food web dynamics.
The results from these model calculations are compared to additional observations in small plot studies at the four CZOs. These studies are based on installation of lysimeter nests and analysis of pore fluid chemistry and selected stable isotopes. The calculated state variables for the various models include fluxes of water, solutes and particulates and element transformations as solute sources and sinks. Of particular importance is the inference of process rates from the model results, in order to quantify the relative contribution of soil processes to element mass and flux balances for soil profiles at the different field sites. The sampling strategy for soil cores at each site includes replicate cores within and between different locations at each site, in order to quantify uncertainty in process rates when comparing the different stages of the life cycle.
A new mathematical model has been developed dealing with Carbon dynamics and Aggregate STability (CAST). The model conceptualises carbon inputs and degradation in the formation and destruction of soil aggregates and resulting changes in the aggregate size distribution, which is being tested on the soil profile data obtained from the CZO's. The CAST model describes the aggregate size distribution with three size classes. We define the smallest size aggregates as < 50 μm and refer to them as the clay-silt fraction; microaggregates, 50–250 μm; and macroaggregates, > 250 μm), and conceptualize carbon dynamics as mass transfers between the inputs of litter and root/mycorrhiza and, for each aggregate size fraction: (1) below ground living biomass; (2) degradable dead carbon; and (3) occluded and sorbed organic carbon that is resistant to degradation. Inputs to the model are the flux of carbon into the soil, primary particles describing soil texture, and rate constants for carbon transformation between the pools derived from previous studies of soil carbon dynamics (Nikolaidis and Bidoglio, 2013; Stamati et al., in revision; Stamati et al., submitted), and rate constants for aggregation within and between particle size fractions to describe dynamic changes in soil structure (Fig. 4).
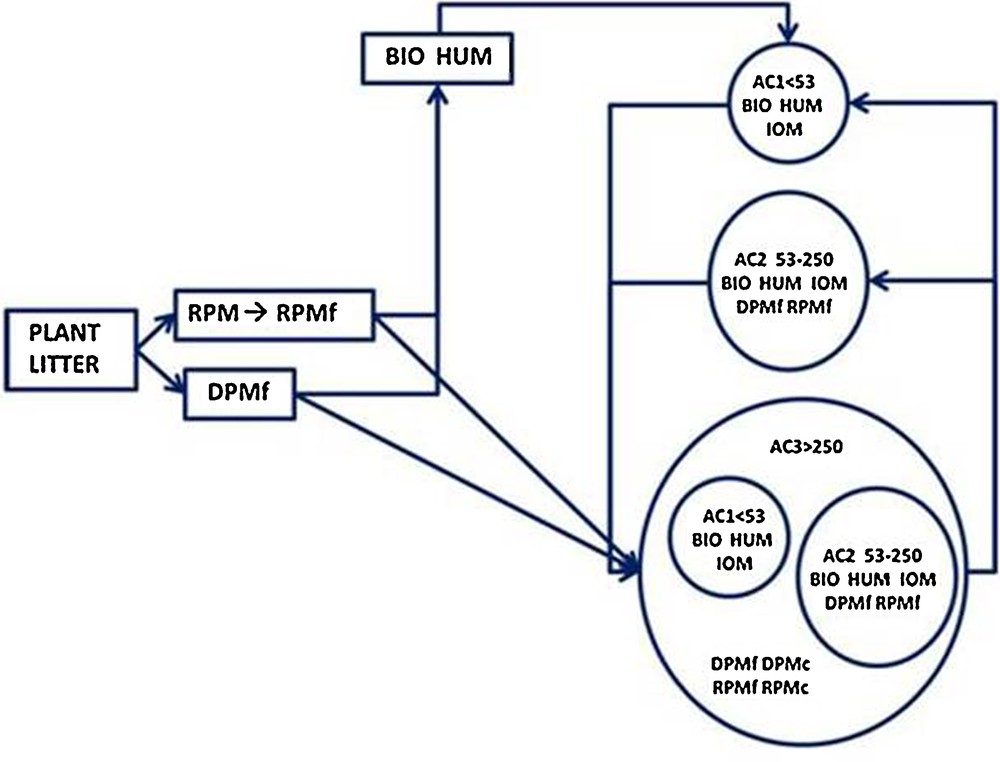
CAST model structure–modified from Stamati et al. (submitted). Plant litter is composed of a fine fraction, f(< 250 μm) of Decomposable Plant Material (DPM) and Resistant Plant Material (RPM) which is fragmented into a fine fraction (RPMf) that can also aggregate into a coarse fraction (RPMc). Some of this organic material is degraded further into humic material (BIO HUM) and some is incorporated into the macroaggregate fraction (AC3, Aggregate Class > 250 μm). Humic material and Inert Organic Matter (IOM) contribute to clay-silt size fraction (AC1, Aggregate Class < 53 μm) as well as the microaggregate fraction (AC2, Aggregate Class 53–250 μm). The model conceptualises the physical-chemical alteration rates of the carbon and aggregate pools as mass transformations between the pools.
Structure CAST modélisée–modifié d’après Stamati et al. (soumis). La litière végétale est composée d’une fraction fine f(< 250 μm) de matériau végétal décomposable (DPM) et matériau végétal résistant (RPM) qui est fragmentée en une fraction fine (RPMf) qui peut aussi s’agréger en fraction grossière (RPMc). Une partie de ce matériau organique est dégradée ultérieurement en matériau humique (BIO HUM) et une autre est incorporée dans la fraction « macroagrégats » (AC3, classe d’agrégats > 250 μm). Le matériau humique et la matière organique inerte (IOM) contribuent à la fraction argile-silt (AC1, classe d’agrégats < 53 μm) et à la fraction « microagrégats » (AC2, classe d’agrégats 53–250 μm). Le modèle conceptualise les taux d’altération physique et chimique des « pools » carbone et agrégats en tant que transformations massiques entre « pools ».
These state variables are then used to calculate changes to bulk soil properties including porosity, density, carbon content, water and gas permeability, and gas diffusivity. Soil organic carbon is an important starting point for modelling soil aggregation. Future work could incorporate other factors such as site-specific mineralogy, inorganic carbon and sesquioxides and their role in aggregate formation and stability.
3 Initial results
In this section, we present a synthesis of field observations and modelling results from different CZOs, building primarily on previously published work. The aim of this synthesis is to showcase examples of data sets and modelling approaches across a range of scales from soil profile to catchments. There are not yet comprehensive results for any single site, and combined field experimentation and mathematical modelling is ongoing. The measurement and modelling results presented here illustrate how integration through mathematical modelling is being used to advance new knowledge that links soil structure to soil processes and Critical Zone services.
3.1 Incipient soil formation in the Damma Glacier forefield
Studies of the Damma Glacier forefield provide data on initial soil formation on bare rock for up to 150 years (Bernasconi et al., 2011). Here, the sampling locations closer to the glacier represent younger soils than the ones further away from it. This is due to the overall glacial retreat during the past two centuries with rock and glacial outwash exposed at the face of the glacier representing fresh parent material for soil formation. Soil characteristics have been quantified along the chronosequence extending from the face of the glacier. Among different parameters measured, the effective cation exchange capacity (CECeff) represents the sum of charge equivalents of exchangeable cations; H+, Al3+, Na+, Mg2+, K+, Ca2+, Mn2+, Fe3+, and Zn2+ (mmolc kg−1). Values for CECeff increased (Fig. 5) while the base saturation (BS), the sum of charge equivalents of Na+, Mg2+, K+, and Ca2+ divided by CECeff (%), decreased with age. At older sites (i.e. sites far away from the glacier), the top layer (0–5 cm) showed higher CECeff (%) and BS than the layer below (5–10 cm). A few locations shared relatively higher values of CEC, BS and pH than others, presumably due to groundwater seepage and higher clay content than other sites. Both total organic carbon (TOC) and total nitrogen (TN) increased exponentially with age within the youngest group of soils. Within the oldest age group, TOC and TN increase with distance from the glacier at most sites. The differences could be explained by the difference in vegetation, especially nitrifying colonizers at relatively younger sites, or secondary deposition of sediments.
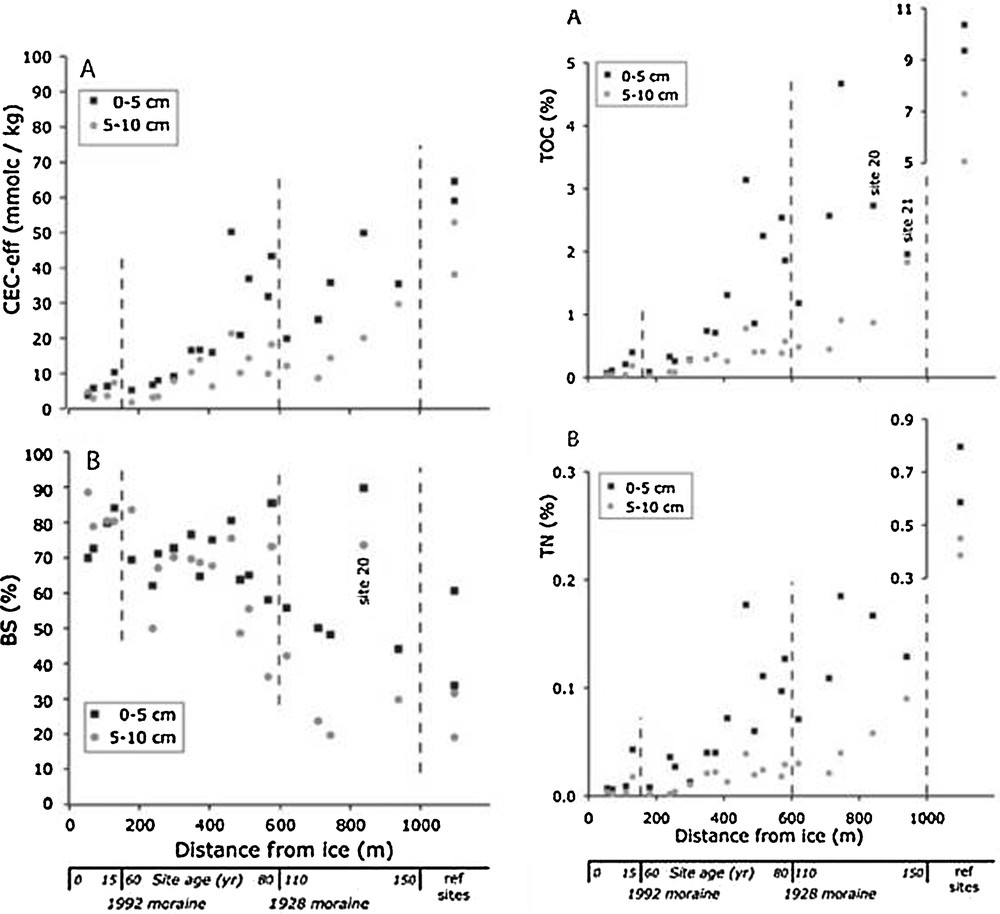
Changes in soil properties within the Damma Glacier forefield chronosequence of soil development (from Bernasconi et al., 2011). The diagrams at left show the changes in (A) Cation Exchange Capacity (CEC, defined in text) and (B) Base Saturation (BS, defined in text) with distance from the retreating glacier face. The diagrams at right show (A) the increase in soil organic carbon (TOC, defined in text) and (B) soil nitrogen contents (TN, defined in text) with increasing soil age.
Changements de propriétés de sol dans la chronoséquence de développement du sol de Damma Glacier. Les diagrammes de la colonne de gauche montrent les changements (A) de la capacité d’échange de cations (CEC définie dans le texte) et (B) de la saturation en bases (BS, définie dans le texte) en fonction de la distance à la face du glacier qui s’est retiré. Dans les diagrammes de la colonne de droite sont représentées en (A) l’augmentation en carbone organique du sol et en (B) et les teneurs en azote du sol en fonction de l’âge croissant du sol.
Further work on the soils at this site includes modelling the dynamics of soil structure development with increasing soil organic carbon content and soil age. This is being carried out with the CAST model. Expected results will quantify the rate of aggregate formation and soil structure development on decade-century time scales and the associated fluxes of carbon and nutrients into, and between, the different aggregate size classes.
3.2 Quantification of soil structure and water stable aggregate size distribution within the Fuchsenbigl-Marchfeld chronosequence
At the Marchfeld, soil samples were collected from six sites which represent soil formation under (semi-) natural vegetation (i.e. forest) as well as under intensive agricultural use (Kercheva et al., 2011). The aim of the soil characterisation was to quantify soil structure and aggregate stability as a function of land use, with a particular focus on soil carbon inputs and their impacts on soil structure. Soil stability is evaluated by the mass (% of total mass) of dry and water stable aggregates (WSA) within specific size fractions of a soil sample (Vershinin and Revut, 1952). An example from one of the sites with mixed broad leaved forest and a soil age of about 350 years (pers. communication, G. Lair) is given in Fig. 6. The site is adjacent to tilled land and grassland of the same soil age within the Marchfeld-Fuchsenbigl chronosequence, and represents a relatively undisturbed soil state as it developed with the natural succession of the vegetation cover. The forest soils from this location had very good soil water aggregate stability in the upper 20 cm. Another key finding was that the amount of WSA under native vegetation varied from 44–76% (Fig. 6) compared to 1% under intensive cultivation (not shown).
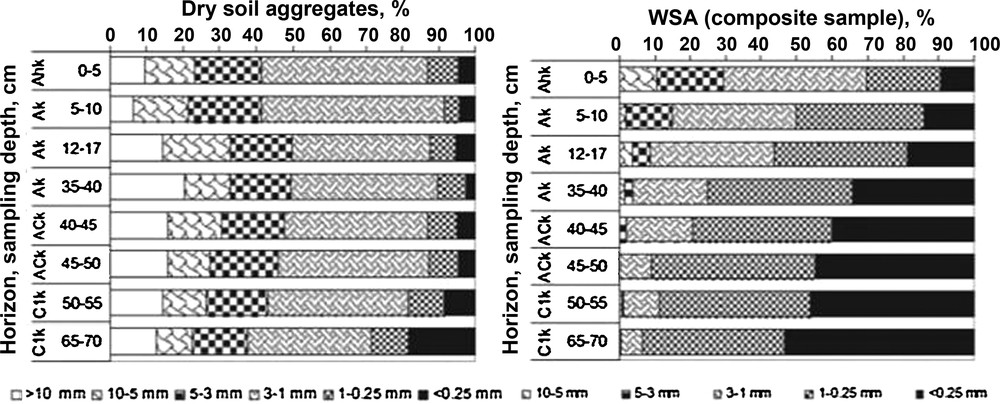
Plots of soil aggregate distribution and water stable aggregates (WSA) from soils in a predominantly mixed broad leaf forest (from Kercheva et al., 2011).
Diagramme représentant la distribution des agrégats du sol et des agrégats stables à l’eau (WSA) dans des sols d’une forêt de feuillus mélangés à feuilles larges prédominantes.
The characterisation of aggregate distribution and stability by size fraction provides data to test and develop the CAST model. The model quantifies the soil processes that may explain the empirical evidence that > 60% of stable aggregate mass in the size class > 250 μm is considered to coincide with favourable soil fertility and agronomic value (Shein, 2005). The stable aggregate size distribution is expected to be a characteristic that changes along the soil life cycle. Together with the type of biogeochemical characteristics shown above for the Damma Glacier CZO, soil structure determinations as shown in Fig. 6 will provide the test data for the CAST model and its application at the 4 main European CZOs.
3.3 Simulation of soil aggregate dynamics at the soil profile scale within the Koiliaris CZO
The results for a 100-year simulation regarding the evolution of carbon content using the CAST model is given in Fig. 7. The site within the Koiliaris CZO has a plot of set-aside land without tillage for the past 35 years that is adjacent to a similar plot that has been tilled each year during the same period.
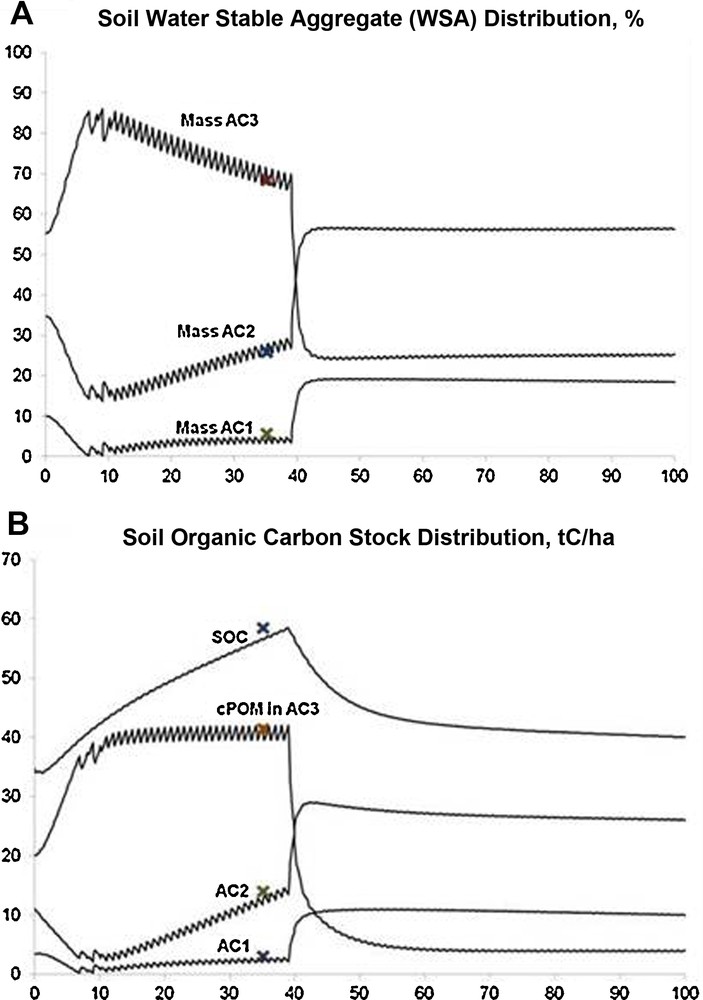
Simulated evolution of carbon content of modelled pools in the cropland converted (at time = 0) to set-aside land use, with return to tillage at year 40. The curves represent (A) the change in the water stable aggregate mass in the three size fractions aggregate type 1 (AC1, < 50 μm), aggregate type 2 (AC2, 50 μm < size < 250 μm), and aggregate type 3 (AC3, > 250 μm), and (B) the change in content of total Soil Organic Carbon (SOC), and the organic carbon content in the AC1, AC2 and AC3 aggregate size classes. Points indicate field measurements.
Évolution simulée de la teneur en carbone de « pools » modélisés dans une terre cultivée convertie (au temps 0) en terre laissée à l’abandon, avec retour au labourage à l’année 40. Les courbes représentent (A) le changement dans la masse des agrégats stables à l’eau dans les trois fractions de taille des agrégats : type 1 (AC1, < 50 μm), type 2 (AC2 50 μm < taille < 250 μm) et type 3 (AC3, > 250 μm) ; (B) le changement de teneur en carbone organique total du sol (SOC) et la teneur en carbone organique dans les trois classes de taille des agrégats AC1, AC2, AC3. Les points indiquent des mesures de terrain.
The CAST model was able to capture the carbon content, the C-to-N content ratio (not shown) and the fractionation of the pools comprising the three aggregate types: macroaggregates: > 250 μm (AC3), microaggregates: 53–250 μm (AC2), and silt-clay sized aggregates: < 53 μm (AC1) in the Greek sites. The model simulated land use conversion from cultivated (initial conditions) to set-aside (calibrated parameters). The calibrated parameters were related to the rate constants and turnover times of the carbon, as well as aggregate and structure turnover. The CAST model can be used to assess the factors controlling organic matter sequestration, aggregate stability, and aggregate size class turnover in soils. In this way, the model improves the prediction of the soil response to management practices, land use changes, and climate change.
The results of the CAST model for the Koiliaris CZO demonstrate the potential for the model to simulate the dynamics of soil aggregate formation through time at the other CZOs. The Damma Glacier and Fuchsenbigl-Marchfeld chronosequences represent the development of soil structure over time scales of decades to centuries and centuries to millennia, respectively. Data from these sites will be used to further test the CAST model's capability to simulate changes in soil structure over the history of soil development at the sites.
3.4 Soil carbon changes in forested catchments along a climate gradient at the continental scale
Based on the CAST model results for the Koiliaris CZO (Fig. 7), a further hypothesis is that soil aggregate dynamics are particularly sensitive to soil carbon sequestration and loss. Both historical and new data on soil carbon is being integrated with other data sets and process studies to gain insight into the process linkages between carbon dynamics, aggregate formation and stability, and other soil process rates. Initial data sets are provided by historical investigations that were carried out over the years 1983 to 2009 at 26 sites including the four Swedish Integrated monitoring (IM) sites; one of them being the Kindla CZO site. Litter decomposition shows different patterns in the South and the North of Sweden. From the large range of sites investigated, one representative example from North Sweden and one from the South are selected to show the differences. In the northern site, Reivo (N 65° 47′, E 19° 08′), the decomposition during the first year was lower in than the southern site Aneboda (N 57° 05′, E 14° 32′). However, in the Reivo site decomposition proceeded at a similar rate during years two and three while decomposition slowed during these years in the southern site (Fig. 8). Total decomposition over three years was higher at the southern site.
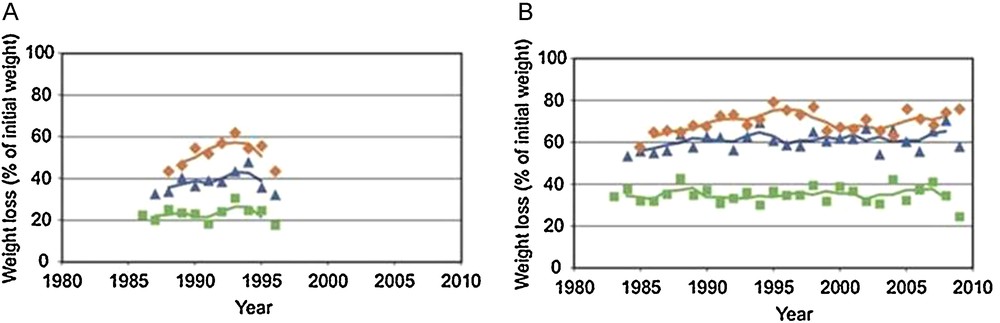
A. Cumulative litter decomposition for individual years in the northern PMK-site Reivo-Laxtjärnen. Materials of one (green), two (blue), and three (orange) years of age. Lines indicate 3 years moving averages. B. Cumulative litter decomposition for individual years in the southern PMK/IM-site Aneboda. Materials of one (green), two (blue), and three (orange) years of age. Lines indicate 3 years moving averages (from Bringmark et al., 2011).
A. Décomposition cumulative de la litière pour chaque année dans le site PMK septentrional de Reivo-Laxtjämen. Matériaux âgés d’une (en vert), deux (en bleu) ou trois (en orange) années. Les lignes indiquent les moyennes glissantes sur trois ans. B. Décomposition cumulative de la litière pour chaque année dans le site PMK/IM méridional de Aneboda. Matériaux âgés d’une (en vert), deux (en bleu) ou trois (en orange) années. Les lignes indiquent les moyennes glissantes sur trois ans (selon Bringmark et al., 2011).
It appears that decomposition may be extended over longer time periods in the north but total decomposition including all years is somewhat higher in the south. However, after only one or two years, the partly decomposed litter in the south became more recalcitrant compared to the northern sites litter (Bringmark et al., 2011). This could be caused by higher nitrogen contents after high initial decomposition and this would hamper further decomposition. The data show that the relative storage of fresh carbon input is greater initially in the north, with relatively faster carbon turnover in the south. Studies on ages and decomposition properties for the organic matter humus layers show similar trends in carbon turnover and storage (Fröberg et al., 2011).
3.5 Upscaling data and model results from soil profile- to catchment-scale and beyond
Mathematical modelling of soil processes facilitates integration of new data and knowledge. The results presented in the preceding sections illustrate the range of variables and processes that need to be quantified within models. An endpoint of such modelling is economic valuation of ecosystem services. Goods and services arise from flows of material and energy over time. For Earth's Critical Zone, goods and services can be quantified through the material (e.g. water, nutrients) and energy (e.g. primary productivity, biomass yield) flows at the catchment and landscape scales. The process descriptions that quantify these flows must be upscaled from the studies at soil profile scale, to the catchment scale. An initial phase of the research draws on existing catchment scale process models, starting with existing codes that have been used to develop mathematical models of the Czech Republic CZO. Projections of the future water balance and streamwater chemistry, according to different climate change scenarios, were evaluated for the forested Lysina and Pluhův Bor catchments in the Slavkov Forest.
The aim of the modelling exercise was to forecast hydrological patterns for the period 2071–2100, using outputs from two general circulation models (HadAM3H and ECHAM4/OPYC3), which were downscaled using three regional climate models (RCM) namely RCAO, CHRM and HIRHAM under the IPCC A2 and B2 emission scenarios defined by the Intergovernmental Panel on Climate Change (IPCC, 2007). Comparing the results of the modelled scenarios (Fig. 9) indicated that annual runoff is projected to decline by 10 to 30%, and impacts on the distribution of monthly flow are projected to be significant, with summer–autumn decreases of 30 to 95%, and winter increases of up to ∼40% compared to mean discharge for the period 1967–1990 (Benčoková et al., 2011a).
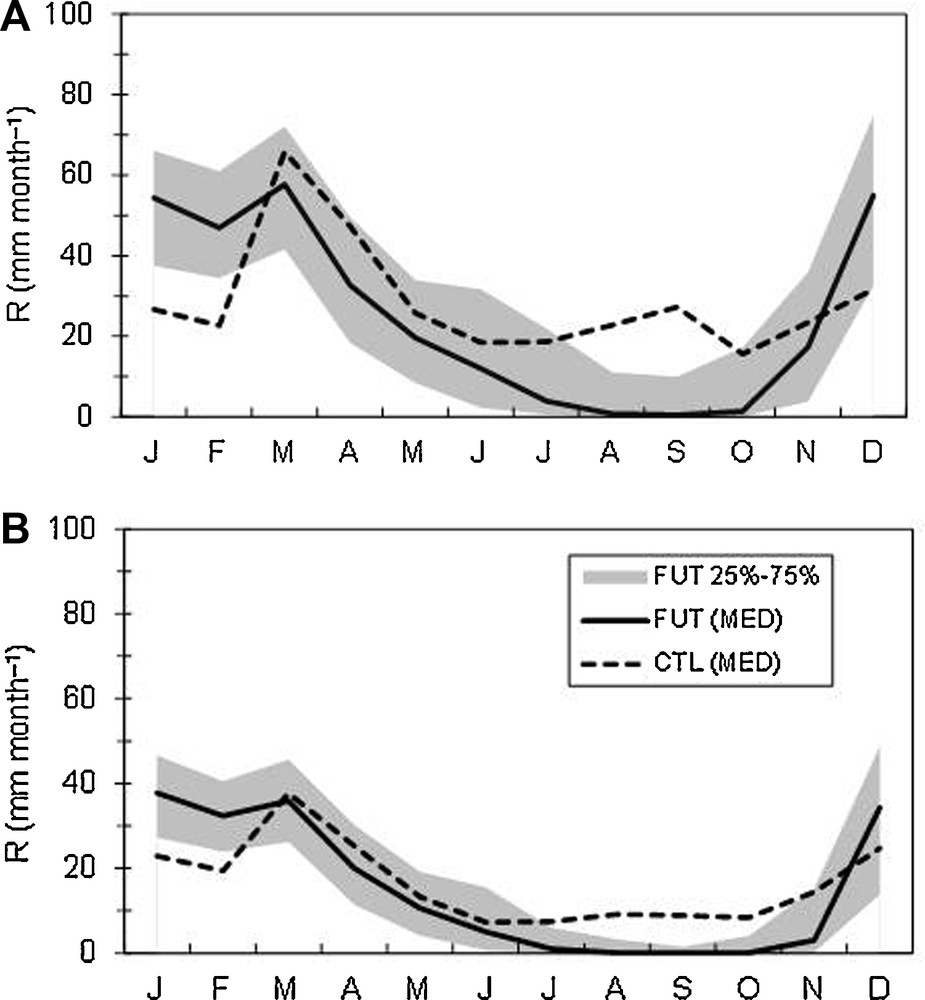
Annual series of mean runoff (R, mm month−1) for (A) Lysina (LYS) and (B) Pluhův Bor (PLB); FUT: future scenario period (2071–2100); CTL: control period (1967–1990); 25–75%: inter-quartile range of all scenarios; 10–90%: inter-quintile range (adapted from Benčoková et al., 2011a).
Série annuelle de ruissellement moyen (R, mm/mois) pour (A) Lysina (LYS) et (B) Pluhuv Bor (PLB) ; FUT : future période de scénario (2071–2100) ; CTL : période de contrôle (1967–1990) ; 25–75 % fourchette inter-quartile de tous les scénarios ; 10–90 % fourchette inter-quartile (adapté d’après Benčoková et al., 2011a).
In addition to the hydrologic modelling, geochemical simulations of stream water composition were also run using the MAGIC (Cosby et al., 2001) simulation code. The simulations revealed that the projected climate change will not have a significant impact on the chemistry of surface water at Lysina even though the projected decline in stream runoff for the pessimistic scenario would be significant (Fig. 10). The model indicated that surface water chemistry is primarily controlled by changes in acid deposition. However, the Lysina catchment is currently affected by high acidity due to historic anthropogenic acidification. Therefore, the environmental condition of the stream will probably remain unsatisfactory, with the dominant influences being the continued effects of acid deposition and forest management practices in the area (Benčoková et al., 2011b).
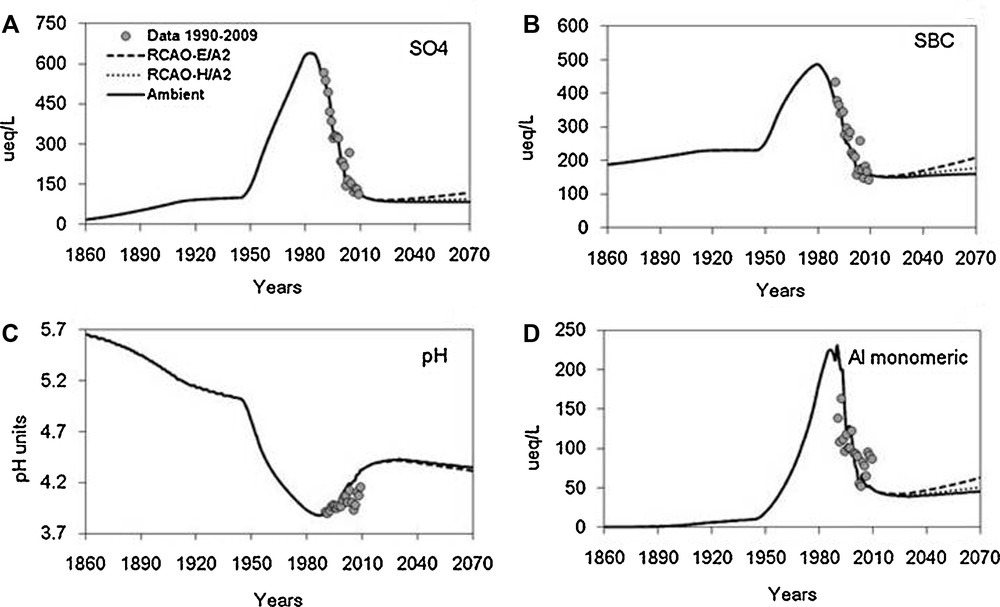
Observed mean annual (dots) and model predictions (lines) for streamwater constituents for the period 1860–2070; (A) sulphate ion, (B) sum of base cations, (C) pH, and (D) trivalent aluminium ions. The solid line represents mean annual ambient hydrology conditions, the dotted line the RCAO-H/A2 scenario and the dashed line the RCAO-E/A2 scenario. The sum of base cations (SBC) was calculated as charge equivalents of Ca2+, Mg2+, Na+, and K+ ion. Soluble Al concentration was calculated as the trivalent ion (adapted from Benčoková et al., 2011b).
Moyenne annuelle observée (points) et prédictions du modèle (lignes) pour les constituants de l’eau de rivière pour la période 1860–2070 ; (A) ion sulfate ; (B) somme des cations de base ; (C) pH et (D) ions aluminium trivalents. La ligne pleine représente les conditions hydrologiques naturelles moyennes annuelles, la ligne pointillée le scénario RCAO et la ligne tiretée le scénario RCAO-E/A2. La somme des cations de base a été calculée en équivalents charge de Ca2+, Mg2+, Na+ et K+.
4 Discussion
The ambition of the combined experimental observations and mathematical modelling is to develop an integrated process model that simulates soil processes in 1-D at the profile scale, and that is also implemented into a dynamic, 3-D geospatially variable model of soil processes at the catchment scale. The CAST model is the first step towards the integrated process model at the soil profile scale. Fig. 11 is a conceptual model of the flows of carbon and nutrients within Earth's Critical Zone that includes the aggregate formation and disaggregation dynamics of the CAST model processes (adapted from Nikolaidis and Bidoglio, 2013). These are noted in the figure as arrows that show transport of carbon and particle mass between the three aggregate classes of the CAST model.
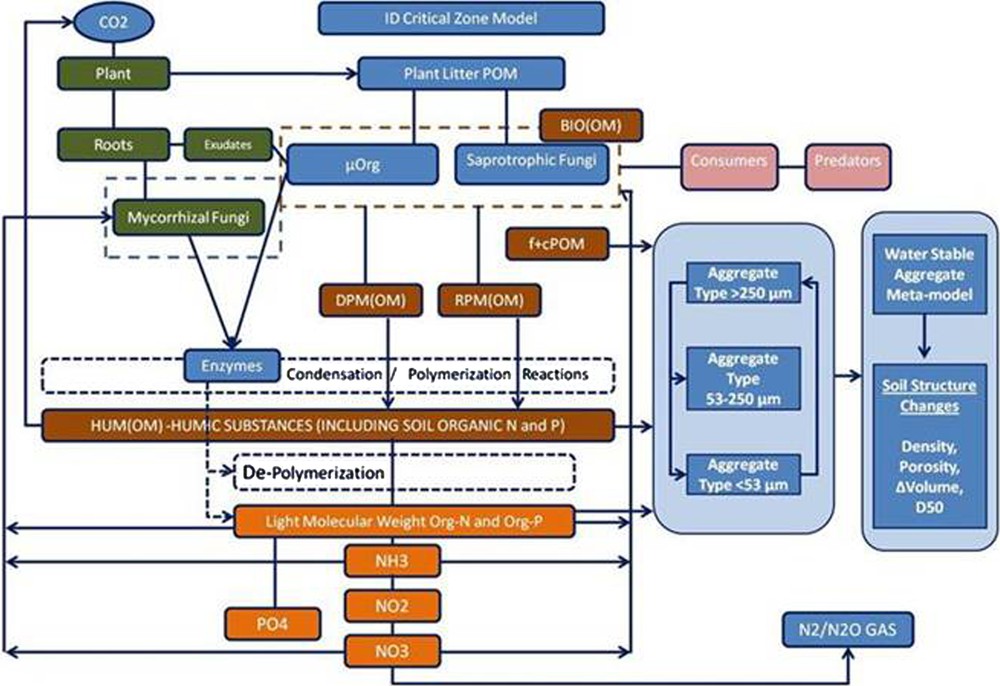
A proposed model structure for the CZ Integrated Model. The boxes represent mass pools of carbon and nutrients. The arrows represent mass flows and transformation between the pools (modified from Nikolaidis and Bidoglio, 2013).
Modèle de structure proposé pour le modèle intégré CZ. Les cartouches représentent les « pools » massiques de carbone et de nutriments. Les flèches représentent les flux massiques et les transformations entre les « pools » (modifié d’après Nikolaidis et Bidoglio, 2013).
In this conceptual model, carbon inputs are via above ground litter deposition and below ground root and mycorrhizal fungi carbon flows. A simplified food web dynamics model considers consumption of organic carbon pools by decomposers and grazing pressure from consumers and their predators. The outputs of such a model are the mass distribution and flows of soil carbon and associated nutrient (N, P, K) pools and soil aggregates. From these descriptions, the resulting changes in the physical soil parameters of bulk density, porosity, permeability and gas diffusivity are calculated through time as the bulk properties of the soil change with aggregate size distribution. The calculated soil parameters will be used in coupled simulations of water flow and reactive transport within the soil profile. In future work the CAST model will be incorporated directly into a simulation code that couples the processes of soil aggregate dynamics with those of flow and transport.
The CAST model is being adapted to include transformation of soil carbon including biomass degradation, and turnover of the associated N and P nutrient pools. The aim is to embed this process model into the SWAT (Soil and Water Assessment Tool, see Gassman et al., 2007) code for simulation of the processes represented in Fig. 11 at the landscape and catchment scales. The data sets from the four main European CZOs will be used to test the computational model that is developed. The tested model will be used to assess process rates and their variation within and between sites at the catchment scale using the modified SWAT code as a common, integrating data analysis framework. The results will be used to test the overarching hypothesis that soil processes evolve along a conceptual life cycle of soil development, and the hypothesis that soil structure development, i.e. aggregate formation, is a key indicator of soil state within the life cycle. Additionally, the results of the modelling will provide quantification of key flows of material and energy at catchment scale that contribute to the economic goods and services produced by Earth's Critical Zone at each field site. It is expected that an indicator of the relative position along the life cycle of soil function will be reflected in the relative value of the goods and services arising from soil processes at the CZO sites.
4.1 Translation of research results into science evidence for policy
Concurrent with the development of the DPSIR framework and the EU Thematic Strategy for Soil Protection, the Millennium Ecosystem Assessment (MA, 2005) was published, raising global awareness of the threats to Earth's ecosystems. The MA refined the ecosystem services framework, defining ecosystem services as, ‘the benefits we obtain from nature’. Many policy and decision making organizations ranging from the UNEP, FAO, and UNDP to national governments, e.g. the UK, are adopting a similar, so-called ‘ecosystems approach’ to link policy and science (Costanza et al., 1997; Daily, 1997; Westman, 1977). Critical Zone science addresses a broader range of environmental compartments and processes that give rise to goods and services. In particular, this extension to consider a broad range of “Critical Zone services” strongly embraces the benefits that arise from both geosphere and ecosystem dynamics. The added value of this extension of an ecosystems approach is that it seeks to use a common valuation system, often monetary, as a means to incorporate the often unseen value of benefits we obtain from the Critical Zone into decision making. A brief survey of the literature indicates three distinct, but connected objectives for an economic services framework:
- • to provide an economic indicator like GDP for national accounts that incorporates natural capital and Critical Zone goods and services (Fisher et al., 2009);
- • the development of decision making tools that consider Critical Zone services in the decision making and trade-off process (Nelson et al., 2009);
- • to create a mechanism by which payments for building natural capital and delivering Critical Zone goods and services can be developed (Kinzig et al., 2011).
SoilTrEC is addressing these objectives through a soil-centric, Critical Zone/ecosystems approach, endeavouring to place soils within suitable frameworks and addressing the ecosystem service challenges for soil science proposed by Robinson et al. (2012). With regard to national indicators, GDP already accounts for some natural resources so the challenge is how we better map, define and incorporate soil natural capital into this. One potential route is to adopt the natural capital framework for soils proposed by Robinson et al. (2009).
The next challenge is to identify and map soil ecosystem services. An important component of this is to develop decision making tools, so that policy makers can use biophysical models and decision support tools to evaluate the trade-offs of different management options. InVEST is an example of such a tool that is under development (Nelson et al., 2009), which aligns closely with the work of SoilTrEC. SoilTrEC is developing soil specific models and their linkages to the full vertical extent of processes within the Critical Zone, so that tools like InVEST can incorporate a better representation of soils. The overarching conceptual framework for the work of SoilTrEC has the project providing the biophysical models, which, when mapped with beneficiaries, can give the final goods or services distribution that would be valued. Concurrently, SoilTrEC is developing the conceptual frameworks and modelling approaches for decision support that includes life cycle analysis together with environmental economics valuation methods. The third challenge is currently beyond the scope of SoilTrEC, but as the new EU common agricultural policy focuses on payments for land stewardship and ecosystem services, this will become increasingly important for the research community to address and could be developed from the advances proposed here.
Clearly, the above examples indicate the need for integrated biophysical models to provide output that can be linked to information on beneficiaries in order to identify and map ecosystem services through strategies proposed for example by Fisher et al. (2011). Although this field of research is rapidly developing, little consideration has been given to the role of soils within the ecosystems framework, other than considering soil formation as a service of infinite value. SoilTrEC seeks to address this by further developing the conceptual frameworks and biophysical modelling approaches for soils that will help integrate with decision making for management options that consider impacts and intervention through the full extent of the Critical Zone.
5 Note
Fig. 6 reprinted from Applied Geochemistry, Volume 25 Supplement, Kercheva.M., Rousseva.S., Dimitrov.E., Nenov.M., Shishkov.T., Soil aggregation estimates in CZO-Fuchsenbigl, S57–S59, Copyright (2011), with permission from Elsevier.
Fig. 8 reprinted from Springer and the AMBIO/A Journal of the Human Environment, Vol. 40, Issue 8, 2011, pp. 878–890, Long-term monitoring of Scots pine litter decomposition rates throughout Sweden indicates formation of a more recalcitrant litter in the South, Bringmark. E., Bringmark. L., Sonesten. L., Mjofors. K., Johansson. M., Fig. 2, original copyright notice is given to the publication in which the material was originally published with kind permission from Springer Science and Business Media.
Acknowledgements
This work is supported by the European Commission 7th Framework Programme as a Large Integrating Project (SoilTrEC, www.soiltrec.eu, Grant Agreement No. 244118). The authors thank Heather Buss for a constructive review which substantially improved the manuscript.