

1 Introduction
The summer monsoon over India during the months of June, July, August and September (JJAS) is making the major contribution (80%) to the annual rainfall; therefore, this analysis is conducted for the summer monsoon season. As the primary source of water for agricultural production and water resource management, the prediction of Indian Summer Monsoon Rainfall (ISMR) is of great concern as it can affect the economy of the country. After the pioneer work by Sir Gilbert Walker (1923), many attempts have been made for the development of new statistical models (Acharya et al., 2011a; Gowariker et al., 1989; Rajeevan and McPhaden, 2004; Rajeevan et al., 2007). These statistical/empirical models are based on the teleconnection of ISMR with several atmospheric parameters like the Niño 3.4 Sea Surface Temperature (SST) anomaly, the North Atlantic surface pressure anomaly, the Equatorial Indian Ocean SST anomaly, etc. In recent times, the predictability of such models is limited as the relationship between ISMR and most of the atmospheric variables are weaker (Kumar et al., 1999).
Another alternative is the dynamical model which provides the summer monsoon rainfall prediction using coupled ocean–atmosphere or atmosphere general circulation models (GCMs). These models have been improved a lot in recent decades, which opens a hope in the field of ISMR prediction. The dynamical models also have limited skills, due to a large systematic bias which comes from the internal variability of the models (Kang et al., 2004). These GCMs are critically analyzed in terms of the predictability of rainfall over the Indian domain (Acharya et al., 2011a; Kang et al., 2004; Kumar et al., 2005; Singh et al., 2012a). They found that the proficiency of these GCMs is not satisfactory for the prediction of Indian monsoon rainfall. The uncertainties and limitations in GCMs produce the importance of a statistical post-processing which may improve the performance of GCMs. Due to the availability of a number of GCMs, several techniques are available for the multi model ensemble (MME) forecast (Acharya et al., 2011b; Krishnamurti et al., 2000, 2006; Nair et al., 2012; Sahai et al., 2008; Singh et al., 2012b). Simplest of all MMEs is the simple composite method (SCM) which is a simple arithmetic mean of all GCMs and proved better than the skill of individual models. The lucidity behind the success of such MME techniques in seasonal forecast is described in detail in Hagedorn et al. (2005). Therefore, a more sophisticated statistical technique is always needed to obtain a better combination of the multi model outputs.
Recently, the Canonical Correlation Analysis (CCA) has been used as a sophisticated statistical model for predicting ISMR. In CCA the original set of variables is transformed into a new set of variables having maximum linear relationship between them (Wilks, 1995), and it is one of the sophisticated statistical techniques. These new sets of variables are independent between them, due to the orthogonality property. This property of CCA has been widely used in the field of rainfall prediction using the atmospheric variables which project the spatial pattern of the predictand on the predictor (Barnston and Smith, 1996; Yu et al., 1997). On the other hand, the analysis has also been applied on GCM outputs in various studies (Landman et al., 2005; Lim et al., 2011; Tippett et al., 2005). Tippett et al. (2005) applied the CCA on each of the GCM output to correct the model forecast in terms of hindcast skill. However, here these GCMs are at a very low resolution that should be downscaled at the domain of interest. The present study uses CCA on the atmospheric variables predicted by several GCMs for improved MME schemes.
The concept of CCA is also used over the Indian domain for the development of a statistical model (Prasad and Singh, 1996). In a recent study, the CCA is applied on individual GCM outputs for rainfall and the post-processed outputs of each GCM are then combined at Indian grid points (Singh et al., 2012b). The skillfulness was found to be better as compared to SCM, i.e. the arithmetic mean of all GCMs. The present study is an extension of the work of Singh et al. (2012b) in which a new MME technique using CCA is developed for ISMR prediction. In the present study, the probabilistic prediction skill, as well as the performance of the prediction model during individual extreme years, is analyzed in details, which were not explored in the previous study.
Therefore, in view of the above studies highlighting the importance of CCA for the development of MME, the present study undertakes the following three major objectives as defined now:
- • the main objective of the present study is to apply a new sophisticated multi model ensemble using CCA (MMCCA) to develop a prediction scheme for monsoon rainfall. The performance of MMCCA is then compared with the simple composite method (SCM);
- • the probabilistic skill of the two schemes is examined and compared for the prediction ISMR;
- • the skill of the two prediction schemes (i.e. SCM and MMCCA) is also examined critically during the Indian monsoon extreme years.
In view of the above-defined objectives, the entire study is separated in subsequent sections. Section 2 deals with the detailed description regarding data sets and the methodology used to develop the prediction model. Section 3 discusses the outcomes of the study in detail. Finally, the entire study is concluded in view of the major findings of the study in the last section of the article.
2 Data description, the prediction schemes, and skill metrics
2.1 Data
The observed rainfall data for the specified season (JJAS) is obtained from the India Meteorological Department (IMD) starting from 1982 to 2008. The data set is at 1° × 1° latitude-longitude grid boxes on the landmass, which are based on the 2140 rain gauge stations (Rajeevan et al., 2006). This observed data is used for the development of prediction models as well as for the verification purpose. On the other hand, rainfall values over the extended domain excluding Indian grid points (10°S to 50°N and 50°E to 120°E) are obtained from CPC (Climate Prediction Centre) Merged Analysis of Precipitation (CMAP) estimated precipitation (Xie and Arkin, 1995). This data is merged with IMD data in order to obtain the predictand values over the extended domain covering all the monsoon features following Singh et al. (2012b).
Among the six GCMs used in the study, five are the products of data from the International Research Institute for Climate and Society (IRI), Columbia University, USA and remaining models are from the National Center for Environmental Prediction (NCEP).
The coupled models from IRI are the ECHAM4.5GML (referred to GML), ECHAM4.5MOM3AC1 (referred to MOM3AC) and ECHAM4.5MOM3DC2 (referred to MOM3DC). ECHAM4.5-GML is a slab-ocean mixed layer model having ECHAM4.5 as an atmospheric component, which is coupled to a slab-ocean mixed layer model, with CFS-predicted SSTs prescribed over the tropical Pacific basin. The other two fully coupled models are the ECHAM4.5MOM3AC1 and ECHAM4.5MOM3DC2, which are having the same atmospheric (ECHAM4.5) and oceanic components (Modular Ocean Model, version 3), while the first is anomaly coupled and the other is directly coupled. Both atmospheric models are the product of IRI having ECHAM4.5 as atmospheric GCM, which is forced with constructed analog SST in ECHAM4.5casst (referred to ECHcasst) and with CFS-predicted SST in ECAHM4.5cfssst (ECHcfssst). The Climate Forecast System version 1 coupled model of NCEP is also used in the analysis (referred to CFS). The model configuration and literature review are described by Acharya et al. (2011a) and Singh et al. (2012a). Table 1 gives a brief summary of each GCM including references from the relevant literature. These GCM outputs are extracted for the lead 1 forecast of rainfall for JJAS (that is, May start JJAS) for the common period of 27 years (1982–2008).
Résultats calculés à partir de GCM utilisés dans cette étude.
| Model | Resolution | AGCM | OGCM | Ensemble Member | Reference |
| CFS | (T62) ∼1.8° × 1.8° | GFS(2003 version) | MOM3 | 15 | Saha et al. (2006) |
| MOM3AC | (T42) ∼2.7° × 2.8° | ECHAM4p5 | MOM3 (anomaly coupled) | 24 |
Roeckner et al. (1996)
Pacanowski and Griffes, 1998 |
| MOM3DC | (T42) ∼2.7° × 2.8° | ECHAM4p5 | MOM3 (direct -coupled) | 12 |
Roeckner et al. (1996)
Pacanowski and Griffes, 1998 |
| GML | (T42) ∼2.7° × 2.8° | ECHAM4p5 | CFS-predicted SSTs prescribed over the tropical Pacific basin (semi-coupled) | 12 |
Roeckner et al. (1996)
Lee and De Witt, 2009 |
| ECHcasst | (T42) ∼2.7° × 2.8° | ECHAM4p5 | Constructed Analog SST | 24 | Roeckner et al. (1996) |
| ECHcfssst | (T42) ∼2.7° × 2.8° | ECHAM4p5 | CFS-predicted SST | 24 | Roeckner et al. (1996) |
2.2 Prediction schemes
The GCM outputs used in this study are at very low resolution as compared to the observation. Therefore, these GCMs should go through the refined statistical processes to downscale at Indian grid points in view of the removal of inherent systematic bias. The other important aspect is to obtain a robust forecast by the combination of these GCMs. Therefore, in view of the objective two MME techniques are applied. In one of the simplest way, the GCM's output is subjected to a bilinear interpolation at Indian grid points (1° × 1° latitude-longitude); the equally weighted multi model ensemble is then prepared. The technique is well known as the simple composite method (SCM). Another approach used for multi model ensemble is the Multi Model Canonical Correlation Analysis (MMCCA). In this technique the concept of CCA is used for downscaling and combining the GCM outputs over Indian grid points. CCA is a multivariate statistical technique in which the observed spatial (temporal) pattern is projected on the GCM spatial (temporal) pattern. In the present study, the temporal coefficients of the truncated empirical orthogonal function (EOF) known as principal component time series are obtained which are concatenated to obtain a single predictor matrix. This predictor matrix explains the maximum inherent spatial variability in the GCMs. The newly transformed predictor matrix enters in the CCA. The major steps followed for the multi model combination of GCMs are now listed:
- • leading principal components (PC) (temporal coefficients of EOFs) corresponding to each of the GCM (mainly 8 to 9 EOFs) output for rainfall are obtained;
- • a new predictor matrix is obtained by concatenating the PC time series corresponding to each of the GCM. This predictor matrix contains maximum spatial variability explained by all GCMs;
- • the corresponding predictor matrix is entered in the canonical correlation analysis. The details of the steps in CCA in order to obtain the reconstructed values of predictand variable is very well described and formulated in Wilks (1995), Yu et al. (1997), and Singh et al. (2012b).
The above stated methods (SCM and MMCCA) make a forecast in a deterministic way which cannot represent the inherent uncertainty of the predictions. Therefore, in this study an effort has been made to convert such MME predictions into probabilistic form. For prediction of Indian summer monsoon rainfall, a few studies (Acharya et al., 2011b; Kulkarni et al., 2012) have raised the issues of probabilistic forecast in the context of MME techniques. The probabilistic predictions are generated for tercile categories:
- • below normal;
- • near-normal and;
- • above normal, which are based on the observed climatology (Kharin and Zweirs, 2003).
Both the MME based prediction are used as the mean of the forecast distribution for the probabilistic method, whereas the spread is calculated by the correlation method (CR) proposed by Tippett et al. (2003). The detailed description of making probabilistic prediction on the basis of MME forecast is discussed by Kulkarni et al. (2012). The present study follows the same procedure to convert SCM and MMCCA forecast in probabilistic space.
The above-developed prediction scheme is verified in the leave-one-out cross validation mode prescribed by World Meteorological Organisation (WMO). In this procedure, one year is retained and the model is developed for the rest of the 26 years (as the time period of the present study is short, that is 27 years i.e., 1982–2008) and the predictand variable is estimated for the retained year. In this way, the cross-validated series for the predictand variable is generated, which is then validated against the observed series of rainfall on the basis of skill scores defined as below.
2.3 Skill scores
In the present study, the prediction schemes are generated in both ways, viz., deterministic and probabilistic. Therefore, skill scores used for the validation of the prediction scheme are broadly separated in deterministic and probabilistic skill measures which are summarized here.
2.3.1 Deterministic skill score
In the present study, we have used two skill measures for the evaluation of prediction schemes in deterministic way viz. correlation coefficient and index of agreement which are defined as below.
2.3.2 Root mean square error
The root mean square error is one of the basic measures used in the present analysis. The RMSE quantifies the difference between the estimated and the observed value. In the present study, RMSE is used as one of the skill measure of GCM in the Taylor (Taylor, 2001) diagram.
| (1) |
2.3.3 Correlation coefficient
It is very well known that the skill score is the measure of extent of linear relationship between two time series and is defined as:
| (2) |
2.4 Index of agreement (d)
The skill score like RMSE and the correlation coefficient have the limitation that they are not bounded and are unstable for very small (near zero) climatology of observation (Willmott, 1982). Therefore, in view of the limitation Willmott (1982) suggested a new skill matrix called index of agreement “d”, which is defined as:
| (3) |
2.4.1 Probabilistic skill score
The probabilistic skill measure of the prediction scheme is made using the Rank Probability Skill Score (RPSS). The RPSS measures cumulative squared error between categorical (i.e., tercile category) forecast probabilities and the reference categorical probabilities (Weigel et al., 2007). In common practice, climatological probability (i.e. 1/3 for each of the tercile category) is used for generating reference forecast. If the RPSS value is positive, the forecast is better than climatological forecast; on the other hand, if it is negative then the forecast is worse than the climatological forecast (Kulkarni et al., 2012; Weigel et al., 2007). The RPSS is defined as:
| (4) |
3 Results and discussion
Before examining the skill of MME methods, the individual GCM is examined and the skills are discussed in the forthcoming section.
3.1 Performance of individual GCM at all India level
At the outset, a Taylor diagram (Taylor, 2001) is presented in Fig. 1. The figure shows the skill of individual GCMs for prediction of ISMR at an all India level in terms of correlation, root mean square error (RMSE) and standard deviation. The effectiveness of the Taylor diagram is due to its compact representation. A single diagram is used because the cosine properties between RMSE, correlation and standard deviation all can be presented in a single figure. Therefore, the Taylor diagram is used to present individual GCM skill at an all India level in Fig. 1. The figure clearly indicates the significant correlation skill of three coupled GCMs used in the study with less RMSE. On the contrary, the GCMs highly under-predicted the observed standard deviation except of GML. GML predicted the standard deviation closer to the observed value with best correlation and least RMSE as compared to other GCMs. From the figure, a large variation in the prediction of ISMR is observed, whereas a smaller, or even negative, correlation is observed in the case of atmospheric GCMs with very large RMSE. Therefore, in the present study a multi model concept is developed to obtain a robust prediction for rainfall over India. The prediction skill of the two techniques will be discussed in detail in the forthcoming sections.
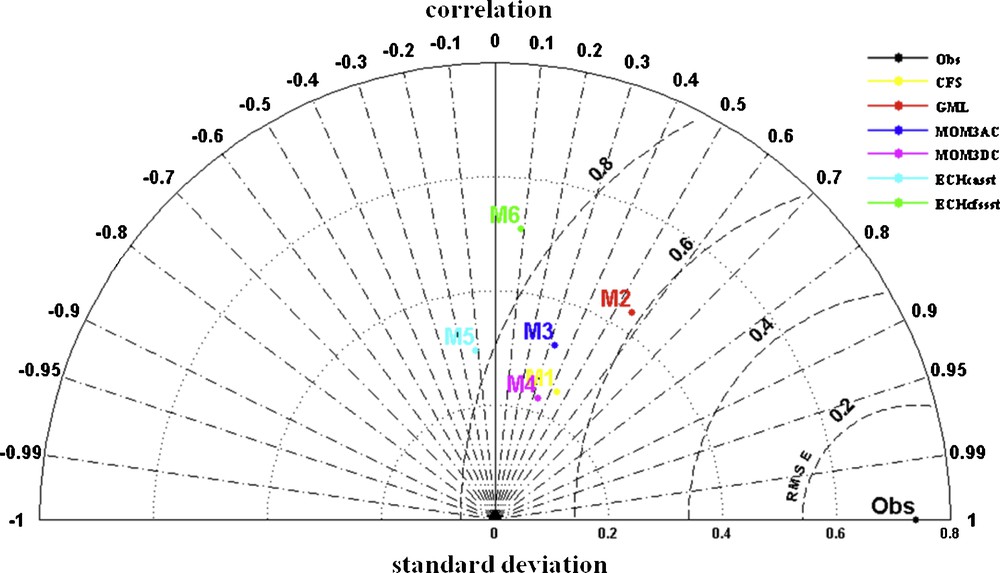
Taylor diagram for the prediction skill of GCMs at all India level.
Diagramme de Taylor pour la capacité de prédiction de GCMs au niveau de l’ensemble de l’Inde.
As described above, the prediction models are based on SCM and MMCCA where SCM is the simple composite method (SCM), which is the equal weighted mean of interpolated GCM at Indian grid points. On the other hand, MMCCA uses the concept of CCA to downscale the GCM rainfall values at Indian grid points. Both the models are verified in leave-one-out cross validation mode. To begin with, individual GCM performance for ISMR prediction is illustrated which is continued by the detail discussion of deterministic and probabilistic skill of the two prediction models.
3.2 Area averaged skill at all India level
Fig. 2 represents cross-validated time series for standardized rainfall anomaly at all India level for SCM and MMCCA. The black bars in the figure correspond to the observed rainfall anomalies, with the predicted rainfall anomalies from SCM (gray shaded) and MMCCA (white bars). The correlation between the observed and SCM predicted rainfall anomaly is found to be 0.32, whereas with the MMCCA, it is found to be 0.43. The skill is found significant at 95% confidence interval with higher skill in MMCCA at all India level.
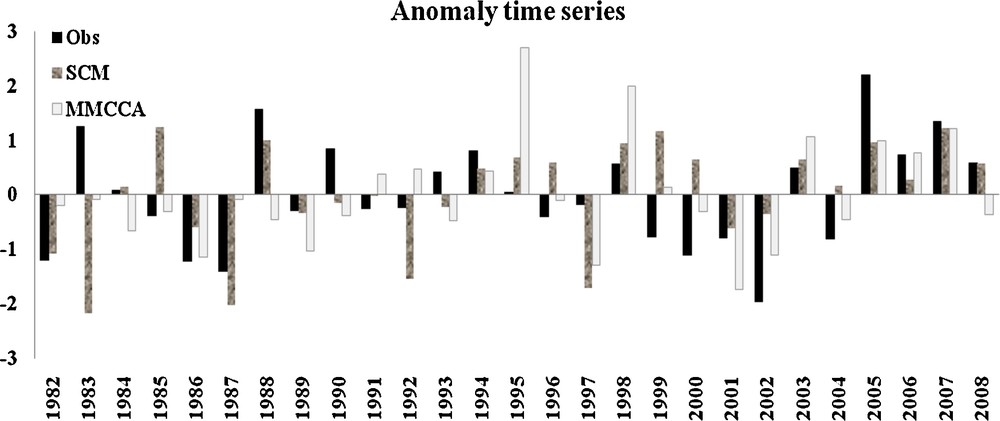
Time series in standardized anomaly for rainfall for the country as a whole. Black bars show the observed time series with the unfilled bar for MMCCA and texture filled for SCM. The correlation for the MMCCA and observed time series is 0.43 whereas, for SCM its 0.32.
Séries temporelles dans l’anomalie standardisée de pluviosité pour la région considérée comme un tout. Les barres noires correspondent aux séries temporelles observées, les barres blanches aux données de MMCCA, les barres grisées aux données de MME. La corrélation entre les séries temporelles observées et les données de MMCCA et de MME sont de 0,43 et 0,32, respectivement.
The critical evaluation of the models is made on the basis of rainfall anomaly pattern during excess/deficit rainfall years. The years having standardized rainfall anomaly greater than 1 are considered as excess years, while years having less than −1 standardized rainfall anomaly are defined as deficit years. Therefore, among 27 years, there are 5 years coming in the category of deficit rainfall and 3 excess rainfall years. The SCM and MMCCA both were able to predict the negative rainfall anomaly while the magnitude is found less in MMCCA during 1982, which is a deficit year. During 1986, MMCCA captured well the deficit rainfall but in 1987 it underestimated the observed rainfall. During the recent decade, MMCCA predicts well the observed rainfall anomaly for deficit rainfall years. On the other hand, there are some of the years in which SCM gave a false alarm of a deficit year, mainly during 1983 (highly negative rainfall anomaly), and 1985, but MMCCA predicted well the excess rainfall years. As it is observed in some of the studies (Singh et al., 2012a) during excess years the models are not able to predict the observed rainfall, which highly influenced the performance of SCM. On the other hand, MMCCA is found better during excess years, although the observed magnitude of rainfall is not captured in the model.
3.3 Grid point-wise cross-validated skill of the models
Fig. 3 shows the grid point-wise skill of two prediction schemes SCM and MMCCA on the basis of correlation with observed rainfall. From the figure, significant skill of both the schemes over some parts of the hilly region can be observed with higher skill in SCM over the north-eastern and some the parts of the southern parts of the country. On the other hand, MMCCA exhibits better skill over some parts of the northwest region like Punjab, Haryana, and Delhi, etc. also over the parts of Gujarat. The positive skill is also found over the west coast areas. On the other hand, positive skill over Tamilnadu is deteriorated in MMCCA. For the evaluation of year-to-year variation in spatial skill, an anomaly correlation coefficient (ACC) is evaluated (figure not shown). ACC shows the pattern correlation for each year. The analysis suggests that the model is able to predict observed spatial patterns better than SCM. Specifically, during deficit years the anomaly correlation coefficient is found to be quite high as compared to SCM (above 0.85 in MMCCA, 0.6 in SCM).
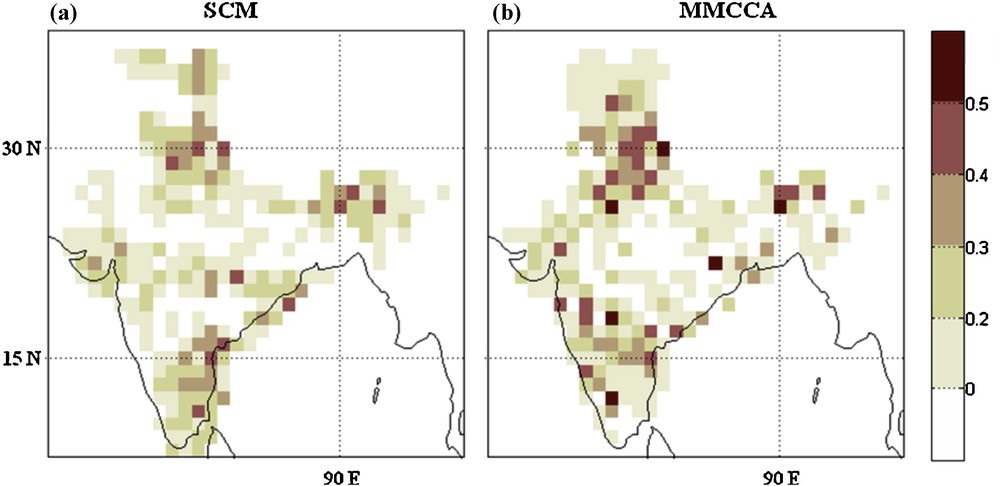
Leave-one-out cross-validated correlation skill is shown for SCM in left panel (a) and MMCCA in right panel (b).
La capacité de corrélation à validation croisée leave-out est présentée pour SCM dans le panneau de gauche (a) et pour MMCCA dans le panneau de droite (b).
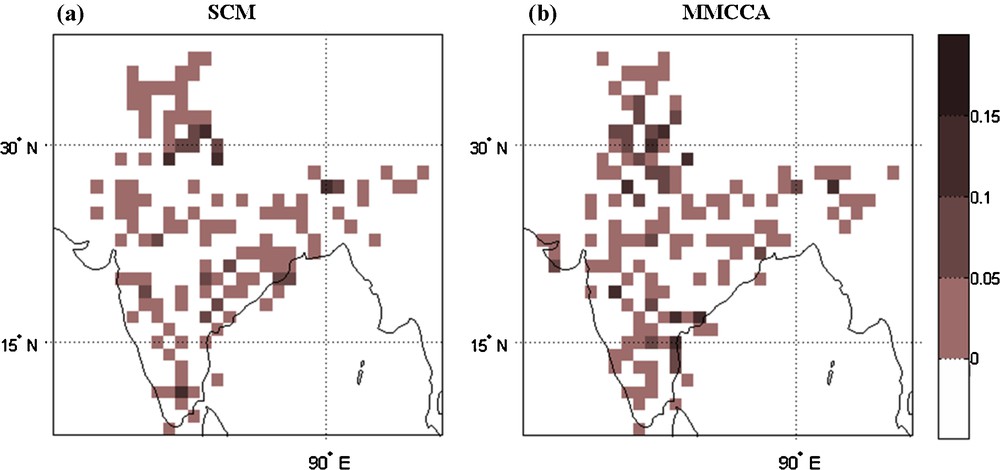
The model's spatial skill is also analyzed on the basis of index of agreement, which is shown on Fig. 4. In the case of the comparison of predicted values with the observed values it is more valuable and senseful to focus on this measure, which is defined by Willmott (1982). In terms of index of agreement (“d”), it is observed in Fig. 4 that in the case of SCM the value does not cross 0.5; that is, the scheme has not so much variation with respect to the observed climatology. In other words, SCM is not able to predict the extremes at grid point scale. Although the overall spatial pattern for index of agreement is found similar to that of the correlation in MMCCA, it is not the case for SCM. In SCM, the index of agreement is found very low over the areas having significant correlation skill. Therefore, the spatial and all India statistical skill measures suggest that MMCCA shows a consistent behaviour in all skill measures, which proves its potentiality as compared to SCM.
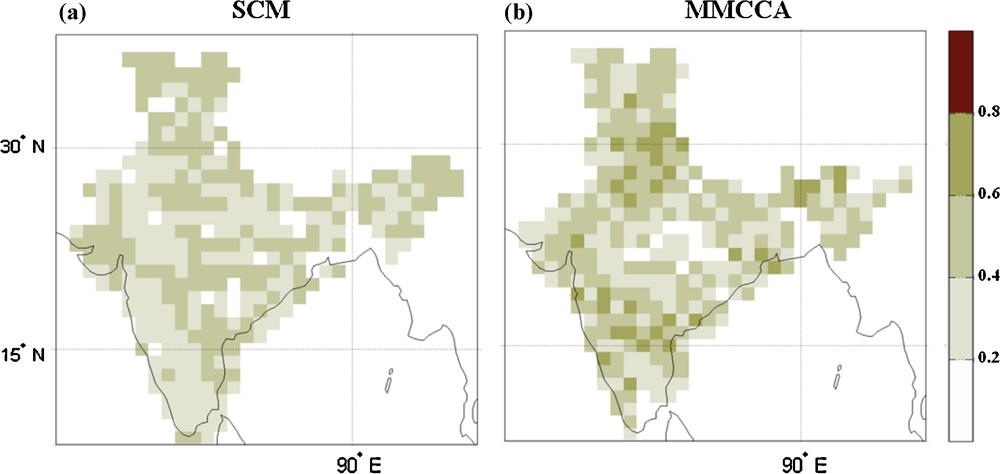
Skill of the prediction scheme in terms of index of agreement shown for (a) SCM and (b) MMCCA.
Capacité du schéma de prédiction en termes d’index d’accord pour SCM (a) et MMCCA (b).
On the basis of the above analysis, it is seen that there is an improvement in the predictability of Indian summer monsoon rainfall using the MMCCA as compared to SCM. The skill scores, like the index of agreement, show that the SCM does not have much variation at grid point level. In the present section, the percentage improvement is quantified in MMCCA with reference to SCM. For the purpose, the number of grid points for the Indian domain having correlation skill greater than a certain threshold is evaluated and the results are presented in Fig. 5. A similar kind of analysis is made for the index of agreement. From the figure, a clear increase in the total number of points for a correlation threshold of 0.3 (significant at 95% significance level) can be noticed. For example, the number of grid points having skill greater than 0.3 is observed at 40 grid boxes in SCM while in MMCCA, it is 50 (that is about 25% more). Similarly, for the correlation threshold 0.4, the number of grid points exceeding the corresponding threshold is found very large as compared to SCM (13 points having correlation skill greater than 0.4 whereas there are 27 points in MMCCA). The figure shows that in MMCCA the maximum skill is found to be 0.6, but is 0.5 in the case of SCM. The results clarify the picture of the noticeable improvement in MMCCA as compared to SCM. The areas with non-significant or even negative skills are more deteriorated in MMCCA, which affected the performance of the prediction model. On the other hand, the other skill measures like the index of agreement as shown in Fig. 5(b) also show similar kinds of results. There is much more improvement in the index of agreement, as is already seen in the grid point-wise skill. In SCM, none of the grid points show the value of d even close to 0.5, whereas in MMCCA almost 100 grid points show d values greater than the 0.5 threshold, which may be a good sign for the prediction model.
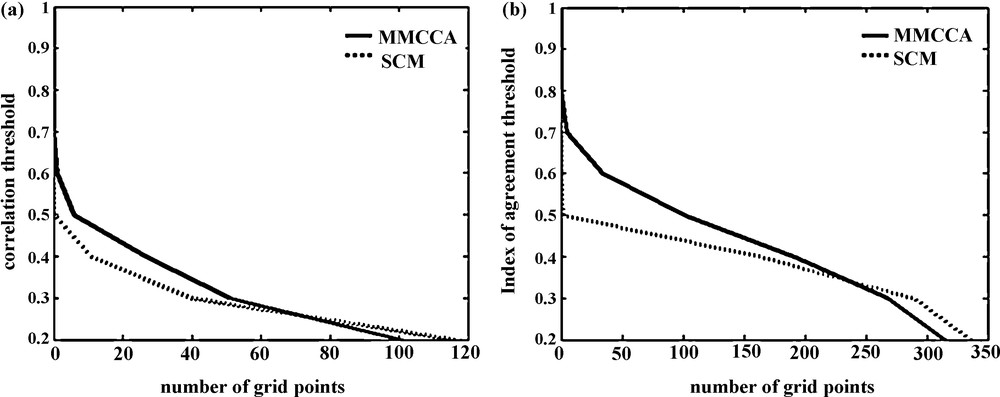
Number of grid points exceeding the threshold for the corresponding skill in the model SCM (shown in dashed line) and MMCCA (shown in solid black line).
Nombre de points de la grille dépassant le seuil pour la capacité correspondante dans le modèle SCM (ligne pointillée) et MMCCA (ligne noire).
3.4 Skill of probabilistic prediction
So far, it has been seen that the deterministic skill is improved in multi model canonical correlation analysis. In the present section, the probabilistic skill of the two schemes are analyzed in view of the emerging importance of probabilistic prediction in which the uncertainty in the prediction can be conveyed. For the purpose, empirical cumulative distribution function (cfd) for the observed and predicted normalized rainfall anomaly is evaluated at all India level and presented in Fig. 6. From the figure, it is observed that the SCM under-predicted the probabilities for rainfall anomaly specifically, for normal and excess rain categories. The less rain probabilities are well predicted by SCM. The empirical cdf predicted by MMCCA is presented in grey solid line, which shows an improvement in the technique in view of estimation of observed cdf. The probability for deficit years is found almost similar to the observation. Although, there is an overestimation for the normal rain anomalies, but the extent of overestimation is quite less than that of SCM. For excess rain anomalies, the probabilities derived from MMCCA are much closer to the observation.
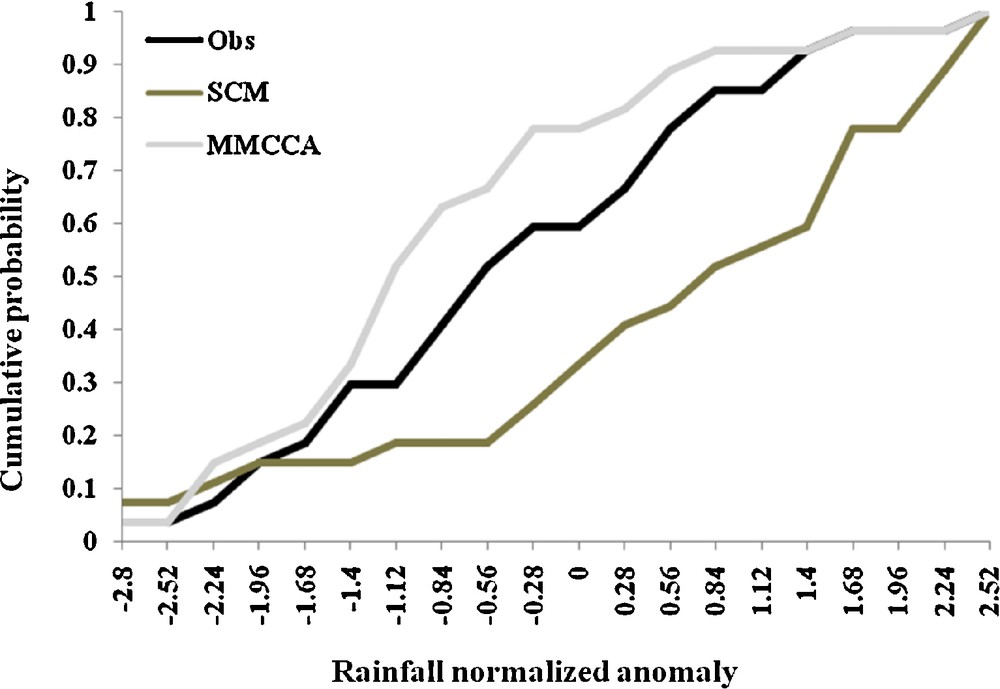
Empirical cdf at all India level for observed rainfall (black solid line), for SCM (solid line in mud), for MMCCA (solid line in grey).
Courbe cumulative de distribution empirique (cdf) au niveau de l’ensemble de l’Inde, pour la pluviosité observée (ligne noire), calculée à partir de SCM (ligne gris foncé) et de MMCCA (ligne gris clair).
In view of the prediction of the distribution function, we evaluated the skill in terms of Rank Probability Skill Score (RPSS). As already discussed earlier, RPSS is a similar kind of skill measure as RMSE for deterministic skill measurement. Therefore, the probabilistic skill measure in terms of RPSS is shown in Fig. 7. The evaluation of the skill measure is described in detail in Kulkarni et al. (2012) and Weigel et al. (2007). The pattern of RPSS is similar to the correlation pattern over the hilly areas, and over the eastern coastal areas in SCM whereas over the northeast and Gujarat region RPSS it is found to be negative irrespective of positive correlation. On the other hand, in MMCCA the pattern is quite similar to SCM but the probabilistic skill is a little enhanced in MMCCA, in almost all parts. In view of the figure, we can say that the model has the ability to give a probabilistic forecast having skill better than climatology.
Rank Probability Skill Score for (a) SCM and (b) MMCCA.
Score de capacité par rang de probabilité pour (a) SSM et (b) MMCCA.
3.5 Performance of the prediction model during extreme years
The extreme years selected for the analysis are 1982, 1986, and 2002 as deficit years and 1983, 1988, and 1994 as excess monsoon years which is based on the amount of rainfall ± 1 standard deviation of the long-term mean (normal) values at all India level. The rainfall standardized anomaly predicted by the prediction models along with the observed values are shown in Fig. 8. The first row in the figure is for the observation (referred as Obs); the second row corresponds to SCM and the last row to MMCCA. From the figure, the negative rainfall anomalies are observed over all parts of the country, which experienced less rainfall during 1982. Some positive anomalies are found over some parts of northeast and west central India. The rest of the parts of the country experienced less rainfall as compared to climatological value. On the other hand, the prediction model SCM predicted less rainfall almost over all parts of the country, whereas MMCCA is not able to predict deficit rainfall over the southern, as well as over the west central parts of the country. During another deficit year 1986, the all India rainfall anomaly is found on the negative side (–1.2). The SCM predicted normal rainfall over the southern belt including the west central areas. On the contrary, the year is well predicted by MMCCA in which the spatial pattern is well captured in the model. In MMCCA some positive rainfall anomalies over the northeast and west central parts are almost captured with the negative rainfall anomalies in the remaining parts of the country where SCM predicted rainfall anomalies in the normal category (between −0.5 and 0.5). During year 2002, almost all parts of the country experienced very much less rainfall except some parts of the northeast. High negative rainfall anomalies were observed over northwest India and the coastal parts of the country. The prediction model SCM is unable to show the observed spatial structure as it predicted a normal rainfall. On the other hand, during this year the MMCCA performed better as compared to SCM as it predicted the observed rainfall anomalies. Therefore, from the figure it can be concluded that MMCCA is able to capture the observed spatial structure reasonably well except of 1982.
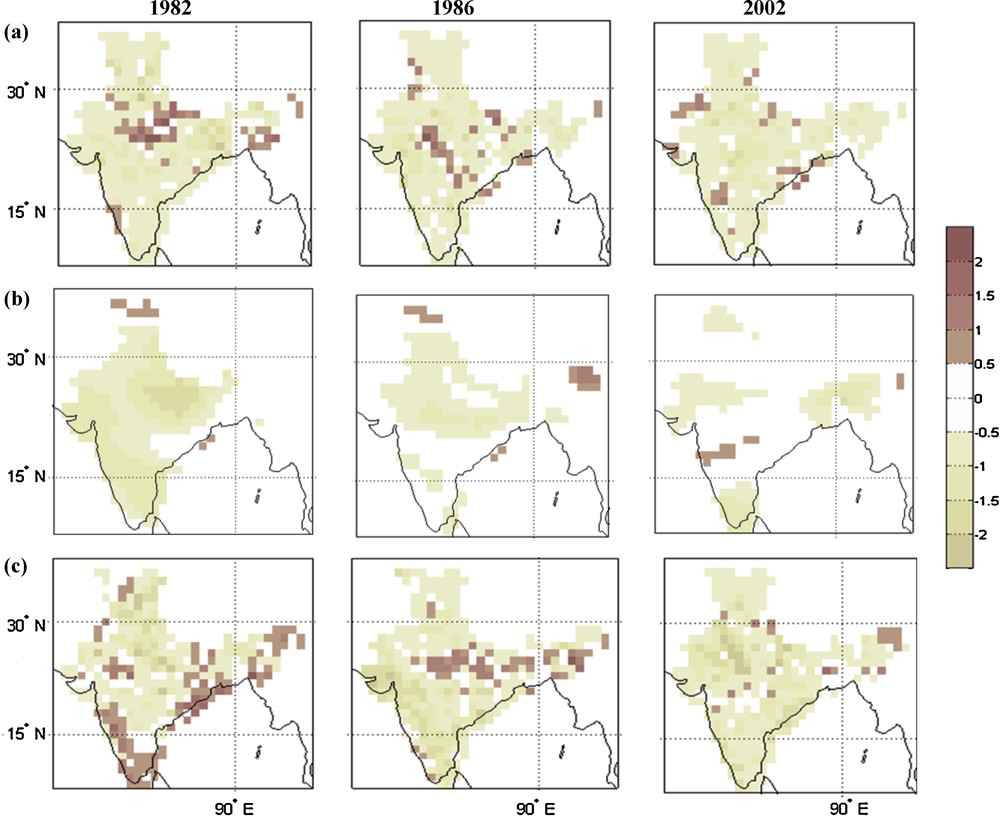
Standardized rainfall anomaly during the extreme deficit years (1982, 1986, 2002). The first panel in the figure corresponds to observed features, second panel to SCM, and the third panel to the MMCCA.
Anomalie de pluie standardisée pendant les années de déficit extrême de pluie (1982, 1986, 2002). Le premier panneau de la figure correspond aux caractéristiques observées, le deuxième aux données de SCM et le troisième à celles de MMCCA.
Similarly the model's performance during three excess rainfall years are evaluated and shown on Fig. 9. During 1983, an entirely opposite spatial structure is predicted by SCM, which gave a very strong wrong signal for an extreme deficit year. The model MMCCA performed better as compared to SCM, whereas the pattern over the southern region is predicted in the opposite direction. During the years 1988 and 1994, the performance of SCM is not found to be satisfactory especially during 1988. The spatial variability is not very well captured in the SCM. For the same year, MMCCA predicted less rain over the northwest, parts of west central and southern parts of the country. The spatial pattern is not well predicted by SCM besides the fact that SCM predicted all India rainfall reasonably well. In view of the figures, we can say that the MMCCA has some potential to predict the spatial variation during the excess/deficit years while, over some parts the model does not show the observed variability, such as in Tamilnadu in the southern part where there was no skill in the model.
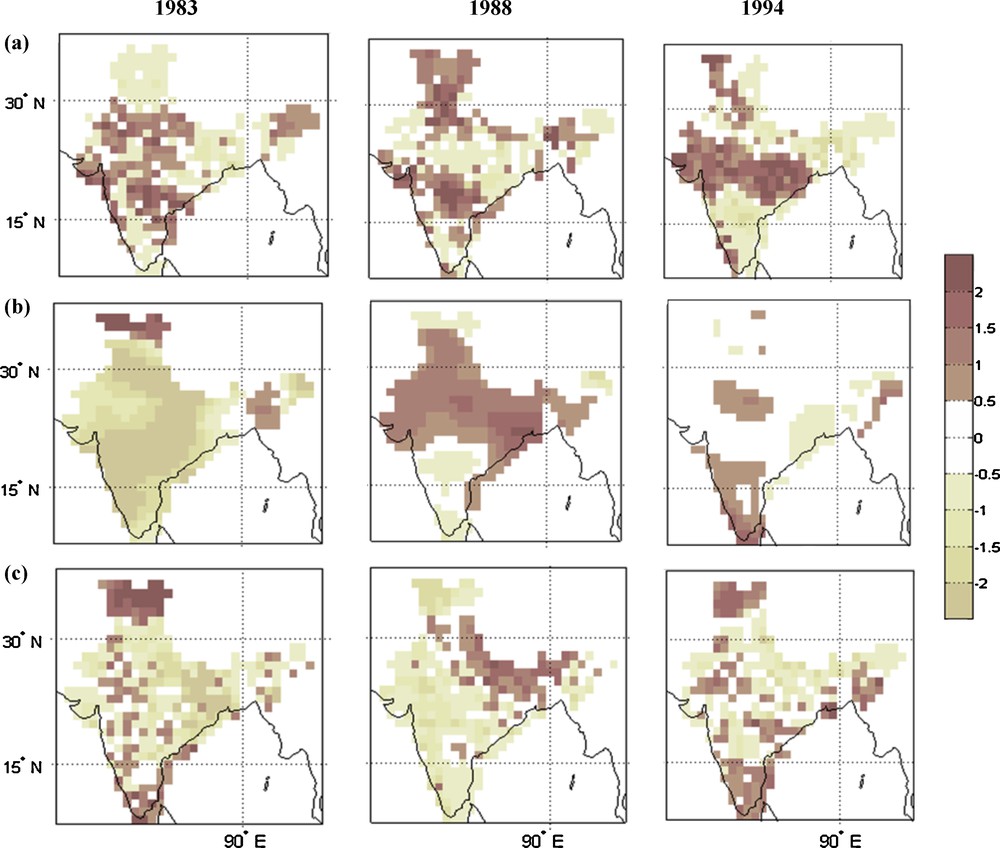
Standardized rainfall anomaly during the extreme excess rain years (1983, 1988, 1994). The first panel in the figure corresponds to observed features, second panel to SCM, and the third panel to the MMCCA.
Anomalie de pluie standardisée pendant les années d’excès extrême de pluie (1983, 1988, 1994). Le premier panneau de la figure correspond aux caractéristiques observées, le deuxième aux données de SCM et le troisième à celles de MMCCA.
The analysis suggests that there is an improvement in the performance of multi models using canonical correlation analysis. In the approach, the leading PCs corresponding to each GCMs are concatenated and entered in the analysis. These PCs represents the whole spatial variability of the system and then the canonical analysis is used to obtain the best-correlated pairs of predictor and predictand. The canonical correlation between the canonical variables was found to be very high (of the order of 0.9). This fact may be reason for the improvement in the multi model performance, as the predictor contains the maximum rainfall characteristics over the entire domain.
4 Summary and conclusions
The present study focuses on developing a CCA-based multi model ensemble scheme prediction system prediction model to improve the ISMR prediction. For the purpose, six general circulation model outputs for rainfall from year 1982 to 2008 are used. These GCM hindcast for rainfall is extracted for lead 1 that is the model's forecast initialized in the month of May for JJAS. Canonical correlation analysis is applied on these GCMs to obtain a skilful multi model ensemble of the GCM output. As a benchmark, the rainfall obtained from the developed model (MMCCA) is compared to the SCM, which is the arithmetic mean of the interpolated GCM outputs. Deterministic and probabilistic, both type of prediction skill are compared. In order to achieve the second objective of the study, the performance of the prediction models are examined during the Indian monsoon extreme years. The main findings of the study are summarized in the following few major points:
- • the deterministic as well as probabilistic prediction skill on the basis of correlation and index of agreement suggests an improvement in the MMCCA as compared to SCM for Indian summer monsoon rainfall prediction;
- • the results are well supported by the quantification of improvement in the MMCCA compared to SCM. The anomaly correlation mainly during the extreme monsoon years shows a noticeable improvement in MMCCA at all India level;
- • in view of the performance of prediction models during extreme years, the underestimation is observed in SCM. The prediction model MMCCA is able to predict the observed spatial pattern during deficit years while this is not the case for excess years.
In view of the above objectives, however, the prediction skill is improved in MMCCA, but there are some limitations. In the case of the estimation of unknown parameters, the number of training sets should be large in order to obtain a robust estimation. The present study suffers from the short length of the training period (27 years). It is planned that the present work will be expanded by using CCA for downscaling rainfall from different large-scale features (SST, wind component, Outgoing Long Wave Radiation, etc.) obtained from GCM.
Acknowledgments
This research has been conducted as part of the project titled “Development and Application of Extended Range Weather Forecasting System for Climate Risk Management in Agriculture” at IIT, Delhi, sponsored by the Department of Agriculture and Cooperation, Government of India. We gratefully acknowledge the International Research Institute for Climate and Society (IRI), modeling and prediction group led by D. Dewitt for making five of their GCM-based seasonal forecasting systems available to this study, as well as the IRI Data Library group led by B. Blumenthal. Gridded rain data have been obtained from India Meteorological Department (IMD). Also, the authors thank the National Oceanic and Atmospheric Administration National Centers for Environmental Prediction Climate Prediction Center Merged Analysis of Precipitation (CMAP) for providing the rainfall data. The authors express their sincere thanks to the anonymous reviewers for valuable comments and suggestions which improved the manuscript significantly.