

1 Introduction
Mercury (Hg) is a global pollutant, which enters the Canadian Arctic Archipelago (CAA) waters through (i) dry and wet deposition from the atmosphere, (ii) influx from adjacent ocean basins and (iii) continental inputs through riverine discharge (AMAP, 2011; Fisher et al., 2012; Kirk et al., 2012; Sonke et al., 2013; Sunderland and Mason, 2007). In its methylated form, Hg is particularly toxic and concentrates in marine organisms with highest levels found in species at the top of the trophic chain, posing ecological threats to top predators, including humans (Mergler et al., 2007; Oostdam et al., 2005). The CAA connects the Arctic Ocean to the Atlantic Ocean (Dickson et al., 2008). In the CAA seawater, exchange between Arctic and Atlantic Oceans takes place through the relatively long channels of the Nares Strait, the Cardigan Strait, and the Lancaster Sound. Although water exchange occurs in both directions, the net average flow of approximately 1.8 Sv/year (Sverdrup/year) is towards the Atlantic Ocean (Dickson et al., 2008). The CAA thus plays an important role in the global cycling of seawater as well as in that of Hg.
Recent developments in Hg isotope ratio measurements show the potential of this technique for the identification of Hg biogeochemical reactions in the environment, as well as for tracing and distinguishing among different sources of Hg (Feng et al., 2010; Foucher et al., 2009; Perrot et al., 2010). Hg isotope ratio measurement could allow a better understanding of Hg biogeochemical cycling in Arctic environment and consequently in establishing policies aiming at minimizing harmful effects of Hg in the Arctic and reduce Hg contamination in the Arctic. Hg isotopes are fractionated during biogeochemical processes due to difference in mass (mass-dependent fractionation, MDF) (Bigeleisen and Mayer, 1947; Urey, 1947), as well as due to differences caused by the magnetic isotope effect and nuclear field shift (mass-independent fractionation, MIF) (Bigeleisen, 1996; Schauble, 2007). MIF was first shown to be limited to odd Hg isotopes (Bergquist and Blum, 2007; Bigeleisen, 1996; Schauble, 2007; Zheng and Hintelmann, 2009), but recent results of Hg isotope ratio measurements in precipitation show significant positive MIF for even Hg isotopes also (Chen et al., 2012; Demers et al., 2013; Gratz et al., 2010; Rolison et al., 2013).
Hg isotope ratios in Arctic Ocean water has not been determined yet, mainly due to the relatively low Hg concentrations in Arctic seawater, varying between 0.14 and 2.9 ng/L (Kirk et al., 2008; Wang et al., 2012). To overcome this analytical challenge, a technique for the pre-concentration of Hg on an anion exchange resin, developed by Štrok et al. (2014), was used. This technique utilizes quantitative Hg pre-concentration from large seawater sample volumes (more than 20 L) to gain sufficient mass of Hg for precise Hg isotope measurement using multi-collector inductively coupled plasma mass spectrometry (MC-ICP-MS). Due to the challenges associated with storage and transportation of large volumes of seawater, this procedure was tested in the laboratory to provide reliable Hg isotope ratios results after long-term storage of the anion exchange resin with adsorbed pre-concentrated Hg (Štrok et al., 2014). Consequently, this procedure was deemed to be suitable for Hg pre-concentration immediately after sampling on board research vessels and shipping anion exchange resin columns instead of large volumes of seawater.
The objectives of this study were: (i) to field-test the suitability of this novel procedure to pre-concentrate Hg from seawater on board research vessels and (ii) to acquire first-of-a-kind results for Hg isotope ratios in seawater samples in locations of interest in the CAA. Although the procedure developed by Štrok et al. (2014) was capable of producing reliable results in the laboratory, performing the same procedure under field conditions can be affected by the different laboratory environment resulting in much less control over Hg contamination issues, as well as the limited time available for sample treatment between the sampling stations. These and other limitations of the method can only be assessed by conducting practical fieldwork in order to fully understand the advantages and limitations of the method. In this study, time constraints did not allow onboard pre-concentration for the last two stations (117 and 304, Fig. 1) and water samples collected from those stations were shipped back to the laboratory for pre-concentration. Although the samples pre-concentrated in the laboratory were not collected at exactly the same locations as those pre-concentrated on board to allow direct comparison of different sampling methods, they were used to assess the two methods since there are no known large point sources of Hg that could significantly alter total Hg concentrations, present in those regions. Consequently, it was expected that total Hg concentrations in samples from these two stations would be in the same range as samples from other stations.
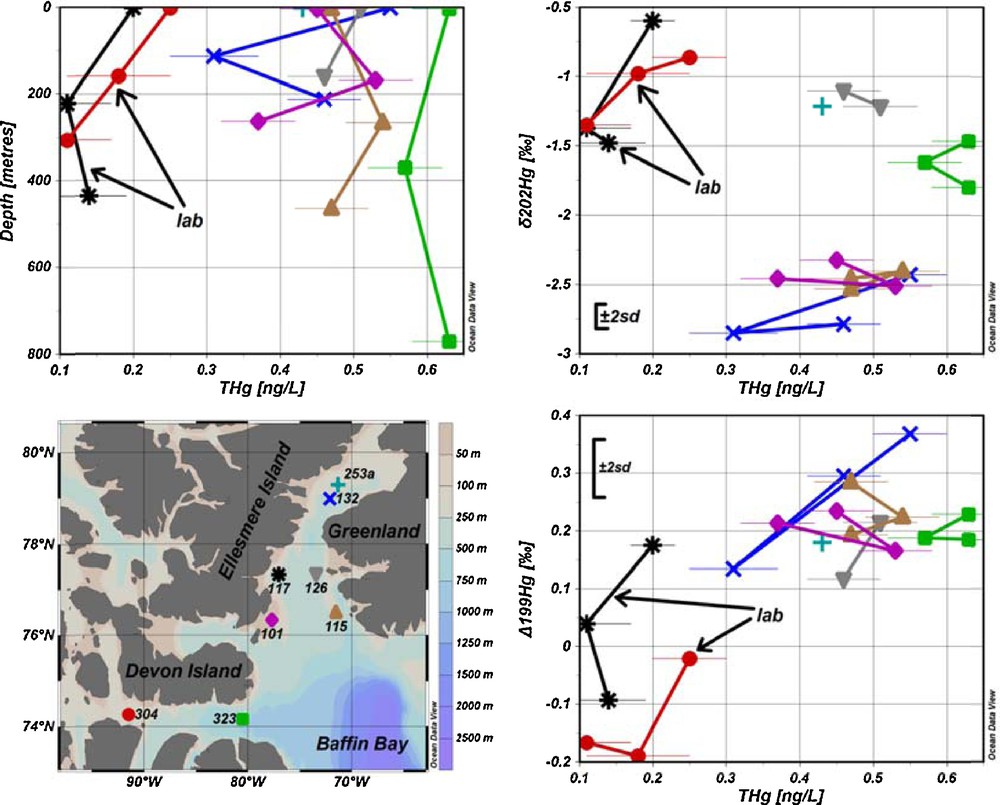
(Color online.) Seawater sampling sites and results for total Hg concentrations (THg) versus depth, δ202Hg and Δ199Hg with ± 2SD of the UM-Almadén reference solution. Results acquired from samples pre-concentrated in the laboratory are identified by arrows.
The second objective was constrained by the pre-defined route of the ArcticNet 2013 expedition in Baffin Bay and the Canadian Arctic Archipelago (CAA). Most of the sampling locations lie between Ellesmere Island and Greenland, covering the water exchange via Nares Strait, whereas two sampling locations (304 and 324) lie in the Lancaster Sound (Fig. 1). The spatial variation of Hg isotope ratios in these locations was thus investigated. The sampling locations 101 and 117 were close to Ellesmere Island, where average net flow is towards the Atlantic Ocean, whereas locations 115 and 126 were close to Greenland with average net flow towards the Arctic Ocean (Dickson et al., 2008). It was expected that possible variations in Hg isotope ratios between those stations could reflect different flow directions and consequently different sources of water and possibly different Hg isotopic signatures at those stations. The sample at the station 253a was collected close to a large floating ice island, which was once part of the Petermann glacier, with the aim to collect meltwater and to seek possible differences in Hg isotope ratios between glacier meltwater and seawater. Seawater was sampled at the top, mid and bottom of the water column. Less saline water is transported from the Arctic Ocean into the top layers, whereas bottom layers could show some influence of Hg remobilization from bottom sediments. In addition, photochemical reactions, which play an important role in Hg processes in the CAA (Kirk et al., 2008, 2012) are limited to the top water layers. Differences in Hg isotope ratios between the top, mid and bottom samples were therefore expected.
2 Experimental
2.1 Materials and reagents
Milli-Q deionized water (Millipore, 18 MΩ·cm) was used for the experimental work. Unless noted otherwise, the reagents were of reagent-grade quality and were tested before use to produce acceptable Hg blank values. Hg was pre-concentrated using 200–400 mesh Biorad AG 1-X4 anion exchange resins. Diluted HNO3 (4 M) and HCl (0.1 M) were prepared from concentrated HNO3 and HCl (J.T. Baker). To digest the organic compounds present in the water samples, a BrCl solution (0.2 M) was prepared with concentrated HCl, KBr (Aldrich), and KBrO3 (Aldrich), which were previously heated overnight at 250 °C to remove any Hg present. A 20% (w/v) solution of NH2OH·HCl (Aldrich) was prepared for the neutralization of BrCl in water samples and 0.05% (w/v) l-cysteine (Aldrich) in 1% (w/v) reagent-grade sodium citrate dihydrate (BDH) was used to elute Hg. Solutions of 20% (w/v) SnCl2 (Aldrich) in 10% (v/v) HCl were prepared for Hg reduction in the measurement of total Hg and 3% (w/v) SnCl2 in 10% (v/v) HCl for measuring Hg isotope ratios. SnCl2 solutions were purged overnight with Hg-free nitrogen in order to remove Hg.
A NIST 3133 Hg solution was used as delta-0 standard to which sample Hg isotope ratios were compared. An UM-Almadén Hg secondary standard solution was used as the reference material.
Hg pre-concentration columns were constructed from 7/16 inch (11.1 mm) fluorinated ethylene propylene (FEP) tubing with appropriate compression fittings (Cole Parmer) and 11 mm glass frits. Approximately 21 cm of FEP tube was cut and a glass frit was inserted from one side. The glass frit was retained in the tube with fittings used to connect the column to a variable adjustable flow peristaltic pump (Thermo Scientific FH100). Glass carboys (11 L) and glass vials with Teflon-lined caps were used for storage of water and pre-concentrated samples. Seawater samples were collected using Teflon-lined Niskin bottles mounted on a rosette carousel (General Oceanics). The figures in the paper were generated using Ocean Data View software (Schlitzer, 2013).
2.2 Cleaning procedures
All glassware coming into contact with samples, as well as pre-concentration columns, were initially cleaned overnight by submerging in or filling with a solution of 10% (v/v) HCl and 5 mL/L of 0.2 M BrCl, followed by rinsing with deionized water. Niskin bottles were cleaned before sampling by filling with 10% (v/v) HNO3 overnight and rinsed with deionized water. To reduce the Hg content in the resin, approximately 5 g of the anion exchange resin were suspended in 40 mL of 4 M HNO3 and left to settle. Then, the solution was decanted, an additional 40 mL of 4 M HNO3 added and the resins were again suspended in the solution and left to settle. This procedure was repeated two more times and finally the resins were left overnight in 40 mL of 4 M HNO3 prior to packing into columns. An aliquot (1.5 mL) of pre-cleaned resin slurry was packed in the column, followed by rinsing of resins with 40 mL of 4 M HNO3, 80 mL of H2O and finally conditioned with 80 mL of 0.1 M HCl, at a flow rate of approximately 2.5 L/h. The packed columns were then sealed on both sides with two layers of parafilm and packed into glass jars until sample pre-concentration onboard the research vessel.
2.3 Sampling of seawater
Seawater samples were collected in the CAA at sites indicated in Fig. 1 in August 2013 on board the Canadian research icebreaker CCGS Amundsen. Three samples were collected at each site, at the top, middle and bottom depth of the water column using Niskin bottles. Water samples were transferred into glass carboys and stored at 4 °C in the dark until processing and pre-concentration. Detailed information on sampling depths, coordinates and sampling time are presented in Table S1.
2.4 Hg pre-concentration from seawater samples
The Hg pre-concentration procedure from seawater samples was adapted from Štrok et al. (2014). Seawater samples were filtered through 0.45 μm cellulose ester filters immediately after collection and concentrated HNO3 (10 mL per 1 L of sample) was added to each sample (22 L) and thoroughly shaken. The samples were then purged for 8 h with Hg-free nitrogen to remove iodine. Afterwards, concentrated HCl was added to establish a 0.1 M concentration, 0.2 M BrCl (5 mL per 1 L of sample) was added, and the sample was left for at least 12 h to digest organically bound Hg. After digestion, an aliquot was taken for total Hg content determination. Then, BrCl in the samples was neutralized by the addition of 0.5 mL of 20% NH2OH·HCl per 1 L of sample. Finally, Hg was pre-concentrated by passing the sample (22 L) through the anion exchange column at a flow rate of approximately 2.5 L/h. After Hg pre-concentration, the column was sealed on both sides with two layers of parafilm, stored in an airtight glass jar and shipped back to the laboratory for analysis. The sample matrix was removed by reconnecting the columns to the peristaltic pump and first passing 40 mL of 0.1 M HCl, followed by 80 mL of H2O. The column was disconnected from the peristaltic pump and Hg was finally eluted with 10 mL of 0.05% l-cysteine in 1% sodium citrate dihydrate under free flow conditions. After elution, l-cysteine was destroyed with the addition of 2 mL of 0.2 M BrCl. An aliquot was taken from the pre-concentrated sample for Hg determination to allow concentration matching with the NIST 3133 bracketing standard and to check chemical recovery. Prior to the analysis of total Hg or Hg isotope ratios, BrCl in the samples was destroyed by addition of an appropriate amount of 20% NH2OH·HCl. Samples from two stations (117 and 304) were not processed on board the research vessel. Instead, they were stored in glass carboys at 4 °C in the dark, until the ship returned back to the base, from where they were shipped back to the laboratory and processed using the procedure described above.
2.5 Measurements
Determinations of total Hg concentrations were performed using a Tekran 2600 cold vapor atomic fluorescence spectrometer equipped with an autosampler with in-vial sparging configuration according to the US EPA Method 1631 (US EPA, 2002). In-vial Hg reduction was achieved by the addition of 30 μL of 20% (w/v) SnCl2 and pre-concentration on dual gold traps. The Tekran 2600 instrument was calibrated using certified Hg solutions and the detection limit for total Hg was 0.1 ng/L, with an ongoing precision of 3%.
Measurements of Hg isotope ratios were performed on a Thermo-Finnigan Neptune MC-ICP-MS as described by Chen et al. (2010) and Foucher and Hintelmann (2006). Hg in pre-concentrated samples was reduced in a cold vapor system using SnCl2, and Hg vapors were stripped with Ar and mixed with Tl aerosols generated with an APEX desolvation unit and finally introduced into the plasma of the MC-ICP-MS. Hg concentrations in samples were closely matched to that of NIST 3133 Hg reference solution. Three samples were measured in sequence, bracketed with one measurement of NIST 3133 Hg reference solution. In addition, a secondary standard solution of UM-Almadén was measured regularly, to check the system's performance and reproducibility. The results were corrected for instrumental mass bias using Tl standard. The results for Hg isotope ratios are reported as:
The mass-independent fractionation was calculated according to the formula:
where f is the scale factor of the theoretical mass-dependent fractionation law (0.252 for 199Hg, 0.503 for 200Hg and 0.752 for 201Hg).
2.6 QA/QC procedures
Total Hg travel blanks were determined by filling 40 mL vials with deionized water in the lab and digestion with BrCl prior to departure. These blanks were kept together with vials containing samples during the entire sampling campaign. One blank solution was analyzed prior to the sampling campaign for the initial value of Hg in travel blanks. BrCl working solutions used for the digestion of organically bound Hg were prepared on board the research vessel as needed from individual stocks to minimize the risks of contamination. Each time, 1 mL of BrCl solution was taken and added to the 40 mL vial filled with deionized water from the laboratory to check possible contamination of BrCl. In addition, 1 mL of prepared BrCl solution was added to the deionized water prepared onboard, which was used for rinsing of carboys, Niskin bottles and other equipment to check the water quality. As a blank for samples that were shipped back and pre-concentrated in the laboratory, one carboy was filled with deionized water prepared on board and shipped back together with other seawater samples containing carboys. Possible contamination of the columns packed with cleaned resins for Hg pre-concentration was checked from one blank column packed with cleaned resin per glass jar. Two columns were not used for sampling and Hg was eluted from them after return to the laboratory. For the convenience, these results were used for additional check of resin blank.
The results of all blanks are presented in Table S2. The results show that Hg concentrations in BrCl reagent blanks are similar to the travel blank, suggesting that the BrCl reagent used in the field was not contaminated during travel. In addition, the deionized milli-Q water used on the ship was of acceptable quality, and procedures used on the ship for cleaning of carboys were suitable. Two of the resin travel blanks contained almost ten times more Hg than the resin blank recorded before sampling, but it represents only 3% of the total mass of Hg collected on resins from samples (approximately 11 ng). In the worst-case scenario, where the Hg isotope ratios in the blank would be the most different from the observations in the samples, taking into account natural variability (Hintelmann and Zheng, 2012), it would cause a shift of 0.1‰ towards more negative values for the most positive δ202Hg and towards more positive value for the most negative δ202Hg value determined in this study. Since this is in the range of the method's precision, it was considered that it had negligible effect on Hg isotope ratio determinations. One resin field blank and two unused columns contained similar masses of Hg as those measured for the resin blank.
Performance as well as precision of Hg isotope ratio determination was determined by regular measurements of secondary UM-Almadén standard solution (Table S3) and was found to be consistent with previously published values (Blum and Bergquist, 2007; Chen et al., 2010; Demers et al., 2013; Rolison et al., 2013). The uncertainties provided in this paper represent the precision of the analytical method and are expressed as 2SD of nine measurements of secondary UM-Almadén standard solution. However, in the absence of sample duplicates, the uncertainty associated with the analysis of replicate samples could not be adequately assessed, but should be done in further studies.
3 Results and discussion
3.1 Total Hg concentrations in seawater
Total Hg concentrations determined from the sample aliquots taken on the ship were 0.9–3.9 ng/L with a mean value of 1.4 ng/L and higher than determined in the past for this area [0.14–2.08 ng/L with a mean value of 0.42 ng/L (Kirk et al., 2008)]. This is most probably due to contamination of the small (30 mL) seawater sample aliquots, which were stored differently (but inappropriately) from the large volume (11 L) samples used for the Hg pre-concentration and subsequent Hg isotope ratio measurements. The aliquots (approximately 30 mL) for total Hg determination were collected in 40-mL vials and were digested with BrCl. BrCl was however not neutralized with NH2OH·HCl. This might have caused contamination of the samples with Hg present in the headspace. At such small volumes of the aliquots, less than 0.03 ng of Hg would be enough to produce such high values. The contamination could be avoided by having larger sample aliquots volumes for total Hg determination, filling the sampling bottles to the top and neutralizing the BrCl by the addition of NH2OH·HCl. For instance, if the sample aliquots were to be collected in 1-L bottles, the same amount of Hg, which contaminated the sample aliquots in 40-mL vials, would change total Hg concentration by less than measurement uncertainty at 0.49 ng/L. However, we succeeded in reconstructing the total Hg concentrations in seawater from the large volume samples pre-concentrated in the laboratory by taking into account the volume of the sample and the average chemical recovery that was determined from samples pre-concentrated in the laboratory. Total Hg concentrations for seawater samples were then calculated by dividing the mass of Hg pre-concentrated on board by the total sample volume, corrected for the average chemical recovery (97 ± 5%), which was obtained for the samples pre-concentrated in the laboratory from stations 117 and 304. The reconstructed total Hg concentrations for samples pre-concentrated on the ship were 0.31–0.63 ng/L, with a mean value of 0.49 ng/L (Fig. 1 and Table S3), which is in agreement with previous determinations (Kirk et al., 2008).
For most of the sampling sites, there was no significant variation of total Hg concentration with depth (sites 115, 126 and 323 in Fig. 1). A minimum value was found at mid-depth in the water column at site 132, whereas the opposite was found at site 101. These results suggest that there is little variation and no consistent pattern of total Hg concentration with depth.
The samples that were pre-concentrated in the laboratory had substantially lower total Hg concentrations (0.11–0.25 ng/L with mean value of 0.17 ng/L) compared to those pre-concentrated onboard (Fig. 1 and Table S3). Since coagulated organic matter was visible at the bottom of the carboy for samples that were pre-concentrated in the laboratory, it is plausible that Hg(II) in water was reduced by organic matter during shipment and storage (2 months), and subsequently lost as Hg(0) during the filtration step. This hypothesis is further supported by the Hg isotope ratio measurement (Fig. 1 and 2), where samples pre-concentrated in the laboratory show δ202Hg shifts towards more positive values and Δ199Hg shifts towards more negative values. Assuming that average in situ δ202Hg and total Hg values were not statistically different for both sets of samples that were either pre-concentrated on the ship or in the laboratory, we can calculate the fractionation factor required to shift average δ202Hg and total Hg values from (–2.08‰, 0.49 ng/L) for on-ship processed samples to (–1.10‰, 01.7 ng/L) for lab-processed samples and compare it to fractionation factors reported for abiotic Hg reduction by dissolved organic matter (DOM). Calculated average fractionation factors were –1.49 ± 0.12‰ for δ202Hg, which is similar to those obtained experimentally for abiotic Hg reduction by DOM (–1.52 ± 0.06‰ for δ202Hg (Zheng and Hintelmann, 2010)). This is further supported by the plot of a Rayleigh fractionation diagram using average δ202Hg (–2.08‰) and total Hg concentrations (0.49 ng/L) from the samples pre-concentrated on the ship as a starting point and using a fractionation factor of –1.52 ± 0.06‰, determined by Zheng and Hintelmann (2010). The average δ202Hg value for samples pre-concentrated in the laboratory, after Hg reduction by organic matter during storage and shipment, lies within the 2SD of the Rayleigh fractionation process (Fig. 3). In Fig. 3, modeled δ202Hg correspond to the residual Hg(II) fraction. In addition, the average Δ199Hg difference between samples pre-concentrated in the laboratory and those onboard is –0.26 ± 0.30‰, which is in agreement with the predicted maximum value for abiotic dark reduction in natural systems [–0.3‰ (Hintelmann and Zheng, 2012)]. These results show that the presence of organic matter can alter both total Hg concentration and Hg isotope ratios, and that it is advisable to filter and acidify samples that require prolonged storage. Previously reported kinetics of the abiotic Hg(II) reduction by DOM demonstrated that equilibrium was almost established after 40 days (Zheng and Hintelmann, 2010). Therefore, it can be reasonably concluded that the samples from sites 117 and 304, which were stored for approximately 60 days in the presence of DOM, reached equilibrium.
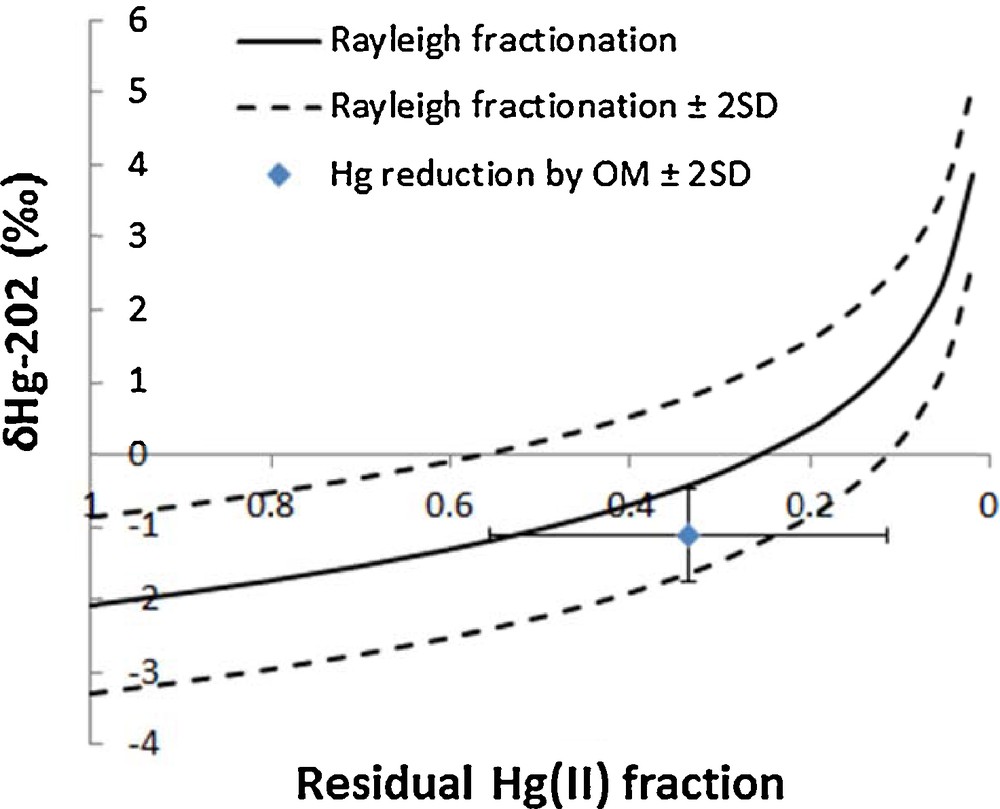
Theoretical Rayleigh fractionation using the derived fractionation factor for abiotic Hg reduction by organic matter from Zheng and Hintelmann (2010) and average δ202Hg of samples that underwent Hg reduction by organic matter during storage and shipment. The modeled δ202Hg is the residual Hg(II) fraction.
3.2 Mass-dependent fractionation of Hg in seawater
The mass-dependent fractionation of Hg in seawater is presented in Figs. 1 and 2 and in Table S3. It is evident from Fig. 2 that samples from sites 117 and 304, which were pre-concentrated in the laboratory, are shifted towards more positive δ202Hg values, as discussed earlier. However, taking into account fractionation factors for abiotic Hg reduction by DOM, these results are in the range obtained for samples processed on the ship.
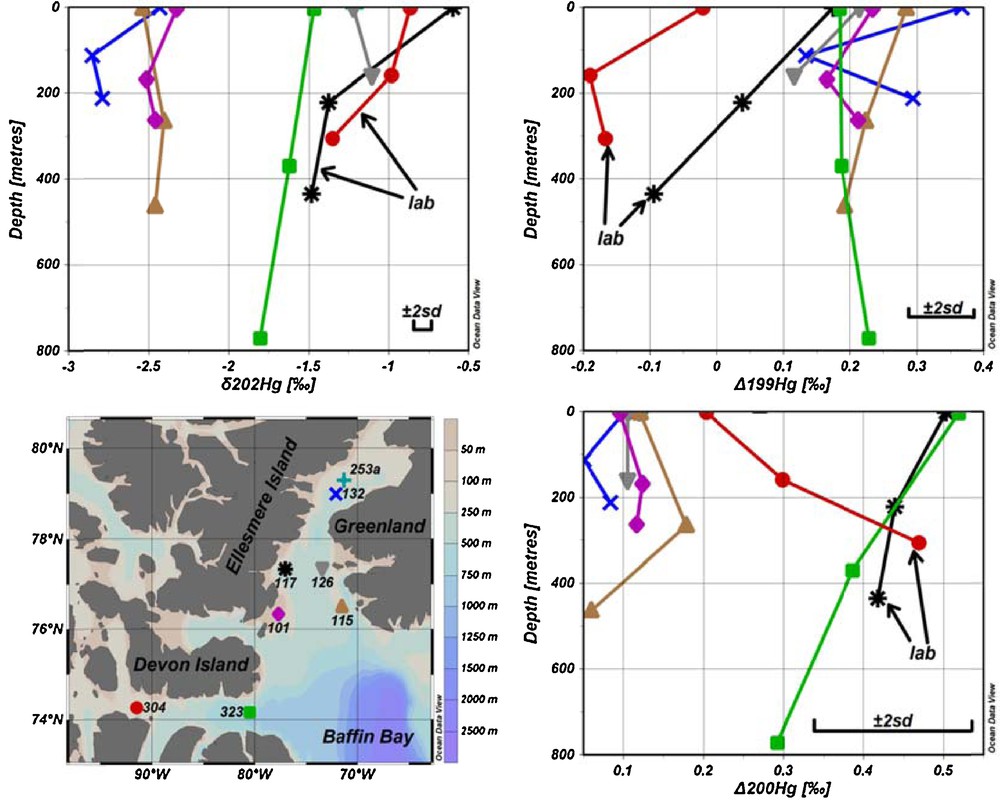
(Color online.) Seawater sampling sites and results for δ202Hg, Δ199Hg and Δ200Hg versus depth. Error bars represent the 2SD measured for the UM-Almadén reference solution. Results acquired from samples pre-concentrated in the laboratory are identified by arrows.
Annual Hg budgets in the high Arctic (70°–90°N) for the surface ocean mixed layer were recently modeled by Fisher et al. (2012) using the GEOS-Chem model. It was reported that the biggest annual inputs of Hg(II) to the subsurface ocean mixed layer in the Arctic Ocean are river discharge and erosion (95 Mg/a), followed by the atmospheric deposition to open ocean (25 Mg/a) and meltwater from snow on land and sea ice (20 Mg/a). The biggest annual outputs from the ocean mixed layer are Hg(0) evasion to the atmosphere (90 Mg/a), vertical transport of Hg(II) to subsurface waters by particle settling (43 Mg/a) and detrainment of Hg(II) to the subsurface waters (5 Mg/a).
Currently, our knowledge regarding the Hg isotope composition of river waters is limited to values reported by Chen et al. (2010) for two rivers from Southeast Canada with δ202Hg values ranging from 0.74 to –1.5‰. The major contributors of riverine discharge to the Arctic Ocean are the Russian rivers Yenisei, Lena, Ob, Pechora, Dvina and Kolyma (accounting for more than 90% of discharge) and the North American rivers Mackenzie and Yukon (Fisher et al., 2012). In the absence of Hg isotope composition data of rivers discharging into the Arctic Ocean or CAA, the best estimate for this source may be the Hg isotope composition of geological materials with δ202Hg ranging from 1 to –3‰ (Hintelmann and Zheng, 2012; Stetson et al., 2009).
The Hg isotope composition of the atmospheric deposition to open ocean was assumed to have values similar to those reported for precipitation by Chen et al. (2012) for Peterborough, Canada or Sherman et al. (2010) for Barrow, Alaska. Although the Hg isotope compositions for precipitation are from lower latitudes than in our study, some rain events in the Chen et al. study were backtracked to originate from CAA and had δ202Hg values from –0.02 to –1.48‰. Sherman et al. (2010) reported Hg isotope composition in snowfall and snow during atmospheric mercury depletion event (AMDE) with δ202Hg values from 0.57 to –0.49‰. Therefore, the Hg isotope composition of the atmospheric deposition to open ocean was expected to have values in the range from 0.57 to –1.48‰. As a reasonable estimate of meltwater Hg isotope composition from snow on land, the δ202Hg value for Greenland snow derived by Chen et al. (2012) may be used (δ202Hg of –1.35‰). There are no data available for sea ice.
Evasion of 90 Mg/a of Hg(0) would require (photo)reduction of Hg(II) to Hg(0) and to a smaller extent from photodegradation of monomethylmercury (MMHg). Fractionation factors of ɛ = –0.55 to –1.71 for photochemical reduction of Hg(II) and ɛ = –0.47 ± 0.04 for volatilization of Hg(0) have been previously determined for these processes (Bergquist and Blum, 2007; Hintelmann and Zheng, 2012; Zheng and Hintelmann, 2010; Zheng et al., 2007), suggesting that surface water samples would have more positive δ202Hg values compared to deeper ones. The formation and evasion of Hg(0) in CAA surface waters during summer are further supported by Kirk et al. (2012), who found that marine waters in the CAA are an important source of Hg(0) to the atmosphere with average fluxes being higher than in the North Atlantic, Mediterranean and Baltic Seas. This is most probably due to build-up of Hg(0) under ice cover during winter (Kirk et al., 2012) followed by long periods of solar radiation during summer at high latitudes, which promotes photoreduction and photodegradation of Hg(II) and MMHg.
The results for δ202Hg from stations 101, 132 and 323 follow these expectations showing more positive values at the surface and more negative values in deeper layers of the water column (Fig. 2 and Table S3). The results from stations 115 and 126 however, do not show higher δ202Hg values in surface waters. The different Hg isotopic composition could be explained by the different origin of water in deeper layers at these stations, most probably from the North Atlantic, and carrying slightly different Hg isotope signature than surface waters. For example, salinity and temperature in deeper layers were higher, which is characteristic of Atlantic waters in the northbound West Greenland Current (Melling et al., 2001) and Irminger current (Myers et al., 2007), at these stations compared to other stations (Figs. S1 and S2). As well, Dickson et al. (2008) indicate that the average annual subsurface flow of the water along the Greenland coast is towards the Arctic Ocean.
The isotope composition of Hg that is transported from the surface to subsurface water and further to the sediments via adsorption to particles and subsequent settling is unknown. The average δ202Hg values of surface water samples collected at stations, where onboard pre-concentration was possible, is–1.87 ± 0.63‰, which is within the range of values expected for riverine input (1 to–3‰), whereas atmospheric deposition (–0.02 to –1.48‰) and snow melt (–1.35‰) show slightly higher values. Since evasion of Hg(0) would result in enrichment of heavier isotopes and consequently in more positive δ202Hg values compared to those sources, we speculate that removal of Hg(II) by particle settling to the sediment should enrich lighter isotopes in seawater to counterbalance this process. The average δ202Hg value for the subsurface samples pre-concentrated onboard is slightly more negative (–2.24 ± 0.58‰) than values found in surface waters, which is explained by the absence of (photo)reduction and volatilization processes at deeper depths. As well, δ202Hg values in top sediment layers from CAA (–0.76 ± 0.14‰, unpublished data) are more positive, which would further support the idea of preferential scavenging of heavy isotopes on particles.
3.3 Mass-independent fractionation of odd Hg isotopes in seawater
All Δ199Hg values, except for stations 117 and 304, which were subjected to Hg loss and Hg fractionation during storage, fall within a relatively narrow range between 0.1 and 0.4‰ (Figs. 1 and 2 and Table S3). Positive mass-independent fractionation for odd isotopes is most probably caused by photoreduction of Hg(II) to Hg(0) followed by evasion to the atmosphere (Bergquist and Blum, 2007; Zheng and Hintelmann, 2009), which is mostly attributed to the positive magnetic isotope effect (Hintelmann and Zheng, 2012). Sherman et al. (2010) reported relatively large negative Δ199Hg values for AMDE (from –0.95 to–5.08‰) for snowfall and snow. Since the values for Δ199Hg found in seawater are all positive, the contribution of Hg from AMDE to the seawater seems insignificant. For most of the stations (101, 115, 126 and 323), no significant difference of Δ199Hg was observed with depth, at least within the method precision. At station 132, a minimum value was observed at mid-depth in the water column, whereas top and bottom samples showed comparable Δ199Hg values. Taking into account the narrow range of mass-independent fractionation and considering that most samples did not show differences with depth, it was concluded that depth-related processes, which may alter Δ199Hg values, are not present or not detectable taking into account the method's precision.
3.4 Mass-independent fractionation of 200Hg
Significant mass-independent fractionation of 200Hg isotope was observed at sites 101, 115 and 323 as shown in Figs. 1 and 2 and Table S3. Average Δ200Hg values of surface water samples from all sites (0.18‰) are almost identical to subsurface samples (0.16‰). Taking into account measurement uncertainties, there are no significant variations in Δ200Hg values with depth. There is a correlation (r2 = 0.52, P = 0.002) between total Hg and Δ200Hg values, as indicated in Fig. 4. Furthermore, the sites could be grouped into two pools, one having Δ200Hg values between 0.3 and 0.5‰ and others between 0.1 and 0.2‰. But neither of these pools shows any particular spatial pattern or hydrographic correlation. Currently, the mechanisms that could cause mass-independent fractionation of even isotopes are still unclear. Although neither current theoretical models nor laboratory experiments were able to generate mass-independent fractionation of even isotopes, the phenomenon has been described in several studies, and was so far mainly observed in precipitation (Chen et al., 2012; Demers et al., 2013; Gratz et al., 2010; Rolison et al., 2013; Wang et al., 2015). This study is the second report (after Štrok et al., 2014) of the presence of significant even mass isotope anomalies in seawater. However, Sherman et al. (2010) did not find Δ200Hg anomalies in precipitation during AMDE, supporting the insignificance of AMDE as a source of Hg to seawater as discussed previously. Chen et al. (2012) suggested a conceptual model, where 200Hg fractionation occurs in the tropopause layer of the atmosphere during oxidation of Hg(0) to Hg(II) by ozone or hydroxyl and halogen radicals under intense sunlight irradiation. If this were correct and oxidation of Hg(0) were the only mechanism responsible for even mass-independent fractionation, then only Hg subjected to specific atmospheric conditions would show even mass-independent fractionation and the magnitude of Δ200Hg fractionation would be proportional to the amount of Hg that underwent atmospheric transformation, as described by Chen et al. (2012). If this concept holds, the measurement of Δ200Hg anomalies would be a powerful tracer to distinguish between Hg entering from the atmosphere by dry and wet deposition and Hg originating from other sources.
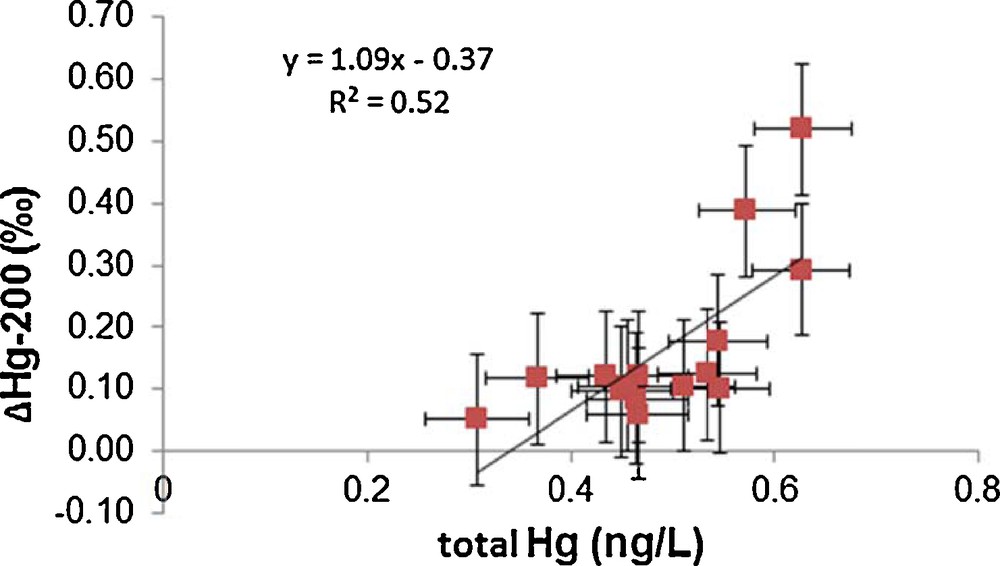
Correlation of total Hg and Δ200Hg for seawater samples pre-concentrated on board the ship immediately after sampling.
Chen et al. (2012) were able to identify two distinct patterns of Δ200Hg anomalies in precipitation samples from Peterborough, Canada. The precipitation, which occurred at temperatures below 0 °C and with air mass back trajectories originating from the CAA, had the highest Δ200Hg values (1.18 to 1.24‰), whereas precipitation originating from southwest or west with temperatures above 0 °C had values from 0.22 to 0.57‰. Consequently, it could be speculated that Δ200Hg values varies with the latitude and/or temperature of origin of the precipitation. In addition, Greenland snow had a Δ200Hg value of 0.91‰ (Chen et al., 2012). Taking into account the annual Hg budget for the high Arctic by Fisher et al. (2012) and assuming that riverine and erosion inputs have Δ200Hg value of 0‰, the simple mixing model of two distinct precipitation patterns identified by Chen et al. (2012) give us predicted Δ200Hg values of 0.5‰ for precipitation originating from CAA and 0.2‰ for precipitation originating from southwestern Peterborough, Canada. Sampling sites in our study can be roughly grouped into two pools (see Fig. 2), one having Δ200Hg values between 0.3 and 0.5‰ and others between 0.1 and 0.2‰, indicating a different origin of the majority of the precipitation contributing to them.
If we assumed constant Δ200Hg values for the precipitation in the CAA of around 1.2‰, differences in seawater Δ200Hg could provide an estimate for the riverine and erosion Hg flux to the water column at a specific station. Sites having Δ200Hg values between 0.3 and 0.5‰ would need to receive approximately 50% of their total Hg input from riverine and erosion sources, whereas those with values between 0.1 and 0.2‰ would require approximately 80% of the Hg to originate from rivers and erosion.
These estimates are based on assumptions that require further testing and are therefore subject to large uncertainties. Unfortunately, data sets for specific compartments contributing to the overall Hg pool are either scarce or non-existing. In addition, Hg isotope composition in deeper layers might be reflecting precipitation patterns from the Atlantic Ocean or from many years ago, making conclusions at this point very difficult.
Acknowledgments
The authors acknowledge funding from ArcticNet for the sampling campaign and are grateful to ArcticNet members and the CCGS Amundsen crews and captains for their help during the sampling. The financial support from the Ontario Postdoctoral Fellowship Program to MS is highly appreciated.