

1 Introduction
Nitrogen concentrations in the atmosphere and hydrosphere have been increased by human activities in recent decades (Galloway et al., 2004; Harker et al., 2015; Vitousek et al., 1997). One major source of nitrogen is the burning of fossil fuels, which releases nitrogen compounds such as nitric oxides (NOx), nitrous oxides (N2O) and ammoniac (NH3) into the atmosphere. Waste from sewage also contributes to the increase of nitrogen in water. Furthermore, one of the main sources of nitrates is the input of nitrogen fertilisers and animal manure in soil in order to enhance crop yields. Cultivated plants only absorb half the fertilisers being spread (FAO, 2001), therefore nitrates are transported in large quantities to surface water and groundwater and, finally, to the rivers through surface runoff, soil leaching and soil erosion (Kattan et al., 1986; Mariotti and Létolle, 1977; Probst, 1985). The change in the nitrogen cycle leads to the eutrophication of aquatic ecosystems and the acidification of soil (Brunet et al., 2011; Hastings et al., 2009; Perrin et al., 2008; Semhi et al., 2000; Vitousek et al., 1997).
Controlling nitrate concentration in stream water is essential in agricultural areas in order to limit the surface water and ground water pollution. Acquiring knowledge of the origin and pathway of nitrates is the first step in taking proper action.
The aim of this paper was to monitor nitrate concentration and its nitrogen isotopic composition during flood events to highlight their origin and transfer pathways and to enhance understanding of the controlling factors in a highly flood-responsive catchment.
This small agricultural catchment, Montoussé, located in the Southwest of France, is dominated by mineral fertilisers. It has been monitored since 1980 to control nitrogen flux and nitrate concentration, reduce nitrogen losses and improve water quality through the use of better agricultural practices. Research is currently being developed with farmers (“Groupement des agriculteurs de la Gascogne toulousaine”) in order to improve crop yields and reduce the effects of nitrate pollution. One of the main actions was to create grassed buffer strips along the river in 1995. Several studies (Mayer et al., 2007; Sebilo et al., 2006; Vidon and Hill, 2004) have highlighted that nitrate leaching can be reduced in the stream by creating grassed buffer strips between the cultivated fields and the creek.
Since 1985, nitrate concentrations have been measured weekly and since 2006 measured continuously (Ferrant et al., 2013) at the outlet of the watershed using an YSI multiparameter probe equipped with a nitrate sensor. Nitrate dynamics depend mainly on floods and droughts, leaching and retention processes and fertiliser application at the small catchment scale. The hydrochemical conditions at the Montoussé catchment are mainly controlled by floods. The concentration as well as the flux of pollutants such as nitrate and pesticides is higher during floods events and they are mainly leached by subsurface run-off in this catchment (Idir et al., 1999; Taghavi et al., 2010).
The water contributions during floods are very important because of the different water origin and the addition of various nutrients from different part of the catchment, such as nitrate (Buda and DeWalle, 2009).
The origin of nitrate pollution can be determined by analysing the isotopic composition of nitrogen (Heaton, 1986; Kendall, 1998). Indeed, the source, climatic events and physical and chemical processes change the isotopic ratio of nitrogen and oxygen. In this study, it was decided to analyse only nitrogen isotopes. δ15N is a good discriminator for assessing the principal origin and main processes in a small agricultural catchment. Table 1 provides a summary of the δ15N values of different sources of nitrogen in the environment. In surface water, δ15N–NO3– is comprised of between +4 and +7‰ for unpolluted rivers and between +6 and +12 ‰ when stream water is contaminated by fertiliser (Cravotta, 1984; Fogg et al., 1998; Xue et al., 2009). δ15N–NO3– of nitrate derived from animal manure and sewage is typically higher (Kendall et al., 2007). The nitrogen isotopic signature varies with the source of the nitrate, but the isotopic signature also changes when the nitrate is involved in chemical reactions. Nitrification and denitrification are the two main processes that fractionate the most. Nitrification reaction generates fractionation from –29 to –12‰. In contrast, the denitrification process leads to high 15N-enrichment in the residual nitrate. Fractionation of the total denitrification (NO3– > N2) is very significant, ranging from –40 to–5 ‰ (Kendall, 1998). Therefore, the range of values of δ15N is an indicator of the different processes (Kellman and Hillaire-Marcel, 2003; Mariotti et al., 1981; Sebilo et al., 2006).
Range of values of δ15N for different nitrogen sources.
| Nitrogen source | δ15N (‰) | References |
| Soil organic nitrogen | +4 to +9 | Heaton, 1986; Kendall, 1998 |
| Total soil nitrogen | –10 to –15 | Kendall, 1998 |
| Fertilisers | –4 to +4 | Heaton, 1986; Fogg et al., 1998; Kendall, 1998 |
| Manure | –10 to +20 | Cravotta, 1984; Fogg et al., 1998; Kendall, 1998 |
| Rain | –6 to +2 | Heaton, 1986; Freyer, 1991; Russell et al., 1998; Hastings et al., 2009, Xue et al., 2009 |
| Sewage waste | >+10 | Heaton, 1986; Cravotta, 1984; Fogg et al., 1998; Kendall, 1998 |
| Vehicles (NOx) | –13 to–2 | Heaton, 1990 |
| Coal fire NOx | +6 to +13 | Heaton, 1990 |
| Atmospheric nitrogen | 0 | Heaton, 1990; Freyer, 1991 |
| Surface water contaminated by nitrates | +4 to +7 | Cravotta, 1984; Fogg et al., 1998; Xue et al., 2009 |
| Surface water not contaminated by nitrates | +6 to +12 | Cravotta, 1984; Fogg et al., 1998; Xue et al., 2009 |
The denitrification process occurs when anaerobic conditions are present (Kendall, 1998; Sebilo et al., 2003; Sebilo et al., 2006), there are enough denitrifying bacteria in the soil and there is a source of organic carbon to provide energy to the bacteria (Birgand et al., 2007). Grassed buffer strips allow the retention of nitrate and therefore trigger the denitrification process in low-oxygen environments (Galloway et al., 2004; Sebilo et al., 2006; Vidon and Hill, 2004). In the studied watershed, leaching of nitrate into the river should be limited by the grassed buffer strips.
Nitrate leaching and retention processes at catchment scale are not very well understood due to the various sources of nitrate, hydrological pathways and variations in hydroclimatic conditions (Billy et al., 2013). The main objective of this study was to determine the different factors affecting nitrate concentration during flood events in an agricultural watershed.
Thanks to a simple extraction method, δ15N of nitrate in the surface water was measured for three months from January to March 2013 at the outlet of the catchment and in other water springs around the watershed. The main origin and pathway of nitrates were determined by following the concentration and isotopic composition spatially and over time in the course of different hydrological events.
2 Materials and methods
2.1 Study area
The Montoussé river is located in the Gascogne region (southwestern France). It is a sub-tributary of the Save river, which is a tributary of the Garonne river. The Montoussé catchment drains an area of 328 hectares near the village of Auradé (Gers, France). It is an experimental agricultural catchment (Fig. 1), which belongs to the French Network of Drainage Basins (RBV, http://rnbv.ipgp.fr/). This is a multidisciplinary research network for monitoring rainwater, surface water and groundwater. This experimental catchment (http://www.ecolab.omp.eu/bvea/) is also a regional platform for research and innovation in Midi-Pyrénées (http://www.midipyrenees.fr/Guide-pratique-des-plates-formes-de-recherche-et-d-innovation) and part of the international Critical Zone Exploration Network (CZEN) (http://www.czen.org/; Banwart et al., 2012).
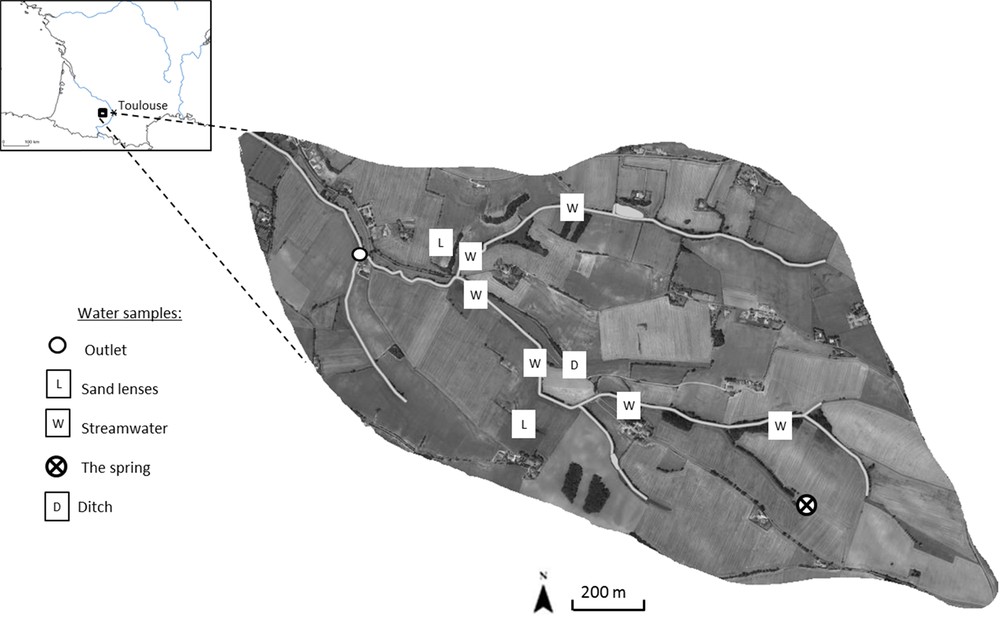
(Colour online.) The location of the Montoussé catchment and of the water sampled in the study area.
The crops are wheat and sunflower in rotation and farmers apply mineral fertilisers: mainly ammonium nitrate, sulphonitrate, potassium sulphate. Sulphonitrate is composed of (NH4)2SO4 (sulphate ammonium) and NH4NO3 (ammonium nitrate). It provides 8% of N–NO3–, 29% of N–NH3. Potassium chloride and urea are also applied in the catchment. It is generally around 50 kg N/ha but we are still computing the amount of fertilisers in the whole catchment using the values we get from the different agricultural parcels. For wheat, application of fertiliser generally occurs between mid-January and April. During the study period, ammonium nitrate and K fertilisers were applied on 15 and 18 January, 6 February and later at the end of February and in March. The bedrock of the study area is characterised by Miocene molassic deposits, called molasses. It is a mixture of sand, clay, silt and limestone sediments originating from the erosion of the Pyrenees Mountains. The calcareous soils, called Terrefort, are mainly composed of clay and limestone. The clays are mainly smectites, which have a high potential of water retention. The hill slopes are very steep and can reach up to 20%.
The climate is of an oceanic type. The nearby Atlantic Ocean plays an important role in regulating the temperature and precipitation regimes. Average annual precipitation is about 700 to 800 mm, which is the main hydrological source of water for surface and subsurface runoffs in this area. The highest discharges occur in February and major flood events occur in May, while the low water flow period is from June to September. The study period from January to March was chosen for the heavy rain events that induced high and rapid discharge at the outlet of the catchment. Secondly, because fertiliser was applied in January and February, Nitrogen leaching is high during this period. The average water evapotranspiration from the soil-vegetation system is very high and ranges between 500 and 600 mm. This leads to an annual mean discharge rate of 80–120 mm (Perrin et al., 2008; Taghavi et al., 2010), which corresponds to semi-arid climate conditions.
2.2 Sampling procedure
In order to determine nitrogen sources correctly in the Montoussé creek, hydrological and chemical monitoring was performed at the outlet of the watershed. Moreover, in order to enlarge the range of nitrate composition, other water springs and aquatic environments were sampled around the catchment (Fig. 1). Every week, surface water was manually sampled at the outlet to provide regular data on hydrochemical conditions. There were also two automatic samplers: the first (ISCO 3700 sampler) sampled water daily and the second (Ecotech sampler AWS2002) sampled water at a time step for a specific water level. The latter allowed accurate monitoring of floods when the water levels rose and fell. Four main floods of different intensity were sampled during the study period.
The spatial sampling mission was performed on 24 April 2013. The samples were chosen to represent different potential sources of nitrate in the catchment, upstream and downstream (Fig. 1). Three different sources were of interest: the spring in the catchment, the resurgence zone and sand lenses. Stream water was then collected from six small tributaries, from a ditch and from two sandy humid zones, as shown in Fig. 1. The coarse sand intercalated in the impermeable clay material may have been waterlogged. Electric conductivity (EM38) measurements and electric resistivity profiles undertaken by CESBIO researchers (unpublisehd data) on the watershed were used to determine the water-saturated zone. Upstream of the basin, water from the spring was also sampled. The discharge at the outlet was 12.5 L·s−1 during a three-week recession flow period. The water was sampled in a bottle rinsed three times with stream water. A hole was dug in the sand lenses, the ditch and the spring until the underground water filled the hole. The water in the hole was sampled in a bottle also rinsed three times. The hydrological conditions in April were the same as in March. The spatial sampling was performed more than one month after the flood survey, which provided a reference of the chemical conditions of the different sources of water when the water level was low.
2.3 Water chemical analyses
Discharge, conductance, pH and temperature were measured in situ using an YSI 6920 EDS multiparameter sensor immersed in the stream at the catchment outlet. Nitrate concentrations were also measured continuously (Ferrant et al., 2013) with the probe. These sensor measurements were regularly calibrated in the laboratory by comparing the nitrate sensor values with the nitrate concentrations analysed by ionic chromatography.
In the laboratory, water was filtered at 0.22 μm on acetate cellulose Millipore filters on the day of sampling. Nitrate and nitrite contents were analysed by high performance liquid ion-chromatography (HPLC Dionex Chromatograph ICS 2000) and the detection limit for nitrate was 1.09·10−3 μmol·L−1and 1.61·10−3 μmol·L−1 for nitrite. Other anions (SO42–and Cl–), and NH4+ were also analysed by HPLC. The nitrite and ammonium concentrations were generally under the detection limit. The major cations (Ca2+, Mg2+, Na+ and K+) were measured by an inductively coupled plasma-optical emission spectroscopy (ICP–OES) system (Iris Intrepid II XLD; Thermo Electron).
2.4 Nitrate extraction method
Nitrates in the water samples had to be separated from the dissolved organic nitrogen (DON) without any isotopic fractionation being generated in order to provide a correct value of δ15N.
The method selected in this study was based on the solubility difference between inorganic salts and a mixture of water, acetone and sodium hydroxide. This method is simple but original, because it allows organic matter to be removed from the solution (Huber et al., 2012) and, if necessary, allows an analysis of δ15N in DON.
An aliquot of 100 ml of filtered water (0.22 μm) was first freeze-dried and put in 50-mL vials. Then, 350 μL of NaOH (1 M, Merck) was added, as well as 20 mL of pure acetone (99.9%, Fisher), and then mixed together for a few minutes. Two parts formed in the vials. The supernatant part contained the nitrate dissolved in the acetone, and the precipitate contained the organic matter, the sulphates and the salts derived from the sodium hydroxide. The upper liquid was pipetted into other vials and evaporated in a water bath at 90 °C. δ15N of the dry residue was analysed directly with the mass spectrometer. This method separated the organic nitrogen from the inorganic form, but did not separate out the nitrate ion on its own. The yield of nitrate extraction tested by Huber et al. (2012) was up to 80% and no fractionation was noticed.
In order to assess the fractionation induced by this method, the protocol was applied to a reference salt KNO3 (Merck) of δ15N = –1.39 ± 0.67‰. The extraction was performed on 15 KNO3 solution samples containing 50 mg·L−1 of nitrate. After the extraction, it was found that δ15N = –0.41 ± 0.33‰. The method was validated and the small fractionation was neglected. The interference of the ammonium was neglected in this method because it volatilises in the ammoniac form during the freeze-drying and evaporation step (Huber et al., 2012) and the concentration found was below the detection limit.
2.5 Nitrogen isotope analyses
Nitrogen has two stable isotopes, 14N (the most abundant) and 15N. The difference in mass between them allows the isotopic ratio δ in per mil (‰) to be calculated:
δ‰ = [Rsample/Rstandard – 1] × 1000
where R = 15N/14N and Rstandard is the isotopic ratio of the international standard N2.
Isotopic analyses were performed at EcoLab (Toulouse) on the Shiva platform. The Isoprime 100 spectrometer was coupled in continuous flow using pure helium as the gas vector to an elemental analyser, Micro Vario, for solid combustion. A dual injector box introduced the reference gases (N2 and CO2). All samples were dried and reduced to powder before being placed in tin capsules (99.998%). The analytical precision was 0.2‰ based on KNO3 salt provided by IAEA (IAEA–NO3) and NH4NO3 (Merck).
3 Results
3.1 Hydrological variations
From 15 January to 20 March 2013, 46 water samples were analysed with a sampling frequency of one per week, plus high-resolution sampling during the four main flood events. The variations in the isotopic composition of N–NO3– and the chemical composition of the stream water were dependent on the hydrological events. The sampling was performed before the period of main fertiliser application.
The nitrate concentrations and discharge monitoring from 1985 to 2014 are shown in Fig. 2a. Flood events were more intense at the end of this period. The nitrate concentration and discharge of the study period (from January to March 2013) is enlarged in Fig. 2b.

Discharge and nitrate concentration at the outlet of the Montoussé catchment: a: from 1985 to 2014; b: from 9 January to 20 March 2013.
The study period was divided into six periods: four main flood events (I to IV) and two low water periods of transition (1 and 2; Fig. 2b).
The first flood (I) was registered from 15 to 18 January, a second flood (II) from 19 to 21 January. The maximum was on 20 January, with a peak discharge of 1688 L·s−1 (Fig. 2b). This flood was very sudden. Between 21 January and 5 February (low water period 1), some very small floods were registered, but the resolution was too low to be analysed. This period was considered to be a transition between flood events. Two other floods were registered in February, from 6 to 7 February (flood event III) and from 10 to 13 February (flood event IV), which were less significant than those in January. From 13 February to 20 March (Low water period 2), no flood events were registered. The water discharge was 18.4 L·s−1 at the end of March (Fig. 2b).
3.2 Concentration and isotopic variations of N–NO3–
The δ15N–NO3– values ranged from 5.3 to 11.0 ‰ and concentrations from 3.9 to 10.8 mg·L−1 N–NO3– (Fig. 3a and b).

δ15N–NO3– and N–NO3– concentrations at the outlet of the Montoussé catchment versus discharges during six periods: four flood events (I to IV, white dots) and two low water periods of transition (1 and 2, black dots): a: δ15N–NO3– (‰) versus discharge; b: N–NO3– concentration (mg·L−1) versus discharge. The highest discharge value registered at 1688 L·s−1 could not be illustrated in this figure, but the positions of the corresponding isotopic signature and concentration are represented by arrows on the right of each figure.
The results showed a global increase of δ15N–NO3– at the outlet of the catchment from the beginning of January to the end of March (Fig. 3b). The concentration of nitrate also followed the same trend (Fig. 2b; Fig. 3a).
During the first flood event (I), nitrates presented low concentrations and the lowest isotopic value in the study period. The highest δ15N–NO3– was correlated with the highest N–NO3– content during the second low water period (2). The biggest flood in January (II) lasted the least time, but the nitrate concentration and the δ15N–NO3– presented average values.
As seen in Fig. 3, when the discharges increased, both the isotopic compositions and the concentrations of N–NO3– decreased, following general negative logarithmic patterns.
3.3 Chloride and sulphate variations
Sulphate and chloride were two elements supplied in this catchment mainly by product of nitrate fertiliser application. Chloride concentration ranged from 16.8 to 82.5 mg·L−1 and sulphate concentration ranged from 6 to 29.4 mg·L−1.
The plotting of chloride versus sulphate concentrations yielded a linear relationship (Fig. 4b), clearly showing that these two anions had the same origin. The sum of chloride and sulphate concentrations (Fig. 4a) also increased when the nitrate concentration increased, but during flood events I and II they increased more rapidly than nitrate.
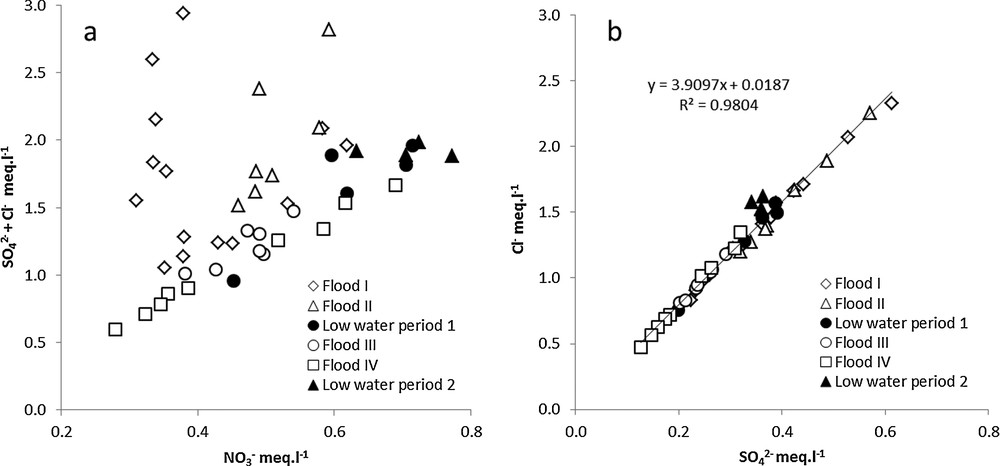
a: relationship between SO42– + Cl– concentration and N–NO3– concentration at the outlet of the watershed during the study period; b: relationship between Cl– and S-SO42–concentration. Black dots are low water periods (1 and 2) and white dots are flood events (I to IV).
The highest chloride and sulphate concentrations were found during the first floods (I and II) and the lowest concentrations were found during the last flood (IV) (Fig. 4a and b).
3.4 Relationships between N–NO3– concentration, δ15N–NO3– and discharge during the four flood events
As can be seen in Fig. 5, a hysteresis pattern with various shapes could be observed, indicating different water origins and hydrological behaviour during flood events. The general pattern showed that the N–NO3– concentration and its isotopic signature decreased when the discharge increased, except for the peak flow in flood event II. There were few differences between the rising period and the recession period, except for flood event I which exhibited hysteresis, anticlockwise for the concentration and clockwise for the isotopic composition. This means that, for the same discharge value, the concentration was higher during the rising period than during the recession. In contrast, δ15N–NO3– was higher during the rising limb than during the falling limb of the hydrograph.
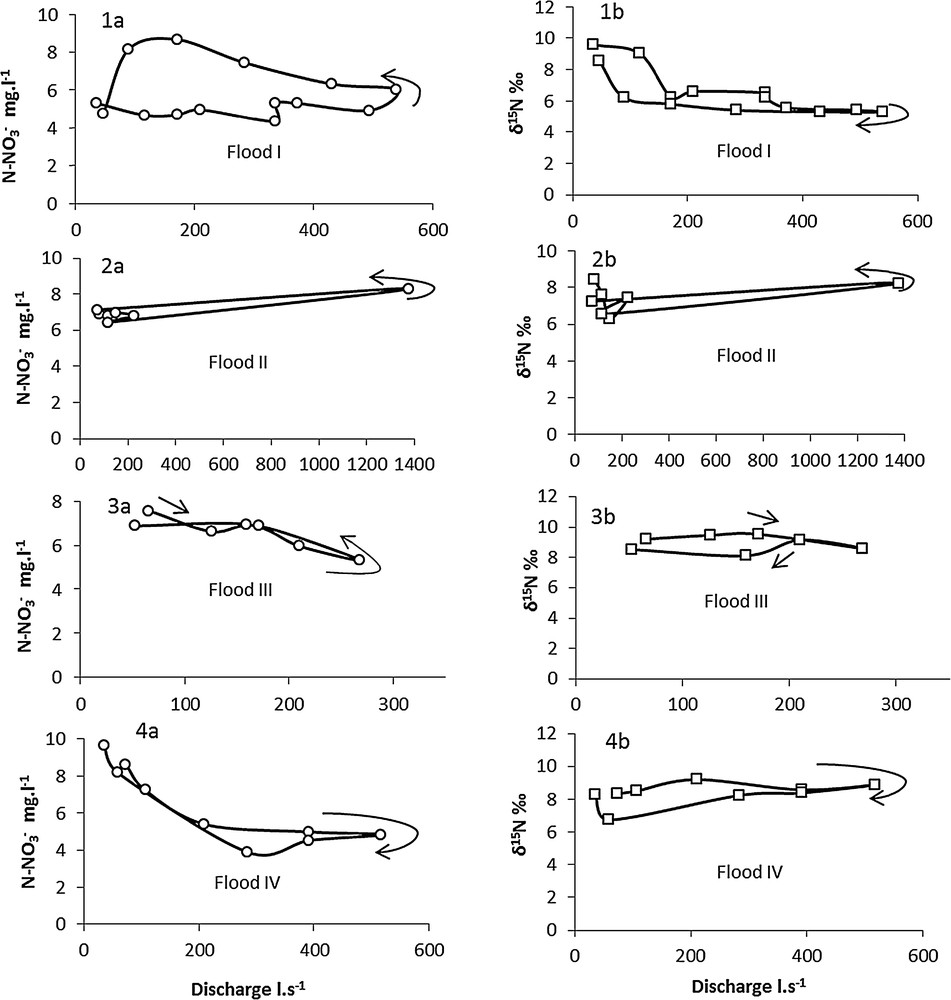
Hysteresis pattern for the four main flood events (I to IV) at the outlet of Montoussé catchment. N–NO3– concentration versus discharge (1a to 4a) and δ15N–NO3– versus discharge (1b to 4b). Arrows show the direction of the hysteresis during the flood event: clockwise or anticlockwise.
During the floods (except flood event II), a dilution of N–NO3– concentration by rainwater and a decrease in isotopic values could be observed.
3.5 Spatial variations
The water samples collected on 24 April across the watershed had very distinct values both for nitrate concentration and isotopic composition (Fig. 6, black dots). The hydrological conditions were the same as in March. Nitrate concentrations and δ15N isotopic signatures were very different, depending on the sampling site and its characteristics. The highest concentration of nitrate was found in sand lenses with a similar isotopic composition as in the northern tributary. It was assumed that the isotopic signatures of the sand lenses corresponded to soil solutions and deeper waters. The isotopic composition of soil solutions was on average 13.2‰ and the N–NO3– concentration was about 15.2 mg·L−1. The spring was between two fields bordered by two grass strips. This spring and ditch waters exhibited the highest isotopic compositions, 35.1‰ and 29.9‰ respectively, and a nitrate concentration of 7.4 and 38.9 mg·L−1 respectively.

Summary of the spatial (black dots) and temporal (white dots) variations of δ15N–NO3– ‰ versus N–NO3– (mg·L−1) of water sampled in the Montoussé catchment from January to March 2013. The source highlighted is the fertiliser and the major process is denitrification. Rain and water from sand lenses were two secondary sources of water.
The stream waters sampled in the northern tributaries had a higher isotopic composition than the southern tributaries at 12.9 and 10.7‰ respectively. The N–NO3– concentration was also lower, at 2.1 and 8.6 mg·L−1 respectively. The N–NO3– concentration of the spring bordered by two grass strips was only 1.7 mg·L−1. The ditch sampled in the south had the same N–NO3– concentration as in the southern tributaries at 8.8 mg·L−1.
This spatial sampling allowed the determination of the concentration and isotopic composition ranges for different sources of water, upstream to downstream. It enhanced understanding of the processes (retention and leaching) at catchment scale.
4 Discussion
The isotopic composition of nitrate in stream waters at the outlet of the catchment showed that they were mainly supplied by mineral fertiliser inputs during the study period (Cravotta, 1984; Fogg et al., 1998; Lee et al., 2008; Mariotti and Létolle, 1977; Xue et al., 2009). However, this flood survey revealed a contribution of different sources and processes. During the flood flows, the stream water resulted from a mixing of ground water and surface water, soil solutions and rainwater which directly generated subsurface flow and surface runoff respectively. When nitrates are transferred from the soil to stream waters, the isotopic signature is changed by fractionation during biogeochemical processes. Moreover, in agricultural areas, the volatilisation of ammonium generates a significant isotopic fractionation as well as during the denitrification process. That is why the isotopic signature of nitrate in the stream waters differed from their main primary source, i.e. fertilisers (Kellman and Hillaire-Marcel, 2003; Mariotti and Létolle, 1977).
The spatial variations of nitrate concentration and its isotopic composition allowed an interpretation of the temporal variations during the main flood events at catchment scale.
In this study, the general variations of nitrate concentration and its isotopic composition were mainly controlled by hydroclimatic fluctuations, primarily dependent on flood events.
4.1 Dilution by rainwater and surface runoff
The global increase in δ15N–NO3– and NO3– concentration from January to March could first be explained by the decrease in the frequency and intensity of rain. The beginning of the period was characterised by low isotopic composition (Fig. 3b). It revealed the dilution of nitrate by rainwater and surface runoff. Rain waters, which have an isotopic composition close to 0 ‰ (Cravotta, 1984; Heaton, 1986; Xue et al., 2009; Table 1) decreased δ15N–NO3– in the stream water. During the rising limb of the hydrograph, when the contribution of rainwater and surface runoff reached their maximum, a rapid decrease could be observed in nitrate concentration and δ15N isotopic signature due to dilution by rainwater (Fig. 5). Flood events I, III and IV were characterised by rainwater dilution. The chloride concentration and sulphate concentration also decreased during the falling limb of floods, confirming the dilution effect.
4.2 Groundwater and subsurface runoff contributions
In contrast, the patterns of flood event II (Fig. 5, Fig. 2a and 2b) revealed another origin of the water. The rapid increase in water level with the increases in δ15N–NO3– and nitrate concentration suggests a greater contribution by subsurface and groundwater flows (Probst, 1985). The soil solutions in subsurface flow are transported in large quantities into the main stream. The soil solutions had higher nitrate concentrations and higher isotopic ratios (Fig. 6, sand lenses).
After the peak flow during the recession period, the contributions of subsurface flow and deep waters increased and then nitrate concentration and δ15N–NO3– both presented a general increasing trend due to soil leaching and ground water supply.
4.3 Denitrification process
The variations in nitrate concentration showed a different behaviour from sulphate and chloride concentrations, the main compounds of the mineral fertiliser applied in this catchment. The variations in nitrate concentration revealed processes that affect only nitrate. Grass strips along the river trap nitrates by reduction processes during soil leaching (Sebilo et al., 2003) and soil-river transfers. Anaerobic conditions accelerate the denitrification process (Kendall, 1998; Sebilo et al., 2003, 2006). The type of soil of the study catchment is frequently saturated during heavy rain events because of the amount of smectite clay and also in the sand lenses that allow water retention. Moreover, hydromorphic layers were found along the soil profiles that are evidences of anaerobic conditions. During the heavy rains in January, the denitrification process was enhanced by the grass strips and very humid conditions, as already shown by Sebilo et al. (2003). Nitrates leached into the river were then enriched in 15N (Kellman and Hillaire-Marcel, 2003; Mariotti, 1984; Sebilo et al., 2006). The spring was sited between two parcels bordered by two grass strips. The denitrification processes were clearly shown by the high isotopic value and the low nitrate concentrations compared to the rest of the watershed (Fig. 6). The ditch, also located between two grass strips, had a low nitrate concentration, similar to that of the water sampled in the southern tributary, but δ15N was high. This could also be explained by the denitrification process occurring in the adjacent soil. The ditch and the spring maintained the water in an anaerobic condition, before it reached the stream water. During the low water periods, nitrate content and its δ15N isotopic signature presented opposite variations, mainly controlled by denitrification processes, when soil leaching and surface runoff were limited. The water residence time in soil was higher in these conditions.
In summary, the relationship between δ15N–NO3– and 1/NO3– in all the water sampled during the study period in the Montoussé catchment is shown in Fig. 6.
The cluster of points lies between two drivers. The first is represented by the inputs: rain water inputs with low nitrate concentrations and low isotopic signatures, and spreading of fertilisers with a low isotopic value but generally inducing a high nitrate concentration. The second is controlled by denitrification processes that increased the isotopic signature.
5 Conclusions
A nitrate survey on a small experimental agricultural catchment highlighted important variations in both nitrate contents and their 15N isotopic signature over three months with high resolution during flood events. These variations appeared to be controlled in such a catchment mainly by mineral fertiliser inputs, rainwater dilution and denitrification processes. To enhance understanding, spatial sampling allowed this general pattern to be completed and highlighted the isotopic signature of different sources of water in which nitrates were affected by various biogeochemical transformations. Water from sand lenses provided information on soil solutions and deep water, and water collected in the upstream part of the basin was controlled by the denitrification process. The isotopic signatures of mineral fertilisers, the main source of nitrogen in this catchment, were modified during the chemical transformations in the soil. Anaerobic conditions in grass strips and deep water in the soil significantly accelerated this reaction. The concentration profiles of chloride and sulphate, supplied mainly by mineral fertiliser, confirmed the reduction reaction affecting nitrates alone.
The flood survey in this catchment proved to be of interest for detecting the main sources of nitrates, variations during the floods and factors that ultimately control nitrate dynamics.
The next step would be to analyse the oxygen isotopic signature of nitrate to trace the different sources more effectively and to measure the isotopic composition of soil solutions from experimental plots in the catchment. It would also be very interesting to follow seasonal variations over a complete hydrological cycle to enhance understanding of the impacts of fertiliser spreading and other agricultural practices, and of the hydroclimatic fluctuations in such “semi-arid” conditions.
Acknowledgements
This work has been done on the Montoussé experimental catchment at Auradé, which is supported by CNRS-INEE and belongs to the SOERE RBV and to the international CZEN. This catchment is also a regional platform of research and innovation in Midi-Pyrenees. We thank the farmers of the “Groupement des Agriculteurs de la Gascogne Toulousaine” (GAGT) for the information on agricultural practices, AZF and GPN-Total for their financial support to survey the long term variations of nitrate concentration from 1985 to 2011. Sylvain Ferrant and Vincent Bustillo from CESBIO are greatly thanked for their help in the field to identify the humid areas. Finally, we acknowledge Claire Tarring for improving the English and the anonymous reviewers for their very helpful comments.