

1 Introduction
A basic tenet in exploration geochemistry is that elevated concentrations of metals and compounds in ore deposits will disperse with time and be recorded as aberrations in normal background levels. The basis of this theory is well founded in the principles of chemistry because the tendency of all systems is to become random and equal in energy so that high concentrations will disperse with time over vast areas, even if kinetics slow this process. Exploration geochemistry proves that this concept is valid because there are numerous cases where “leakage” of elements from deposits at depth is evident (Cameron et al., 2004, 2010; Kelley et al., 2004). The new challenges are identifying those particular elements and media that truly reflect dispersion from ore deposits below the surface (Coker, 2010). Given the paucity of recent discoveries of ore deposits at the surface (Marlatt and Kyser, 2011), most new discoveries will be made at depth, and thus we must be able to “see” them from the surface with geochemistry (Cohen et al., 2010).
A variety of different surficial media are used in exploration for undercover mineral deposits with a variety of different selective leaches to target specific phases or elements (Cornelius et al., 2007; Hall et al., 1996). One such medium is vegetation, including trees and their various organs collected as part of biogeochemical exploration. Biogeochemistry was first adapted as a tool for mineral exploration in response to new technologies needed for mineral exploration methods that were cheaper and more time efficient (Dunn, 2007a; Warren et al., 1952). Plants can reveal the geochemistry of the substrate through amalgamation of lateral substrate geochemical signatures from stream sediments and aquifers through their root systems, and directly through penetration of the roots into the underlying substrate (Dunn, 2007b). The particular mechanism or mechanisms a plant employs mostly depends on the kind of root system it has, such as spreading lateral roots or deep sinker roots. A variation on the use of plants is the use of trees cores, which reflect a time sequence of element migration in the area (Kozuskanich et al., 2009; Watmough, 1997). A temporal record is required due to the global influence of anthropogenic activity (Kelley and Hudson, 2007; Lahd Geagea et al., 2008). Tree rings that reflect pre-global industrialization because of their age should be a more reliable record of elements that may have migrated from deposits below as opposed to those that were deposited from atmospheric sources (Kozuskanich et al., 2009).
The utility of Pb isotopes to distinguish geogenic and anthropogenic Pb and metal sources has been demonstrated in a study of rock, soil, and plant samples collected at 3 km intervals along a 120 km long transect across the city of Oslo, Norway. These media record a general increase towards the north, the prevailing wind direction, in 207Pb/206Pb ratios, and an increase in Pb concentrations around urban areas. In addition, low variability in plant samples and O-horizon soil profiles compared to rocks and mineral soils, were observed along the transect and interpreted as mass fractionation of Pb as a result of biological processes, therefore resulting in less radiogenic and more constant Pb isotopic compositions that differ from the underlying mineral soils (Reimann et al., 2008). However, other studies on media such as peat bogs on local, regional or global scales demonstrate that anthropogenic Pb emitted in the atmosphere from leaded gasoline, coal burning and metallurgy has been dispersed worldwide, and this Pb has a high 207Pb/206Pb near 0.9. Pre-anthropogenic Pb isotopic compositions in continental archives of atmospheric deposition like peat bogs and soils (Kylander et al., 2009; Shotyk and Krachler, 2010; Shotyk et al., 1998) indicate that the Pb isotopic signature is regionally, not locally, defined. Thus, the Pb isotopic signatures of the biogenic samples from Oslo more likely reflect 20th century anthropogenic Pb and local geogenic background Pb than mass-dependent or mass-independent fractionations, which are exceedingly small for heavy elements. The relationship between Pb concentrations and isotopic compositions in these media indicates mixing between two end-members, one of which is geogenic Pb, and the other having 207Pb/206Pb near 0.9 that are anthropogenic.
In this study, we examine secondary dispersion of radiogenic Pb isotopes and elements that are mobilized from the deeply buried unconformity-related uranium deposit at Cigar West in the Athabasca Basin in Canada, and how this Pb is manifest in media at the surface. We also compare the Pb isotopic compositions and concentration of elements in black spruce (Picea mariana) and jack pine (Pinus banksiana), a study similar to one that Jean Carrignan did with snow. The proposed mechanism by which elements migrate to the surface involves transport by gaseous complexes and compounds released by microbial activity in the ore to eventually adhere to clay minerals within surficial soils and tills (Plant et al., 1988). Thus, the unique radiogenic Pb isotopic compositions and pathfinder elements from the ore will be recorded in surficial clay and vegetation (Kelley et al., 2006; Leslie et al., 2014). Numerous multimedia, multi-element, multi-digestion geochemical surveys over known uranium showings and deposits in and around the Athabasca Basin in northern Saskatchewan suggest that secondary dispersion processes result in anomalies in pathfinder elements in certain soil components and vegetation over the deposit and along deposit related fractures (Bonham-Carter and Hall, 2010; Dunn, 1984; Earle and Drever, 1983; Earle and Sopuck, 1989). To trace the radiogenic Pb and pathfinder element signal originating from the high-grade uranium deposit over 450 m to the surface, sampling involved collecting tree cores, as well as twigs and needles and A2, B and C soil horizons from which clay fractions were separated, over and far from the deposit. Trees represent an advatageous sampling media for exploration geochemistry because they occur in most places in Canada and their root systems are vast, thereby collecting mobile elements over a significant width and depth. In addition, their chemical compositions should reflect a chronology of their chemical environment.
2 Geological considerations
The Cigar Lake and Cigar Lake West deposits are located in the eastern part of the Athabasca Basin and hosted in the Athabasca Group, which unconformably overlies the transition between the western Wollaston and eastern Mudjatik basement domains (Fig. 1A). The basal Wollaston domain includes graphitic units, with many deposits located at the metamorphosed contact between Archean granitoid gneisses and these graphitic metapelite units. The basal sequence of the Athabasca Group (Manitou Falls and Fair Point formations) consists of permeable coarse- to medium-grained, hematite-rich conglomerate and sandstone with paleocurrent directions predominantly from the east (Hoffman, 1988; Ramaekers et al., 2007). The basal portion of the Manitou Falls Formation is composed of coarse-grained conglomerate beds with attributes that reflect deposition in high energy braided streams, or alluvial fan settings. The lower coarse-grained interval is overlain by finer grained sandstone with minor conglomerate that is marked by abundant trough cross bedding and relatively rare siltstone layers. This middle interval represents deposition in more distal braided stream environments, and due to the much better sorting, has coarse-grained textures, more extensive quartz cement, and lower hydraulic conductivity. The sandstone layers that make up the upper third to half of the Manitou Falls Formation consist of medium-grained sandstone with abundant ripple marks, rare thin mudstone layers and mud rip-up clasts. This sandstone is consistent with deposition in lower energy distal braided stream systems to possibly braid deltas. The detrital material that makes up the Manitou Falls sandstone units is composed of 95–100% well rounded quartz with minor muscovite and rare heavy minerals, such as Fe-Ti oxides. The absence of feldspar and rarity of any other minerals further suggests intense weathering in the source area and relatively long distance transport.
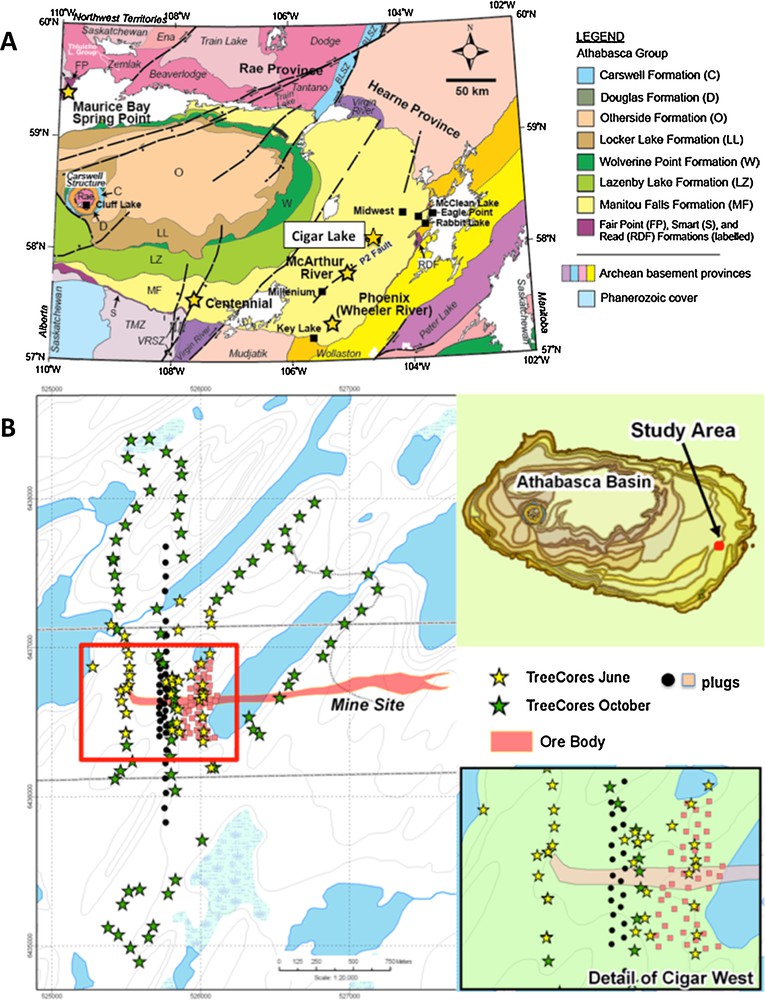
(Color online.) A. General geology of the Athabasca Basin in N. Saskatchewan, Canada, and location of the Cigar Lake deposit (modified from Hoffman, 1988; Ramaekers et al., 2007). B. Location of the Cigar Lake West area in the Athabasca Basin. Stars indicate locations of tree cores and other symbols are tree plugs not discussed in this study.
The Manitou Falls Formation is unconformably overlain by a succession of less permeable marine sandstone, phosphatic siltstone, and phosphatic mudstone layers, the Lazenby Lake Formation, Wolverine Point Formation, respectively, which are in turn overlain first by sandstone (Locker Lake, Otherside and Tuma Lake Formations, and the William River Subgroup), then by shale (Douglas Formation), and finally by stromatolitic dolomite (Carswell Formation). These marine units in conjunction with the unconformities would be ideal environments in which evaporated seawater could permeate into the lower units.
The deposits at Cigar Lake are complex-type deposits hosted by clay-altered Athabasca Group sandstone and conglomerate within 50 m of the unconformity (Bruneton, 1993). A minimum age for the mineralization is 1467 ± 63 Ma (Fayek et al., 1997). The clay-size fraction of the alteration halo associated with the Cigar Lake uranium deposit consists of illite with subordinate kaolinite, sudoite (Al-chlorite), Fe-chlorite, hematite, and traces of an illite-chlorite mixed-layer mineral (Percival et al., 1993). Complex deposits are characterized by Ni, Co, Cu, Pb, Zn, and Mo sulfides and arsenide minerals in addition to uraninite, grading up to 80% U in high-grade areas (Cuney and Kyser, 2009). Clay-bounded, massive ore occurs as elongate pods and linear ore bodies of a high-grade core and lower grade halo along the unconformity and just above it in the overlying Athabasca Group. At the Cigar Lake deposit, one pod is 1.9 km long, 50 to 100 m wide and 20 m thick (Bruneton, 1987).
Portions of the Cigar Lake deposit, and specifically Cigar West, offer excellent sites for this study, with the presence of high-grade uranium mineralization known at depth, a database of historical geochemical surveys at the proximal Cigar Lake deposit, and relatively undisrupted surface conditions providing access to soil horizons and vegetation. There is also a relatively consistent nature of the geomorphology, vegetation and drainage across the study area. Cigar West is a relatively undisturbed length of 50 m wide mineralization that extends 500 m to the west of Cigar Lake (Fig. 1B). The mineralization, which is accompanied by high concentrations of Ni, As, Mo, and Co, straddles the unconformity, extending vertically into the sandstone along structures. The sandstone thickness is about 450 m with an alteration halo extending upward less than 200 meters from the mineralization. Glacial till is approximately 10–15 m thick and consists of boulders and fine sand with minor amounts of silt. The soil substrate in the boggy area is dominantly sand derived from erosion of the till.
The area over the Cigar West zone of mineralization is typical of Canadian Shield Boreal forest. Jack pine is the dominant tree species, with scattered black spruce, birch, and tamarack in wet areas. Mountain alder, dwarf birch, Labrador tea, minor leather leaf and reindeer moss dominate the underbrush and ground cover. The 50 by 50 m grid area was predominantly flat with gradual elevation gains to the north and south sections of the Cigar West grid. Within the 100 by 100 m grid and background 200 by 200 m grid sections, topography changes were more pronounced (Fig. 1B).
Historical drill core from six holes was available for sampling and a structural interpretation based on drilling and geophysical compilations was available from Assessment files. These structures may act as conduits for migration of elements from the ore deposit to the surface environment above.
3 Sample collection and analytical techniques
Soils and vegetation were sampled from 340 stations and tree cores from 220 sites (Fig. 1B). At most of the 340 stations, the A and B soils were available for collection, but only 283 sites were suitable for C-horizon soils. Sample collection was at 50 m spacing on an offset grid for 250 m on either side of the projected vertical extension of the Cigar West zone of mineralization, located beneath more than 450 m of Athabasca sandstones. To the north and south of this zone, the grid was expanded by 3 km to an offset grid of 100 m between sample stations.
At each site, a stainless steel shovel was used to expose the A, B and C soil horizons. Approximately 1 kg of the A-, B-horizon and C-horizon were collected with a stainless steel scoop, placed in individual zip-lock bags and labelled. These soil horizons were selected because they are easily accessible from the surface and easy to identify. The clay-sized fractions (< 2 μm) were extracted from the soil samples at the Queen's Facility for Isotope Research (QFIR) and analyzed by aqua regia digestion followed by analysis for 53 elements and Pb isotopes using Q-ICP-MS at Acme Labs. The technique for Pb isotope measurement at Acme Labs is similar to that at QFIR, except for the type of ICP-MS used, with three times longer counting times for mass 204 relative to all other masses. Clay minerals were separated because they have reactive, charged surfaces and significant surface area compared to other phases in soils (Velde, 1992). Data quality proved to be excellent, with RSD better than 10% for most elements.
In addition, vegetation samples at each site were collected from the ends of the bottom branches of the nearest black spruce and a few jack pine trees using stainless steel snips and placed in a sentry sample bag, filling the bag to capacity (∼ 200 g). The strategy behind analysis of vegetation samples is that this is a demonstrated medium for recording anomalies from uranium deposits at depth observed in previous studies (Dunn, 1984). All black spruce and jack pine vegetation samples were oven-dried at 80 °C for 24 h. Black spruce twigs and selected jack pine twigs and needles were sent to Acme Labs for reduction to ash at 470 °C to burn off all of the organic components. A 0.25-g portion of ash was digested in aqua regia and the solution analyzed by Q-ICP-MS by Acme Labs.
Tree cores were collected from both black spruce (Picea mariana) and jack pine (Pinus banksiana) trees using a Suunto Tree Corer (Fig. 1B). The largest trees were cored through the widest part of the tree trunk at chest height. All cored trunk wood was retrieved, wrapped in paper, sealed with tape and labelled. In June 2009, 110 cores were collected over the deposit and in September 2009, 110 cores of mainly spruce were collected to better define the background. During the June sampling program, two core samples were collected from each tree in an east–west and a north–south orientation, but only a north–south-oriented tree core sample was collected in September because results indicated a difference of less than 20% for all elements between the two orientations of cores from the same tree (Table 1).
Average differences in % and standard deviations (%) of element concentrations and Pb isotope ratios measured between east–west- and north–south-oriented cores from the same tree. Also shown is the number of samples that have concentrations of these elements above detection limits.
| Pine (EW–NS) | Spruce (EW–NS) | |||||
| Aver diff % | St dev (%) | n | Aver diff % | St dev (%) | n | |
| Al | 3.7 | 8.7 | 11 | 0.0 | 9.8 | 38 |
| Au | 9.5 | 18.1 | 2 | 11.0 | 7.5 | 3 |
| B | 0.1 | 15.7 | 13 | 1.6 | 11.0 | 52 |
| Ba | 1.9 | 6.7 | 13 | 0.4 | 5.0 | 52 |
| Ca | 1.0 | 4.2 | 11 | 0.9 | 4.4 | 48 |
| Cd | 1.0 | 10.6 | 10 | 1.3 | 9.9 | 29 |
| Ce | −2.1 | 10.3 | 7 | 16.0 | 24.6 | 14 |
| Co | 1.0 | 9.7 | 2 | 1.0 | 12.7 | 27 |
| Cr | −4.3 | 13.9 | 9 | 0.4 | 14.4 | 48 |
| Cs | 0.5 | 8.6 | 5 | 0.6 | 4.1 | 30 |
| Cu | 4.6 | 13.7 | 11 | 0.4 | 9.8 | 47 |
| Fe | −3.5 | 16.0 | 11 | 0.5 | 14.3 | 48 |
| K | −3.2 | 16.5 | 11 | 0.7 | 4.3 | 46 |
| La | 7.4 | 22.8 | 6 | 1.3 | 12.4 | 6 |
| Li | 0.4 | 11.2 | 20 | |||
| Mg | 0.4 | 5.7 | 11 | 0.8 | 8.6 | 49 |
| Mn | 0.0 | 6.3 | 11 | 0.2 | 4.7 | 42 |
| Mo | 1.5 | 9.6 | 14 | |||
| Na | −2.5 | 14.3 | 12 | 0.4 | 14.9 | 51 |
| Ni | 2.2 | 14.9 | 11 | 0.8 | 12.9 | 48 |
| P | −0.1 | 9.0 | 11 | 0.4 | 8.2 | 48 |
| Pb | 1.3 | 15.1 | 11 | 1.0 | 12.7 | 44 |
| Rb | 0.8 | 5.6 | 11 | 0.1 | 5.3 | 48 |
| S | −3.8 | 15.8 | 11 | 0.1 | 4.0 | 45 |
| Sb | 16.5 | 27.3 | 3 | 1.6 | 16.2 | 15 |
| Se | 2.9 | 11.1 | 4 | 1.6 | 8.2 | 9 |
| Si | 22.0 | 39.6 | 2 | 0.7 | 7.9 | 21 |
| Sr | 1.2 | 5.5 | 11 | 0.4 | 4.5 | 47 |
| Ti | 5.2 | 17.4 | 9 | 3.6 | 14.2 | 39 |
| U | 2.7 | 16.0 | 44 | |||
| V | 2.6 | 8.9 | 3 | 3.1 | 10.8 | 19 |
| W | 5.3 | 17.6 | 12 | 4.2 | 11.9 | 19 |
| Zn | 1.3 | 5.8 | 11 | 0.3 | 4.7 | 48 |
| 207Pb/206Pb | 0.6 | 3.8 | 13 | 0.1 | 2.9 | 52 |
| 206Pb/204Pb | −1.4 | 5.0 | 13 | 0.4 | 4.5 | 52 |
| 207Pb/204Pb | −0.8 | 2.3 | 13 | 0.5 | 3.5 | 52 |
| 208Pb/204Pb | −0.6 | 2.1 | 13 | 0.5 | 3.7 | 52 |
The diameters of the trees ranged over 8–18 cm, averaging 12 cm. The cores were lightly sanded to reveal the rings and remove surface contamination. The ages of the trees ranged from 18–150, with average of 39 years. The widths of each ring was measured to verify that that they decreased toward younger rings, thus indicating that the tree had not been unduly stressed, which can affect metal uptake (Shortle et al., 1997; Watmough, 1997, 1999). Analysis of tree core material from trees that predate the drilling and surface activities at Cigar West (1980–1983) was preferred, although about 35% of the trees were younger than 1983. Rings from 5–20-year intervals of growth dating prior to 1990 were then removed for analysis.
Samples of the years selected were first cleaned with deionized water in glass vials in an ultrasonic bath for 10 minutes. All samples were placed in a 60 °C oven to dry overnight. Approximately 100–200 mg of sample was weighed into Savillex™ screw top beakers and 2 mL of concentrated distilled nitric acid added. The containers were placed on a 70 °C hotplate for 3 h for total digestion, then five drops of hydrogen peroxide were added to remove dissolved organics and produce a clear solution after heating to 70 °C on a hotplate overnight. Several samples required more than treatment with peroxide to remove all dissolved organic material. The samples were then dried at 70 °C, redissolved in 2% HNO3 and diluted to 1–5 g with 2% HNO3 with 1 ppb Indium as an internal standard to correct for fluctuations in sample flow-rate, matrix effects and instrument sensitivity. Metal concentrations and Pb isotopic compositions were determined at QFIR with a Thermo Finnigan Element 2 high-resolution magnetic sector inductively coupled plasma mass spectrometer (ICP-MS), which is capable of both low-level analyses as well as high-quality Pb isotopic compositions. The Pb isotope ratios were calculated using the signal intensities (counts/s) in low-resolution mode, with corrections for interferences from Hg and mass fractionation monitored using Tl in the solutions and externally with in-house and NIST Pb isotope standards (NBS 981, normal Pb and NBS 983, radiogenic Pb). For each sample, 204, 206, 207, 208 and 202 were measured, blank subtracted and 204Pb was corrected for 204Hg interference using 202Hg. Mass bias corrections were not necessary as NIST standard values were near to certified values and well within the limits necessary in order to distinguish samples in the study. Concentrations were corrected for instrument drift and matrix using 115In as an internal standard and external calibration for element concentrations and blank subtraction. In total, 219 core intervals were analyzed at QFIR for all elements, with Al, B, Ba, Ca, Cr, Cu, Fe, K, Mg, Mn, Na, Ni, P, Pb, Rb, S, Sr, W, U, Zn, and Pb isotopes detected in most samples (Tables 2 and 3).
Median concentrations and reproducibility for analytical duplicates of black spruce.
| Element | Median concentrations (ppb or ng/g) | Aver diff % | n |
| Al | 2750 | 9.9 | 6 |
| B | 42,000 | 6.2 | 6 |
| Ba | 19,000 | 5.3 | 6 |
| Ca | 350,000 | 5.3 | 6 |
| Cr | 200 | 21.5 | 6 |
| Cs | 20 | 5.0 | 3 |
| Cu | 700 | 13.2 | 6 |
| Fe | 2300 | 18.2 | 6 |
| K | 300,000 | 5.0 | 6 |
| Mg | 90,000 | 4.9 | 6 |
| Mn | 100,000 | 4.7 | 6 |
| Na | 100,000 | 9.4 | 6 |
| Ni | 100 | 18.8 | 6 |
| P | 35,000 | 12.2 | 6 |
| Pb | 40 | 8.9 | 6 |
| Rb | 1000 | 4.6 | 6 |
| S | 42,000 | 7.5 | 6 |
| Si | 25,000 | 9.8 | 6 |
| Sr | 3000 | 7.0 | 6 |
| W | 100 | 22.9 | 6 |
| Zn | 8000 | 6.5 | 6 |
| 207Pb/206Pb | 0.87 | 1.8 | 5 |
| 206Pb/204Pb | 25.31 | 7.0 | 5 |
| 207Pb/204Pb | 20.52 | 5.9 | 5 |
| 208Pb/204Pb | 52.47 | 6.1 | 5 |
Average, minimum, maximum, median and standard deviation of element concentrations and Pb isotopic compositions in pine and spruce tree cores.
| Element | Pine | Spruce | ||||||||||
| AVERAGE | MIN | MAX | Median | St dev | Count | AVERAGE | MIN | MAX | Median | St dev | Count | |
| Al | 1966 | 691 | 3738 | 1675 | 971 | 24 | 2157 | 269 | 6109 | 2224 | 1022 | 95 |
| As | 14 | 6 | 24 | 13 | 9 | 3 | 19 | 4 | 33 | 22 | 14 | 5 |
| Au | 19 | 4 | 66 | 11 | 22 | 7 | 20 | 9 | 41 | 19 | 9 | 15 |
| B | 10,147 | 1409 | 30,538 | 5600 | 8880 | 25 | 23,369 | 1567 | 88,907 | 21,733 | 17,006 | 103 |
| Ba | 5902 | 1149 | 19,607 | 3024 | 4961 | 26 | 13,806 | 1997 | 27,846 | 14,343 | 6684 | 106 |
| Bi | DL | DL | DL | DL | DL | 0 | 11 | 3 | 65 | 6 | 17 | 12 |
| Ca | 135,602 | 73,849 | 289,765 | 102,747 | 62,181 | 24 | 380,709 | 76,837 | 879,181 | 395,925 | 167,775 | 103 |
| Cd | 43 | 9 | 123 | 36 | 30 | 23 | 25 | 5 | 181 | 13 | 38 | 46 |
| Ce | 11 | 4 | 43 | 6 | 11 | 16 | 7 | 5 | 11 | 8 | 2 | 9 |
| Co | 9 | 7 | 14 | 8 | 2 | 7 | 14 | 5 | 43 | 11 | 8 | 56 |
| Cr | 74 | 21 | 202 | 70 | 48 | 24 | 222 | 21 | 1672 | 156 | 245 | 103 |
| Cs | 10 | 5 | 20 | 9 | 5 | 10 | 19 | 4 | 44 | 19 | 11 | 62 |
| Cu | 461 | 177 | 1387 | 376 | 278 | 24 | 730 | 113 | 1752 | 728 | 383 | 102 |
| Fe | 12,543 | 1856 | 37,993 | 10,524 | 10,495 | 24 | 36,504 | 2551 | 154,123 | 25,843 | 34,617 | 104 |
| Gd | 8 | 4 | 9 | 8 | 2 | 4 | 9 | 5 | 12 | 8 | 3 | 9 |
| Hg | DL | DL | DL | DL | DL | 0 | 21 | 12 | 31 | 21 | 7 | 13 |
| K | 145,109 | 59,107 | 289,747 | 99,531 | 76,755 | 23 | 214,079 | 55,047 | 392,716 | 236,413 | 79,708 | 101 |
| La | 11 | 4 | 39 | 7 | 10 | 11 | 14 | 3 | 50 | 7 | 18 | 6 |
| Li | 27 | 21 | 34 | 27 | 9 | 2 | 52 | 21 | 124 | 48 | 21 | 37 |
| Mg | 69,556 | 25,409 | 150,766 | 44,938 | 42,118 | 24 | 100,285 | 20,273 | 252,815 | 98,510 | 46,888 | 105 |
| Mn | 11,054 | 2558 | 36,101 | 7167 | 9660 | 23 | 54,714 | 9249 | 161,640 | 50,662 | 33,651 | 90 |
| Mo | DL | DL | DL | DL | DL | DL | 32 | 7 | 233 | 21 | 41 | 42 |
| Na | 43,249 | 5490 | 144,240 | 25,248 | 39,552 | 26 | 66,019 | 5811 | 739,064 | 44,167 | 96,217 | 106 |
| Nb | 33 | 20 | 48 | 32 | 14 | 3 | 89 | 25 | 207 | 80 | 51 | 18 |
| Nd | 6 | 4 | 7 | 7 | 2 | 3 | 5 | 4 | 7 | 6 | 1 | 3 |
| Ni | 115 | 23 | 272 | 71 | 84 | 24 | 223 | 19 | 1131 | 179 | 199 | 105 |
| P | 13,211 | 1390 | 34,845 | 10,725 | 8458 | 24 | 11,475 | 595 | 53,326 | 7573 | 9942 | 104 |
| Pb | 26 | 4 | 139 | 20 | 29 | 24 | 40 | 5 | 256 | 34 | 34 | 86 |
| Rb | 535 | 202 | 1045 | 374 | 277 | 24 | 922 | 281 | 2703 | 916 | 439 | 105 |
| S | 17,717 | 7149 | 38,267 | 11,782 | 10,590 | 23 | 29,018 | 5175 | 79,405 | 30,066 | 14,761 | 102 |
| Sb | 6 | 4 | 8 | 6 | 2 | 4 | 23 | 4 | 276 | 8 | 55 | 39 |
| Se | 9 | 4 | 21 | 8 | 5 | 11 | 1455 | 27 | 2572 | 1818 | 901 | 12 |
| Si | 1336 | 1096 | 1535 | 1357 | 184 | 4 | 12,620 | 1318 | 60,590 | 2742 | 15,228 | 68 |
| Sr | 2351 | 800 | 7537 | 1382 | 1761 | 24 | 3672 | 530 | 7513 | 3836 | 1796 | 104 |
| Ti | 33 | 5 | 131 | 22 | 30 | 21 | 65 | 7 | 587 | 45 | 76 | 82 |
| Tl | 6 | 4 | 8 | 5 | 1 | 6 | 7 | 4 | 13 | 6 | 2 | 33 |
| U | 24 | 3 | 92 | 19 | 22 | 25 | 23 | 5 | 112 | 17 | 17 | 73 |
| V | DL | DL | DL | DL | DL | 0 | 18 | 7 | 57 | 14 | 12 | 43 |
| W | DL | DL | DL | DL | DL | 0 | 132 | 17 | 472 | 100 | 101 | 61 |
| Zn | 2955 | 768 | 10,081 | 2063 | 2299 | 23 | 6806 | 1236 | 19,140 | 6543 | 3498 | 105 |
| Zr | 24 | 12 | 38 | 22 | 13 | 4 | 58 | 20 | 280 | 28 | 90 | 8 |
| U | 24 | 3 | 92 | 19 | 22 | 25 | 23 | 5 | 112 | 17 | 17 | 73 |
| 207Pb/206Pb | 0.66 | 0.43 | 0.80 | 0.71 | 0.11 | 26 | 0.77 | 0.44 | 0.89 | 0.79 | 0.09 | 106 |
| 206Pb/204Pb | 28.90 | 20.22 | 43.41 | 25.54 | 6.83 | 26 | 26.57 | 20.02 | 49.49 | 24.77 | 6.57 | 104 |
| 207Pb/204Pb | 18.50 | 16.11 | 25.79 | 18.29 | 2.06 | 26 | 19.77 | 16.19 | 34.14 | 18.15 | 4.08 | 104 |
| 208Pb/204Pb | 43.58 | 38.80 | 63.03 | 42.02 | 5.03 | 26 | 48.51 | 39.42 | 83.55 | 43.83 | 10.66 | 104 |
The quality of the analyses was monitored using a tree core standard prepared by QFIR (Kozuskanich et al., 2009) and NIST 1547 peach leave standard, each of which were measured for every 15 samples. The practical detection limit for all elements, including Pb isotopes, is 0.01 ppb. The Pb isotopic compositions recorded by the tree ring standard indicate accuracies in the 207Pb/206Pb ratio of ± 0.03 (2σ), 206Pb/204Pb of ± 1.77 (2σ), 207Pb/204Pb of ± 1.22 (2σ), and 208Pb/204Pb of ± 3.22 (2σ) for complete analysis of the tree rings and even better for the clay separates. The Pb isotopic compositions were also monitored using solutions prepared from the dissolution of a Pb wire from international CRMs for Pb isotopes, NIST-981, a common Pb standard and NIST-983, a radiogenic Pb standard. These standards were analyzed for every 6 samples and their results reflect how precisely and accurately the HR-ICP-MS can analyze a 1 ppb solution. The precision of the 207Pb/206Pb ratios based on these CRMs is 0.4% and the accuracy is ± 0.01, whereas those for the 206Pb/204Pb, 207Pb/204Pb, and 208Pb/204Pb are 2.5% and ± 0.22.
4 Results
There are marked differences in the average concentration of some elements in pine relative to spruce samples (Table 3). Tree rings from pine have less than half the concentrations of B, Ba, Ca, Cu, Fe, Hg, K, Mg, Mn, Mo, Na, Ni, Rb, Se, Si, Sr and Zn than do spruce tree cores. Other elements have similar concentrations in both types of trees (Table 3). The Ag and Cs concentrations are higher in the spruce than pine twigs, whereas Al, Cd, Cr, Sb, Se and Tl are higher in pine than spruce twigs. Different organs of vegetation are known to sequester different concentrations of some elements (Dunn, 2007a; Watmough, 1997), so that recognition of anomalies from a deposit at depth must be organ specific. However, the fractionation of Pb isotopes is minimal given the small differences in their masses, so Pb isotopic compositions in both species of tree are comparable.
Two different core directions (east–west and north–south) were collected for each tree in June 2009, to evaluate the homogeneity of particular elements in the tree cores and to evaluate the reproducibility of the analyses. With the exception of a few elements, all elements and Pb isotopic compositions in both pine and spruce are homogeneous throughout rings of the same year (Table 1). Moreover, the standard deviations for all elements are comparable to analytical uncertainties of less than 20% deduced from analyses of the standard wood and samples from opposite sides of the same core. Exceptions are Ce and Sb in spruce and La, Sb and Si in pine, in large part due to their low concentrations.
The isotopic composition of Pb can be a definitive indicator of migration of components from a variety of ore deposits (Bell and Franklin, 1993; Dickson et al., 1987; Gulson, 1983; Holk et al., 2003; Leybourne et al., 2009), especially for U deposits because the decay of U in high concentrations results in only 206Pb and 207Pb. As this radiogenic Pb moves during secondary migration into the environment away from the deposit, it mixes with common background Pb, thereby producing Pb isotopic compositions that have elevated 206Pb/204Pb and 207Pb/204Pb ratios, but lower 207Pb/206Pb ratios (Holk et al., 2003). Although the levels of Pb are low in the samples of the tree cores, averaging only 40 ppb (40 ng/g) in spruce (Table 3), and the precision is a few percent, the range in Pb isotopic compositions in the tree cores is significant (Fig. 2). For example, the 207Pb/206Pb ratios, which are the most accurate and precise ratios of all the Pb isotopes to measure by a mass spectrometer because of the similarity in their masses, range from 0.4 to 0.9 in the tree cores (Fig. 2). The population of 207Pb/206Pb ratios is not normally distributed, and cumulative probabilities define at least four potential populations, with the lowest, most radiogenic population having 207Pb/206Pb ratios less than 0.6 (Fig. 2). Samples with 207Pb/206Pb ratios less than 0.7 are normally considered radiogenic in the Athabasca Basin (Holk et al., 2003), so several of the tree cores record radiogenic Pb.
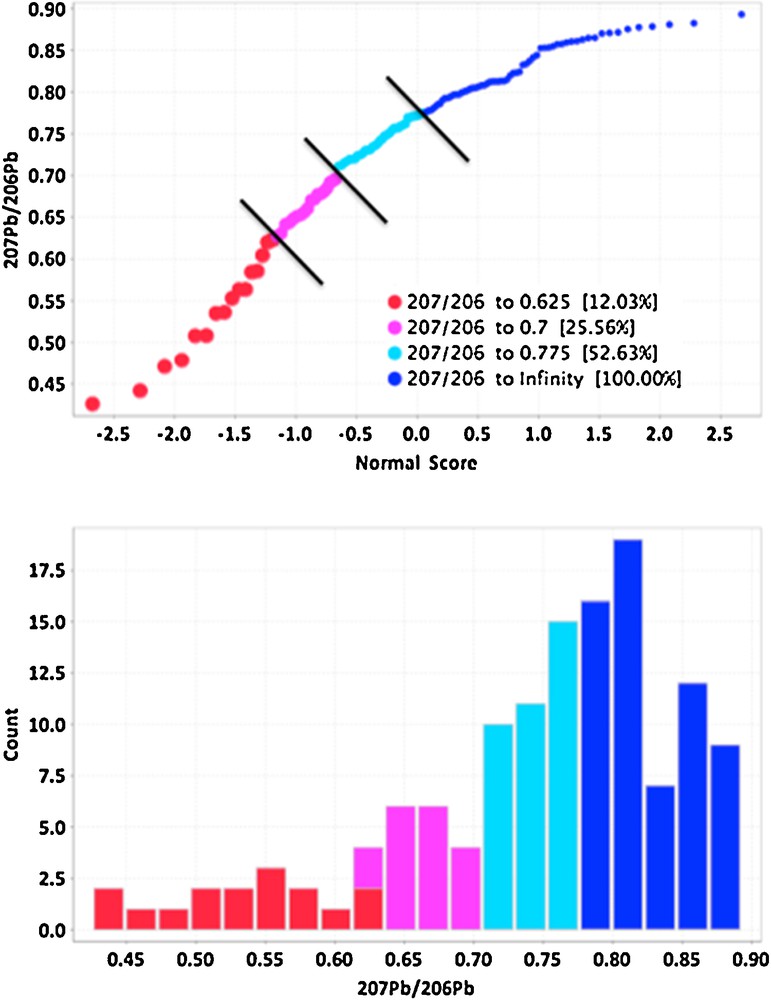
(Color online.) Cumulative probability plot of 207Pb/206Pb ratios in spruce tree cores (top) and histogram of 207Pb/206Pb ratios, both showing distinct populations of ratios, with those in red and purple having significant radiogenic Pb isotopic compositions of < 0.7.
The 207Pb/206Pb ratios of the selected media are all quite variable, although those closest to the surface, namely the spruce twigs (vegetation) and clays from the A2 soils are less radiogenic than the other media, with most samples having 207Pb/206Pb ratios of common Pb near 0.9 (Fig. 3). In effect, the median 207Pb/206Pb ratios are lowest and hence more radiogenic in the clays from the B and C soils, and the tree cores have a number of radiogenic samples, although the median 207Pb/206Pb ratio is less radiogenic than the clays from the B and C soils (Fig. 3). Element concentrations are much lower in tree cores and vegetation samples, including Pb and U contents, whereas clays from A2 and C soils tend to have the highest Pb and U concentrations of the surface media (Fig. 3). Although 207Pb/206Pb ratios tend to lower and thus more radiogenic values with decreasing Pb concentrations in tree cores, the clay samples from all soils record lower and thus more radiogenic 207Pb/206Pb ratios with increasing U concentrations (Fig. 3).
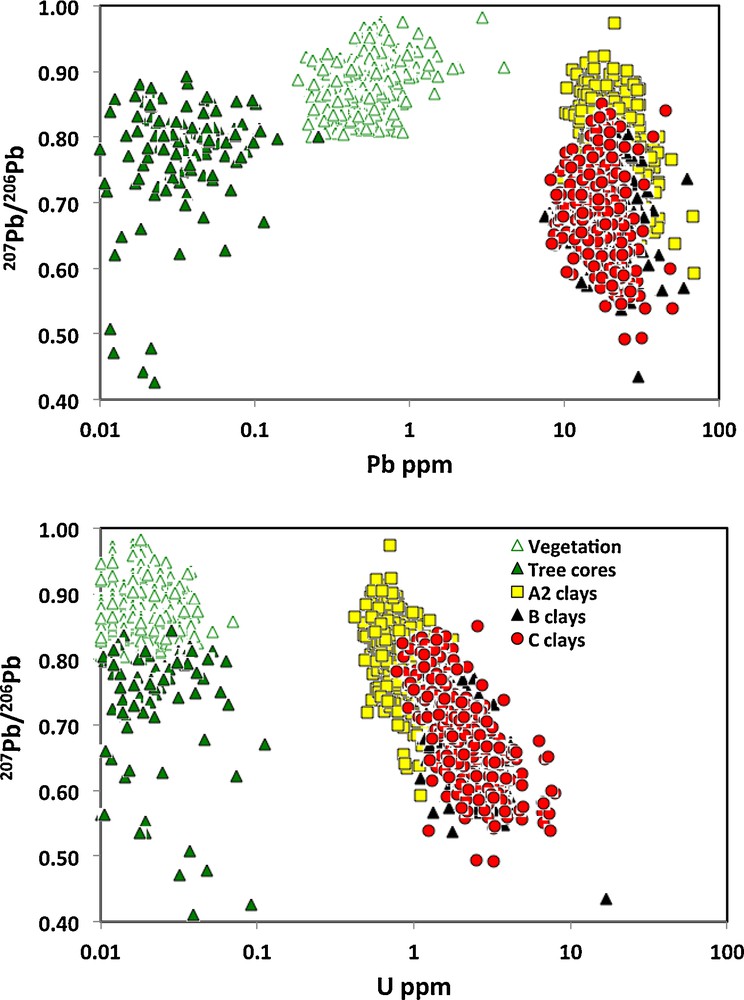
(Color online.) Relationship between 207Pb/206Pb ratios and log Pb and U concentrations in clays from A2, B, C soils and spruce tree twigs (Vegetation) and tree cores. Tree cores and clays from B and C soils have the lowest and most radiogenic 207Pb/204Pb ratios < 0.7, whereas clays from A2 soils and vegetation have higher and more common Pb ratios. Tree cores and vegetation samples have the lowest Pb and U contents, similarly for most other elements, whereas clays from A2 and C soils tend to have the highest Pb and U concentrations of the surface media. Masquer
(Color online.) Relationship between 207Pb/206Pb ratios and log Pb and U concentrations in clays from A2, B, C soils and spruce tree twigs (Vegetation) and tree cores. Tree cores and clays from B and C soils have the lowest and ... Lire la suite
Many elements display regular relationships with 207Pb/206Pb ratios in spruce tree cores. Exponential correlations with 207Pb/206Pb ratios include B, Ba, Ca, Cs, K, Mg, Mn, S, Tl, Zn and inverse relationship with 206Pb/204Pb and 207Pb/204Pb ratios (Fig. 4) and REEs. Since the lowest 207Pb/206Pb ratios are the most radiogenic (Holk et al., 2003) and are most likely to be derived from the ore body, these elements actually correlate inversely with radiogenic Pb. Thus, there are negative exponential correlations between radiogenic Pb derived from the deposit in the tree cores and the alkaline earths, alkali metals, B, and some chalcophile elements, so that negative anomalies of these elements are spatially related to the deposit. It is noteworthy that the 207Pb/206Pb ratios do not correlate with U concentrations in the tree rings because these elements should have different mobility characteristics.
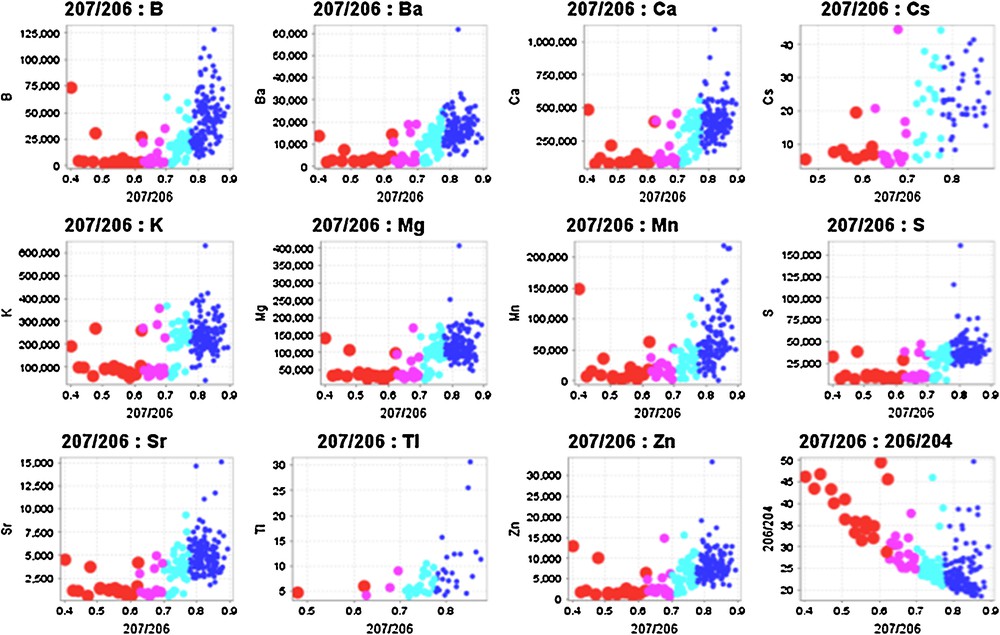
(Color online.) Relationship between elemental concentrations of B, Ba, Ca, Cs, K, Mg, Mn, S, Sr, Tl, Zn concentrations and 206Pb/204Pb ratios in spruce tree rings. Colors and sizes denote populations of 207Pb/206Pb ratios as defined on Fig. 2, with largest circles representing the lowest, most radiogenic 207Pb/204Pb ratios. Curved relationships indicate mixing between two major reservoirs, one with high 207Pb/206Pb ratios and high element concentrations and low 206Pb/204Pb ratios and the other with lower, more radiogenic 207Pb/206Pb ratios indicative of a Pb from a U-rich source. Masquer
(Color online.) Relationship between elemental concentrations of B, Ba, Ca, Cs, K, Mg, Mn, S, Sr, Tl, Zn concentrations and 206Pb/204Pb ratios in spruce tree rings. Colors and sizes denote populations of 207Pb/206Pb ratios as defined on Fig. 2, ... Lire la suite
The spatial distribution of 207Pb/206Pb ratios in the tree rings indicates that most of the lowest ratios are near the projection of the deposit to the surface (Fig. 5) and that background samples have the highest, least radiogenic ratios. Because trees sample such a large area of the surface with their root systems, they are an integrating medium. The tree cores show a similar spatial distribution in their 207Pb/206Pb ratios to the clays from the B and C soils, but not with the A soils or the vegetation samples.
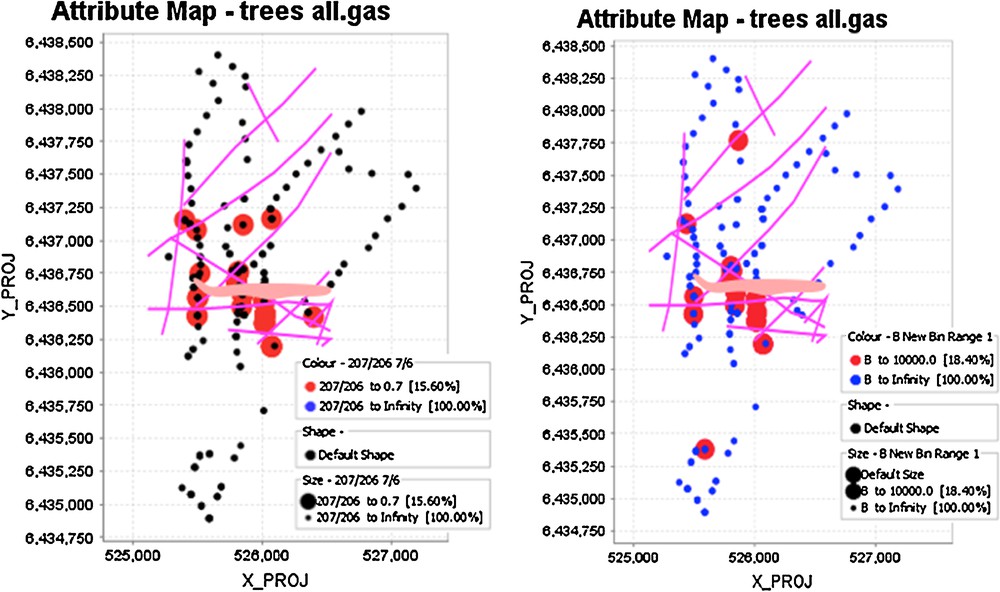
(Color online.) Spatial distribution of 207Pb/204Pb ratios (left) and inverse B concentrations in spruce tree cores. The large circles on the left diagram reflect 207Pb/204Pb ratios < 0.7, whereas those on the right diagram are B contents < 10,000 ppb, less than 10% of the population. Projection of the deposit to the surface is also shown, as are faults as lines.
5 Discussion
Differences in the concentrations of many elements between black spruce and jack pine in this study are similar to other studies that compare metal concentrations between species (Anderson et al., 2000; Cheng et al., 2007; Watmough, 1999) that indicate each species generally responds differently to the concentrations of metals in the environment. Many species are not useful as temporal records of their environment because of translation of elements among the rings (Cheng et al., 2007; Lageard et al., 2008; Watmough and Hutchinson, 2003), including Pb isotopes in some species (Patrick and Farmer, 2006). Although there are differences in the concentrations of some metals between both species, the relative spatial distribution of many elements in both is similar when there is overlap, particularly Pb isotopes. Thus, Pb isotopes, which do not record any isotopic fractionation in natural systems (Kyser, 2012; Shotyk and Le Roux, 2005; Weiss et al., 1999), should be similarly recorded in the tree rings of the two species.
Translocation of elements in black spruce is not evident in this study given that the element concentrations and Pb isotopic compositions are similar in both north–south- and east–west-oriented cores (Table 3). Other studies exploring for VMS deposits also found no evidence for translocation of elements in black spruce (Kozuskanich et al., 2009), although sampling of sapwood in spruce can result in significant differences in parts of the same ring especially if the tree was stressed (Prohaska et al., 1998). The ring widths measured in this study were the same for the samples taken from different oriented cores, thus indicating a lack of stress for the age of the rings sampled, and sapwood was avoided in most samples.
The spatial distribution of 207Pb/206Pb ratios in the tree core samples indicate that the most radiogenic values are in trees near the projection of the deposit to surface or structures that transect the deposit at depth (Fig. 6). The 207Pb/206Pb ratios in clay fractions from the A2, B and C soils are similarly distributed, and especially demarcate the NE-trending structures (Fig. 7).
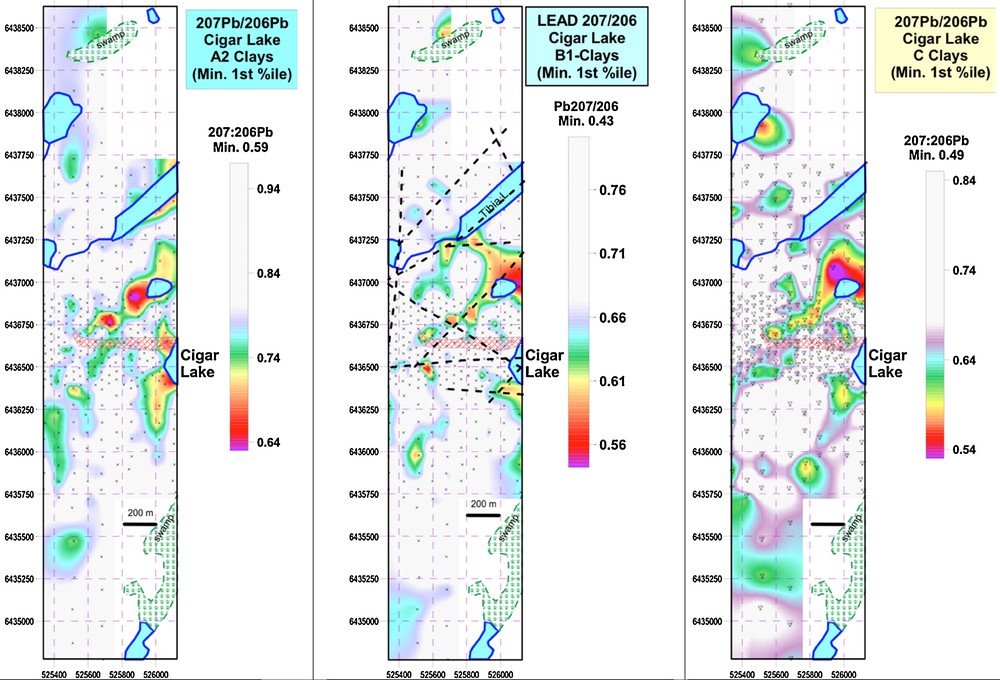
(Color online.) Spatial distribution of 207Pb/206Pb ratios in A2, B1 and C clays from soils at Cigar West. Other elements with very similar distributions include Ni, Co, REEs, Sr, Tl, K, Rb, Cs.
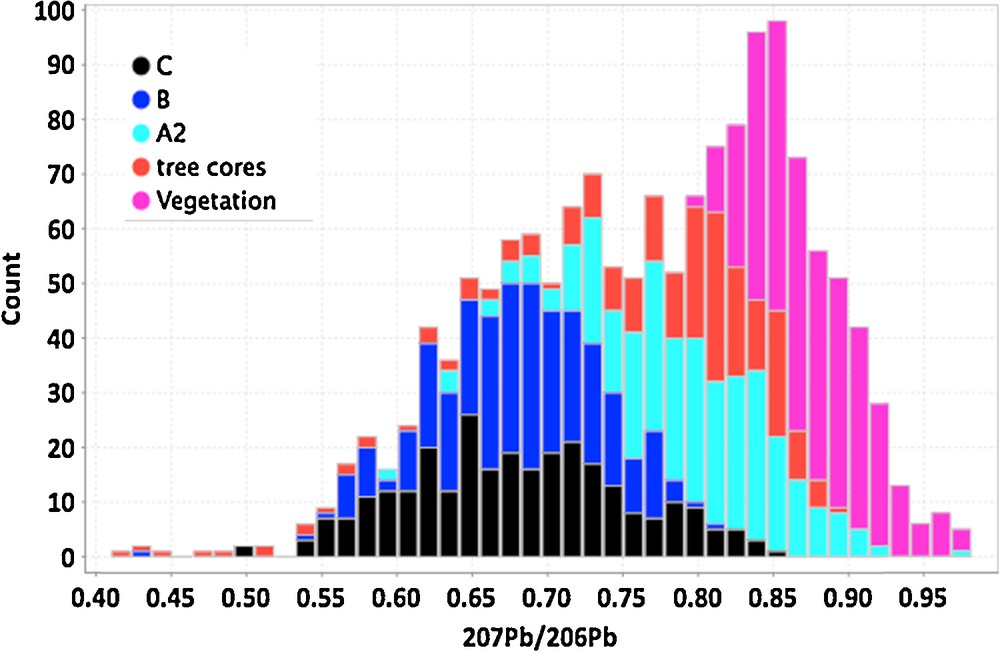
(Color online.) Histogram of 207Pb/206Pb ratios for surface media in the Cigar West area. The media include clay fractions separated from the C, B, A2 soil horizons, as well as tree cores and vegetation from black spruce trees. Median values are lowest, and thus have more radiogenic Pb from a U-rich source, in the C and B soils, less radiogenic in the A2 and tree core samples, and are least radiogenic in the vegetation samples, the latter being closest to the surface. Masquer
(Color online.) Histogram of 207Pb/206Pb ratios for surface media in the Cigar West area. The media include clay fractions separated from the C, B, A2 soil horizons, as well as tree cores and vegetation from black spruce trees. Median values ... Lire la suite
The tree rings sampled were from ages prior to significant anthropogenic activity in the Cigar Lake area. The 207Pb/206Pb ratios correlate with many elements including B, Ba, Ca, Cs, K, Mg, Mn, S, Sr, Tl, Zn and Pb, and because of the “biofilter” effect, these elements, or the lack thereof, define the deposit as negative anomalies relative to background. Similarly, elemental concentrations in spruce twigs delineated U, Bi, REE, Ba, Th, Co, Ni, Bi, Sn, Li, Mo, V, Fe and Al that best reflect the presence of U mineralization concealed beneath 450 m of Athabasca sandstone. However, the vegetation samples have a larger component of common Pb, which has high 207Pb/206Pb ratios.
The exponential correlation between radiogenic Pb and the elements recorded in the tree cores is not as pronounced in other media in this study, although the spatial response of the Pb isotopes in each medium is similar (Fig. 6). Tree cores are the only media that record negative anomalies in elements over the deposit, including the twigs of spruce trees. This reflects biofiltering associated with incorporation and distribution of elements into tree wood and other tissues. The low concentrations of many elements in trees over the deposit relative to the background may reflect the types of microbes affecting the flux of gases from the deposit as well as the ability of the organism to uptake specific elements (Watmough, 1997). Regardless of the process to produce negative anomalies in some element concentrations in the tree cores, when combined with radiogenic 207Pb/206Pb ratios that are definitive indicators of a U-rich source, they clearly demarcate the position of the deposit at depth (Fig. 5), and just as importantly, indicate areas that are less prospective. Those 207Pb/206Pb ratios that are not directly associated with the projected deposit at the surface are associated with faults that cut the deposit (Figs. 5 and 6), which are likely conduits for element migration from the deposits to the surface. Those elements in tree cores that correlate exponentially with 207Pb/206Pb ratios also correlate well with each other. Other notable correlations include those among the transition metals (Co, Fe, Ni), which are all used as coenzymes in plant systems and are normally incorporated in the tree in direct proportion to their concentration in the environment. The exponential relationships between element concentrations and 207Pb/206Pb ratios are indicative of mixing between two distinct sources, one with high 207Pb/206Pb ratios and low elemental concentrations and the other with higher, common Pb isotopic compositions and higher elemental concentrations.
Ideally, the 207Pb/206Pb ratios of all the surface media should have similar ranges and be similarly distributed spatially. However, there is a relationship between distance from the surface of the sample and the 207Pb/206Pb ratio wherein the clay fraction from the B and C soils have the lowest, and therefore more radiogenic ratios (Fig. 7), although many away from the projection of the deposit have common Pb isotopic ratios (Figs. 5 and 6). In reality, the media closest to the surface, namely the vegetation and A2 soil clays, have on average more common 207Pb/206Pb ratios (Fig. 7). The tree cores have among the most variable 207Pb/206Pb ratios.
These media actually sample their environment on different spatial and temporal scales. The B and C soil samples reflect spot samples of the till at depth, and should reflect components of the till and elements migrating to the surface laterally and from below. The A2 soil is also a spot sample, but of the more recent environment dominated by deposition of components from above. The trees sample a large area at depth, sampling components coming from below and in the till, but also from the recent environment near the surface, hence the large range in 207Pb/206Pb ratios. The vegetation samples reflect an environment dominated by recent aerosols deposited on their surfaces and by components deposited on the near surface in the past few years. Thus, the sample media that reflect the most recent Pb in the environment are vegetation and A2 soils, which are closest to the surface. These media are most susceptible to Pb deposited from aerosols, i.e. “from above”. Those with more radiogenic Pb isotopic compositions such as the B and C soils, reflect Pb from deeper sources, including those from radiogenic Pb and pathfinder elements migrating from the deposit at depth, especially along fractures. The common Pb recorded in the vegetation and less so in the A2 soils is consistent with anthropogenic common Pb deposited from smelting of Pb ores and gasoline.
The isotopes of Pb have a demonstrated utility in tracing the impact of anthropogenic Pb having high 207Pb/206Pb ratios on the environment. For example, the terrestrial record of common Pb having high 207Pb/206Pb ratios near 0.9 is recorded in soils, lake sediments and snow from Canada (Gallon et al., 2003; Simonetti et al., 2000a; Simonetti et al., 2000b; Tessier et al., 2005). A chronology of the concentrations and isotopic compositions of oceanic Pb in the North Atlantic Ocean for the past 220 years (Boyle et al., 2009) in annual bands of corals that grew in coastal seawaters near Bermuda and from seawater samples collected from the North Atlantic since 1980 indicate that anthropogenic Pb emissions in this area reflect the industrialization of North America since 1840 and the introduction of leaded gasoline in 1920 until its cessation by the late 1990s. Lead isotope ratios are the least radiogenic before 1900 due to the early dominance of Upper Mississippi Valley Pb ore in the USA. After 1900, 207Pb/206Pb ratios increase slightly until 1970 when sources of common Pb were phased out in the United States.
The tree cores record their lowest and therefore most radiogenic 207Pb/206Pb ratios of < 0.7 near the surface projection of the deposit and associated structures, particularly in tree rings that predate any exploration and drilling activity in the area. The median 207Pb/206Pb ratios increase in the order C, B soil horizon clays, tree cores, A2 soil clays and twigs because of the increasing contribution of common Pb with high ratios near 0.9 from anthropogenic sources that affect the shallowest media the most. Although this anthropogenic Pb as well as that from the background dominate the composition of all media at the surface and the contribution from the deposit at depth is diminished toward the surface, ore-related Pb is still present as a few percent of the composition of pathfinder elements and Pb isotopes.
The results from Cigar Lake West are similar to others involving multimedia such as rock, soil, and plant samples collected through the city of Oslo, Norway, that showed differences among the media, with the highest 207Pb/206Pb ratios recorded in the media closest to the surface. Multiple media record the affects from anthropogenic Pb emitted in the atmosphere from leaded gasoline, coal burning and metallurgy and dispersed worldwide (Bindler et al., 1999, 2004; Kylander et al., 2009). The relationship between Pb concentrations and isotopic compositions of the surface media at Cigar Lake West indicates mixing between two end-members, one of which has the lowest 207Pb/206Pb and reflects Pb that has migrated from the uranium deposit at depth, and the other having high 207Pb/206Pb ratios that are anthropogenic. Thus, exploration geochemistry requires an understanding of environmental geochemistry, and vice versa.
6 Conclusions
Radiogenic (low) 207Pb/206Pb ratios define the deep Cigar West deposit at the surface in tree rings from black spruce (Picea mariana) and jack pine (Pinus banksiana), as well as in other media. Radiogenic (low) 207Pb/206Pb ratios correlate inversely with many elements including B, Ba, Ca, Cs, K, Mg, Mn, S, Sr, Tl, Zn and Pb, that define the deposit as negative anomalies relative to background. Thus, Pb isotope ratios and depletions in many other elements in tree rings are definitive indicators of U mineralization at depth in tree rings.
The Pb in surface media at Cigar West is sourced from three major reservoirs: the deposit at depth, the Athabasca Group sandstones and till, and common Pb deposited at the surface, most likely from anthropogenic activity. This is reflected in the mean 207Pb/206Pb ratios of each medium wherein medium at the surface such as A2 soils, or a medium that has recently accumulated atmospheric Pb at the surface such as vegetation, have common Pb ratios. In contrast, those media more removed from the surface and thus recent atmospheric Pb accumulations, but are more influenced by geogenic Pb, including radiogenic Pb from the deposit at depth, have more variable and lower 207Pb/206Pb ratios. Thus, exploration geochemistry requires knowledge of the environmental geochemistry, even in areas as remote as the Athabasca Basin in Canada.
Acknowledgements
This research could not have been accomplished without the support of Areva and Cameco Corp who allowed us access to the Cigar Lake West area. Paul Stacey and Chris Pettman were critical in the design and execution of the sampling strategy. Funding for this project was from an NSERC CRD grant and Uravan Minerals. The Canadian Foundation for Innovation and the Ontario Research Fund graciously funded the equipment used in this project. The manuscript was vastly improved with the comments from Mostafa Fayek of the University of Manitoba and Cliff Stanley of Acadia University.